South America E-commerce Logistics Market Size and Share
Market Overview
| Study Period | 2020 - 2031 |
|---|---|
| Forecast Data Period | 2026 - 2031 |
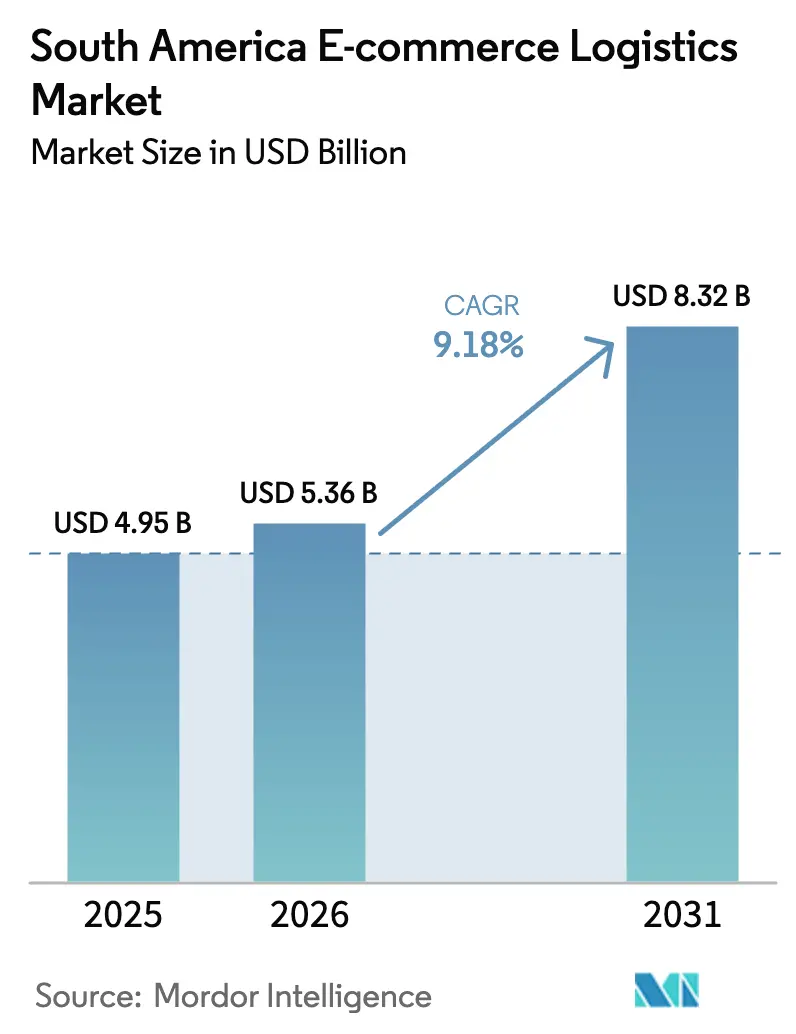
| Base Year Market Size (2025) | USD 4.95 Billion |
| Market Size (2026) | USD 5.36 Billion |
| Market Size (2031) | USD 8.32 Billion |
| Growth Rate (2026 - 2031) | 9.18% CAGR |
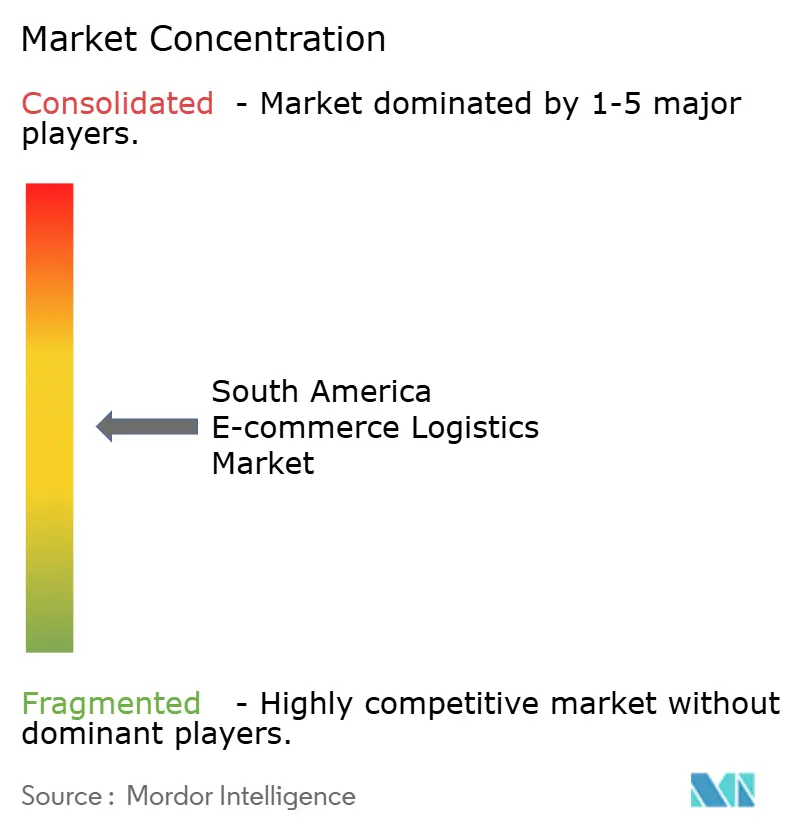
| Market Concentration | Medium |
Major Players *Disclaimer: Major Players sorted in no particular order Image © Mordor Intelligence. Reuse requires attribution under CC BY 4.0. | |
South America E-commerce Logistics Market Analysis by Mordor Intelligence
The South America E-commerce Logistics Market size is projected to expand from USD 4.95 billion in 2025 and USD 5.36 billion in 2026 to USD 8.32 billion by 2031, registering a CAGR of 9.18% between 2026 to 2031.
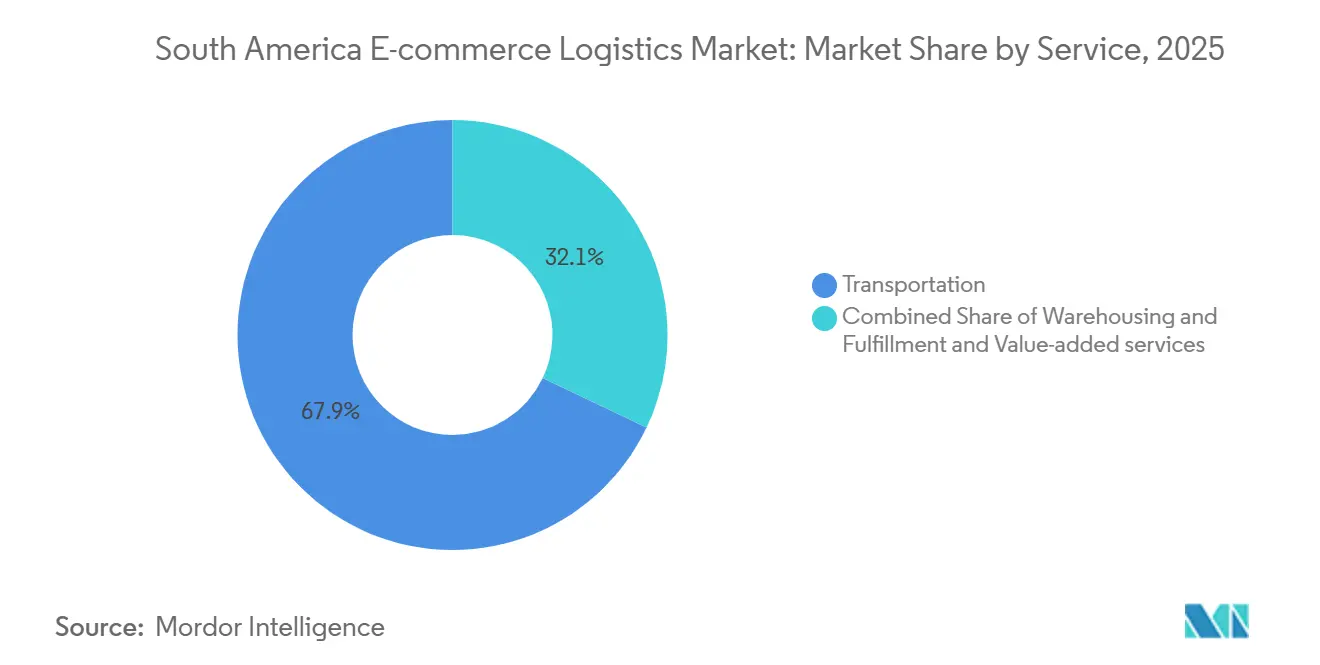
The structural shift away from store-based retail toward mobile checkout is compressing the time between purchase and dispatch, and the Pix instant-payment rail alone cleared 42% of Brazilian online orders in 2025, enabling same-day fulfillment economics unthinkable under two-day card settlement lags. Dark-store footprints now saturate Sao Paulo, Buenos Aires, and Santiago, which concentrate inventory within 15-minute courier radii and raise urban delivery density to levels that support profitable sub-hour service. Transportation still dominates value creation, holding a 67.92% share in 2025, yet value-added activities such as kitting and specialized packaging are expanding at a 12.46% CAGR as sellers outsource pre-shipment compliance to meet tougher marketplace standards[1]Mercado Libre, “Annual Report 2025,” MERCADOLIBRE.COM. Mega-marketplaces are deploying multibillion-dollar fulfillment capital and now internalize more than 90% of volumes, a scale moat that raises entry barriers for independent carriers. Intra-regional duty-free zones under Mercosur and the Pacific Alliance accelerate cross-border flows, but sub-par road links beyond coastal corridors still inflate inland transit costs by up to 30%.
Key Report Takeaways
- By service type, transportation commanded 67.92% of the South America e-commerce logistics market share in 2025. Value-added services are advancing at a 12.46% CAGR through 2031.
- By business model, the B2C segment held 75.85% of the South America e-commerce logistics market share in 2025. B2B is projected to expand at a 9.75% CAGR to 2031.
- By destination, domestic shipments accounted for an 82.24% share of the South America e-commerce logistics market size in 2025. International flows are growing at a 10.84% CAGR over 2026-2031.
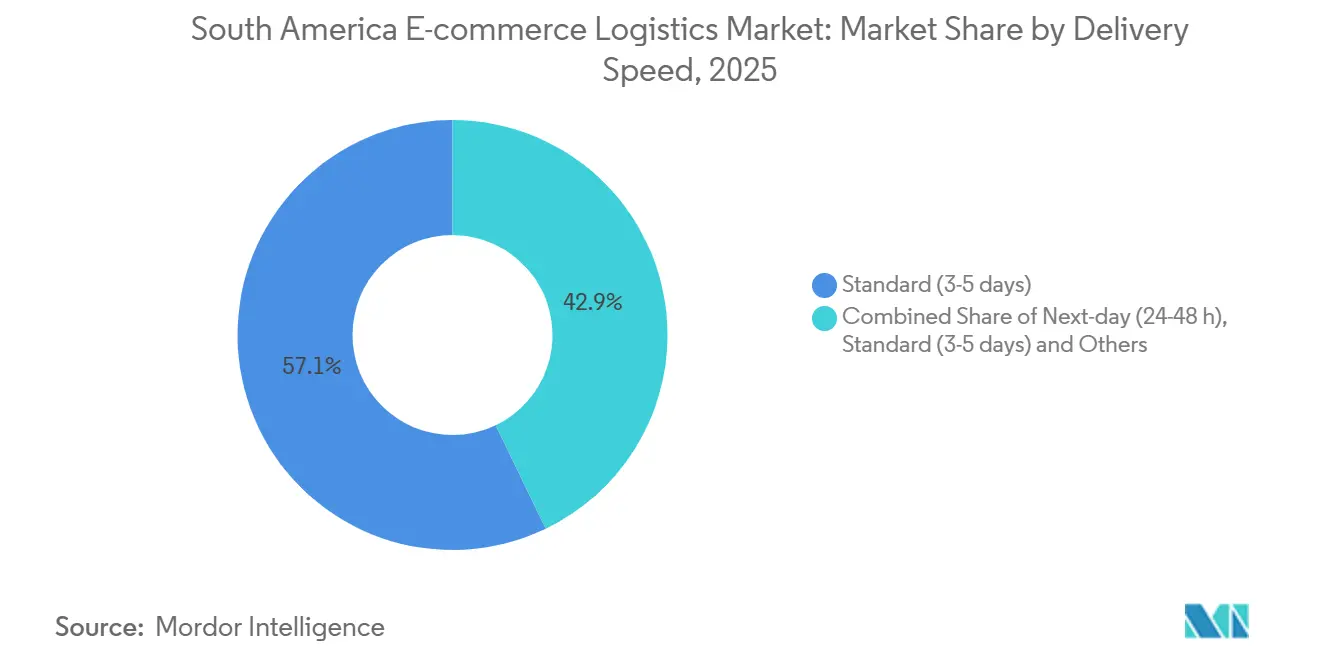
- By delivery speed, standard 3-5-day services led with 57.13% revenue share in 2025. Same-day delivery is the fastest tier, rising at an 11.35% CAGR through 2031.
- By product category, fashion and lifestyle captured 26.65% of volumes in 2025. Foods and beverages are the fastest risers, with a 10.31% CAGR to 2031.
- By geography, Brazil represented 45.28% of regional revenues in 2025. Peru posts the highest forecast growth at 12.09% CAGR.
Note: Market size and forecast figures in this report are generated using Mordor Intelligence’s proprietary estimation framework, updated with the latest available data and insights as of January 2026.
South America E-commerce Logistics Market Trends and Insights
Drivers Impact Analysis*
| Driver | (~) % Impact on CAGR Forecast | Geographic Relevance | Impact Timeline |
|---|---|---|---|
| Explosive B2C GMV Growth Post-COVID | +2.1% | Brazil, Argentina, Chile, Colombia | Medium term (2-4 years) |
| Mobile Internet & Pix-Style Instant Payments | +1.8% | Brazil core, spillover to Argentina & Uruguay | Short term (≤ 2 years) |
| Mega-Marketplace CAPEX in Fulfillment Networks | +1.5% | Brazil, Argentina, Chile | Medium term (2-4 years) |
| Public & PPP Transport-Corridor Upgrades | +0.9% | Brazil, Peru, Chile | Long term (≥ 4 years) |
| Dark-Store & Micro-Fulfillment Proliferation | +1.3% | Sao Paulo, Buenos Aires, Santiago, Bogota | Short term (≤ 2 years) |
| Duty-Free Intra-Regional Zones Accelerating X-Border | +1.0% | Mercosur bloc, Pacific Alliance | Medium term (2-4 years) |
| Source: Mordor Intelligence | |||
Explosive B2C GMV Growth Post-COVID
Brazil recorded USD 81.74 billion in e-commerce gross merchandise value during 2024, far surpassing any other South American market and sustaining double-digit expansion even after pandemic restrictions eased. Over 100 million regional consumers now transact online, yet penetration still trails North American benchmarks by 30-40 percentage points, which leaves ample runway for logistics throughput. Order volumes are rising faster than public postal capacity, prompting marketplaces to insource fulfillment and capture quality control. Mercado Libre routed 94% of its 2025 shipments through proprietary hubs, an approach that transformed delivery speed into a competitive moat rather than a cost center. Independent carriers face squeezed margins, while demand for outsourced labelling and kitting accelerates; sellers need professional preparation services to meet strict on-time metrics. The same momentum is visible in Argentina and Colombia, where digital buyer bases doubled between 2020 and 2025.
Mobile Internet & Pix-Style Instant Payments
Instant settlement eliminates the multi-day float that once delayed dispatch, enabling merchants to release parcels within hours and unlock the economics of same-day delivery. Average Pix fees of 0.33% compare favorably with 2.34% for cards, freeing working capital for warehouse automation. Argentina’s CVU and Chile’s Khipu are cloning the model, though adoption trails Brazil by roughly two years. Payments innovation now shapes network design: dark stores must sit within a 10-minute scooter radius of dense districts such as Vila Madalena, where courier productivity reaches 20 drops per hour. Rising urban rents raise fixed costs, but the density effect still lowers per-stop expense and improves service reliability.
Mega-Marketplace CAPEX in Fulfillment Networks
Mercado Libre spent USD 6.4 billion on Brazilian logistics in 2025, expanding from 10 to 21 distribution centers and deploying 308 satellite points to push inventory closer to demand. The firm now owns more floor space in Latin America than Amazon, a reversal of the 2020 landscape when third-party carriers dominated. Heavy capital outlays create a two-tier marketplace in which only the biggest players can self-fulfill at scale, while mid-tier operators depend on aggregators that charge double-digit commissions. Delivery performance follows suit. Mercado Libre achieved 71.8% next-day coverage in 2025, whereas sellers reliant on the postal service averaged five-day lead times.
Dark-Store & Micro-Fulfillment Proliferation
Rappi alone managed over 300 dark stores by late 2025, focusing on Sao Paulo, Buenos Aires, Santiago, and Bogotá, where order density justifies the USD 200,000-500,000 upfront investment per site[2]Rappi, “Investor Presentation 2025,” RAPPI.COM . Payback periods collapse to eighteen months once throughput exceeds fifteen orders per hour, shifting warehouse optimization away from cubic storage toward rapid pick paths. Mercado Libre introduced “Meli Places” micro-hubs in 50 Brazilian cities in 2025 to replicate the same-day service for electronics and apparel. Because the first entrant to saturate a neighborhood captures the majority of impulse purchases, dark-store rollouts display clear winner-take-all dynamics. Although same-day volume remains a minority of total parcels, its 11.35% growth rate suggests a continued pull toward hyper-local fulfillment, particularly for high-frequency baskets such as groceries and pharmacy items.
Restraints Impact Analysis*
| Restraint | (~) % Impact on CAGR Forecast | Geographic Relevance | Impact Timeline |
|---|---|---|---|
| Sub-Par Road & Multimodal Links Outside SE-Brazil | -1.2% | North/Northeast Brazil, inland Argentina, Paraguay | Long term (≥ 4 years) |
| High Last-Mile Cost & Customs Complexity | -0.9% | Cross-border lanes, suburban & rural zones | Medium term (2-4 years) |
| Cargo Theft & Security Risk | -0.7% | Sao Paulo-Rio corridor, Greater Buenos Aires | Short term (≤ 2 years) |
| Fragmented Carrier-API Standards Limiting Scaling | -0.5% | Region-wide SME segment | Medium term (2-4 years) |
| Source: Mordor Intelligence | |||
Sub-Par Road & Multimodal Links Outside SE-Brazil
Only 12.4% of Brazilian roads are paved, and rail moves only 15% of national cargo, compared with 40% in North America, forcing long-haul trucking over deteriorated highways and adding 20-30% to vehicle operating costs[3]World Bank, “Logistics Performance Index 2024,” WORLD BANK. Similar under-investment plagues inland Argentina, where rail share has fallen below 5% of freight. As a result, carriers cluster fulfillment assets near Santos, Paranagua, and Valparaiso ports to avoid unreliable hinterland lanes, a pattern that accelerates metro service but leaves rural customers facing week-long lead times. Public programs such as the PAC highway plan and IIRSA corridor upgrades exist, yet regional infrastructure spending averages only 2.2% of GDP, well below the 6.2% level the Inter-American Development Bank identifies as necessary to close the gap. Until execution improves, inland addressability will remain constrained.
High Last-Mile Cost & Customs Complexity
Last-mile expenditure accounts for 40-50% of total logistics costs in South America because stop density falls sharply beyond city cores, and traffic congestion increases courier hours. Suburban routes often deliver fewer than twelve parcels per run, tripling per-package costs relative to downtown drops. Cross-border flows compound the strain: clearance in Brazil averages five days against two in Chile, and inconsistent de minimis thresholds, USD 50 in Argentina versus USD 200 in Chile, force sellers to recalibrate declared values by destination. Documentation errors or missing sanitary certificates can still add several days in storage, undermining promised delivery windows. Carriers mitigate risk through bonded warehouses near borders, but the complexity deters smaller sellers and keeps international volumes at 17.76% of the South America e-commerce logistics market size in 2025
*Our forecasts treat driver/restraint impacts as directional, not additive. The impact forecasts reflect baseline growth, mix effects, and variable interactions.
Segment Analysis
By Service Type: Value-Added Growth Outpaces Transport Dominance
Transportation captured 67.92% of the South American e-commerce logistics market share in 2025 because road freight remains indispensable in a continent where rail infrastructure is sparse[4]Agência Nacional de Transportes Terrestres, “Modal Statistics 2024,” ANTT.GOV.BR. Yet the value-added tier is expanding at 12.46% CAGR as marketplaces enforce packaging, labelling, and kitting standards that individual merchants cannot meet in-house. Sellers increasingly purchase turnkey preparation modules co-located at mega-marketplace distribution centers, which trims hand-off time and enhances on-time delivery performance.
Warehousing and fulfillment footprints are also scaling; Mercado Libre doubled the number of Brazilian distribution centers in 2025, bringing the total to 71.8% of parcels within a 48-hour window. Third-party 3PLs mirror the move by opening satellite hubs in Guarulhos and Itagui that specialize in cosmetics or small electronics. Although rail and air remain niche, the selective adoption of cold-chain and pharmaceutical airfreight is rising. Overall, value-added services will continue to gain penetration as unboxing experience and compliance emerge as key conversion levers.


By Business Model: B2B Platforms Narrow the Gap
B2C accounted for 75.85% of 2025 revenues thanks to 100 million regional digital buyers and frictionless mobile checkout. However, B2B is growing at a 9.75% CAGR, nearly catching up to consumer growth, as procurement portals digitize SME ordering cycles and enable consolidated pallet shipments that cut per-kilogram costs by up to 50%. The South American e-commerce logistics market for B2B transactions is projected to exceed USD 2 billion by 2031, reflecting adoption across office supplies, maintenance parts, and foodservice inputs.
C2C remains a small slice, though rising return-center infrastructure is boosting buyer confidence. The logistical difference is stark: C2C parcels experience return rates below 10%, yet require reverse flows that many individual sellers cannot manage. Marketplaces now aggregate returns at city depots and charge unit fees, a model that could elevate C2C participation but also adds complexity that only larger platforms can absorb.
By Destination: Cross-Border Momentum Builds Despite Friction
Domestic shipping accounted for 82.24% of the 2025 South America e-commerce logistics market share, chiefly because same-day and next-day delivery rely on dense urban networks that end at national borders. Nevertheless, international flows are rising at a 10.84% CAGR on the back of duty-free agreements that remove tariffs on over 90% of intra-bloc trade. Chile and Peru exploit swift customs processes, sometimes forty-eight hours door-to-door, to import Asian electronics, while Brazilian sellers export fashion into Argentina through bonded hubs in Cordoba.
Customs heterogeneity and diverging VAT regimes still hinder seamless scaling. Sellers often split orders to stay under low de minimis limits, adding handling overhead. Innovation is underway: Correios and Cainiao opened a bonded warehouse at Viracopos airport in 2025, cutting Chinese parcel clearance from seven to three days. As more airports replicate the model, the share of international traffic should continue to rise.
By Delivery Speed: Same-Day Economics Reach Inflection
Standard 3-5-day services led with 57.13% revenue share in 2025 as postal networks blanket the widest postcode range. Yet same-day is accelerating at 11.35% CAGR thanks to dark stores that position inventory within scooter distance of buyers in Sao Paulo, Buenos Aires, and Santiago. Pix eliminated settlement delays, allowing merchants to ship within 2 hours of checkout, removing the working-capital hurdle that once limited express investment.
Next-day remains the backbone for marketplaces; Mercado Libre’s proprietary fleet hit 71.8% success on that promise in 2025. Longer than five-day tiers persist in Amazonia and Patagonia, where stop density is too thin for frequent trunkline departures. Over the forecast horizon, sub-day delivery will likely reach a double-digit share in coastal megacities, while standard windows will remain dominant elsewhere, reinforcing the dual-speed landscape of the South American e-commerce logistics market.
By Product Category: Cold-Chain Gaps Check Food Momentum
Fashion and lifestyle led volumes at 26.65% in 2025 because high unit values absorb last-mile surcharges and return rates, while size and weight stay low. Foods and beverages post the fastest 10.31% CAGR, but only 15-20% of perishables travel under temperature control, limiting penetration outside first-tier metros. Quick-commerce firms are adding refrigerated micro-fulfillment pods, yet the rollout remains concentrated in Sao Paulo, Rio, and Buenos Aires.
Consumer electronics and appliances rely heavily on cross-Pacific airfreight lanes inaugurated in 2025 that reduced Guangzhou-to-Sao Paulo transit from 25 to 12 days. Furniture lags due to two-person delivery costs and scarce urban staging space. Overall diversification of product mix will depend on how quickly cold and bulk logistics mature beyond coastal capitals.
Geography Analysis
Brazil generated 45.28% of 2025 regional revenue, underpinned by the USD 6.4 billion Mercado Libre fulfillment program, which expanded local distribution centers from ten to twenty-one and pushed 94% of parcels through Mercado Libre's owned assets. Pix processed 42% of Brazilian online transactions in the same year, slashing the purchase-to-dispatch cycle to hours and cementing the country as the engine of the South America e-commerce logistics market. Yet service inequality persists: while Sao Paulo and Rio enjoy one-day delivery from multiple carriers, North and Northeast regions face week-long lead times due to limited paved roads and sparse multimodal links.
Peru is set for the fastest 12.09% CAGR through 2031, spurred by Pacific Alliance tariff relief and ongoing upgrades to the Interoceanic Highway that will cut Lima-Sao Paulo trips from twelve to eight days by 2027. Chile continues to punch above its population weight, with over 70% of roads paved and one- to two-day customs cycles that make Santiago an efficient entry hub for Asian imports. Argentina’s logistics still struggle with USD 12 billion deferred highway maintenance, though new cross-docks in Cordoba promise to slice domestic transit by half once operational in 2026.
Colombia benefits from PPP upgrades on the Bogota-Buenaventura artery, trimming port-to-capital travel time to 12 hours and boosting Pacific Alliance intra-trade volumes. Paraguay, Uruguay, Bolivia, and Ecuador together represent a single-digit share but are growing steadily as marketplaces expand seller programs into secondary cities. Infrastructure asymmetry remains the defining theme, with service levels highest where paved highways intersect major airports and lowest in inland states reliant on unsealed roads.
Competitive Landscape
The top five operators held a combined majority share in 2025, signalling moderate concentration and leaving meaningful whitespace for specialists. Mercado Libre set the bar by channeling 94% of its parcels through a proprietary network, raising peer pressure on DHL, FedEx, and UPS, which concentrate on high-value cross-border lanes where international certifications command price premiums. Domestic pure-plays such as Loggi, Jadlog, and Andreani compete on urban density and flexible courier fleets; Loggi’s 18 sorting centers already reach 3,600 Brazilian municipalities at sub-two-day intervals.
Aggregators like Melhor Envio and Kangu sit as middleware, integrating disparate carrier APIs and serving over 70,000 SMEs, although their 8-12% take rates compress seller margins. Technology differentiation is emerging in routing software and predictive capacity tools; carriers deploying AI-driven allocation report 15% lower per-stop costs, yet fragmented API standards hinder widespread adoption.
White-space niches include consolidated reverse logistics for fashion returns and refrigerated last-mile vans for perishable expansion. Autonomous sidewalk robots and drone pilots are under regulatory review in São Paulo and Santiago, but commercialization is likely to come after 2028. Competitive heat is highest within metropolitan rings, where same-day capacity overlaps, and lowest in rural hinterlands that few carriers cover, keeping the South American e-commerce logistics market in a state of dual-speed competition.
South America E-commerce Logistics Industry Leaders
Mercado Libre
Correios
DHL eCommerce Solutions
FedEx
Loggi
- *Disclaimer: Major Players sorted in no particular order

Recent Industry Developments
- January 2026: Mercado Libre opened five cross-dock facilities in Argentina, cutting Buenos Aires-to-Cordoba transit from four days to two. The USD 180 million outlay raises national proprietary coverage to 95%.
- December 2025: DHL Supply Chain inaugurated a 50,000 m² automated hub in Sao Paulo’s Guarulhos district, deploying 120 autonomous mobile robots that lift pick throughput by 40%.
- November 2025: Loggi secured USD 200 million in Series E funding led by SoftBank to expand same-day networks into Curitiba, Porto Alegre, and Recife, targeting twenty-five sorting centers by late 2026.
- October 2025: Rappi acquired Mensajeros Urbanos for USD 85 million, adding 2,500 couriers and twelve micro-hubs across Colombia to accelerate B2B deliveries.


South America E-commerce Logistics Market Report Scope
| Transportation | Road |
| Rail | |
| Sea | |
| Air | |
| Warehousing and Fulfilment | |
| Value-Added Services (Labelling, Packaging, Kitting) |
| B2C |
| B2B |
| C2C |
| Domestic |
| International |
| Same-day (less than 24 h) |
| Next-day (24-48 h) |
| Standard (3-5 days) |
| Others (more than 5 days) |
| Foods and Beverages |
| Personal and Household Care |
| Fashion and Lifestyle (accessories, apparel, footwear) |
| Furniture |
| Consumer Electronics and Household Appliances |
| Other Products |
| Argentina |
| Brazil |
| Chile |
| Colombia |
| Peru |
| Rest of South America |
| By Service Type | Transportation | Road |
| Rail | ||
| Sea | ||
| Air | ||
| Warehousing and Fulfilment | ||
| Value-Added Services (Labelling, Packaging, Kitting) | ||
| By Business Model | B2C | |
| B2B | ||
| C2C | ||
| By Destination | Domestic | |
| International | ||
| By Delivery Speed | Same-day (less than 24 h) | |
| Next-day (24-48 h) | ||
| Standard (3-5 days) | ||
| Others (more than 5 days) | ||
| By Product Category | Foods and Beverages | |
| Personal and Household Care | ||
| Fashion and Lifestyle (accessories, apparel, footwear) | ||
| Furniture | ||
| Consumer Electronics and Household Appliances | ||
| Other Products | ||
| By Country | Argentina | |
| Brazil | ||
| Chile | ||
| Colombia | ||
| Peru | ||
| Rest of South America |


Key Questions Answered in the Report
How large is the South America e-commerce logistics market in 2026?
It is estimated at USD 5.36 billion and is on track to grow to USD 8.32 billion by 2031.
Which country contributes the most revenue?
Brazil contributed 45.28% of regional revenue in 2025, driven by Pix adoption and heavy investment in the marketplace.
What segment expands fastest by service type?
Value-added services such as labelling and kitting are growing at a 12.46% CAGR through 2031.
How quickly are cross-border shipments expanding?
International volumes are forecast to rise at a 10.84% CAGR on the back of Mercosur and Pacific Alliance tariff relief.
Why is same-day delivery gaining traction?
Instant-payment rails and dense urban dark stores let merchants release parcels within hours, supporting an 11.35% CAGR for same-day services.
What limits food-and-beverage logistics growth?
Only 15-20% of perishables travel in temperature-controlled networks, so cold-chain gaps outside major metros constrain expansion.
Page last updated on:


