South America Data Center Water Consumption Market Size and Share
Market Overview
| Study Period | 2019 - 2030 |
|---|---|
| Forecast Data Period | 2025 - 2030 |
| Historical Data Period | 2019 - 2023 |
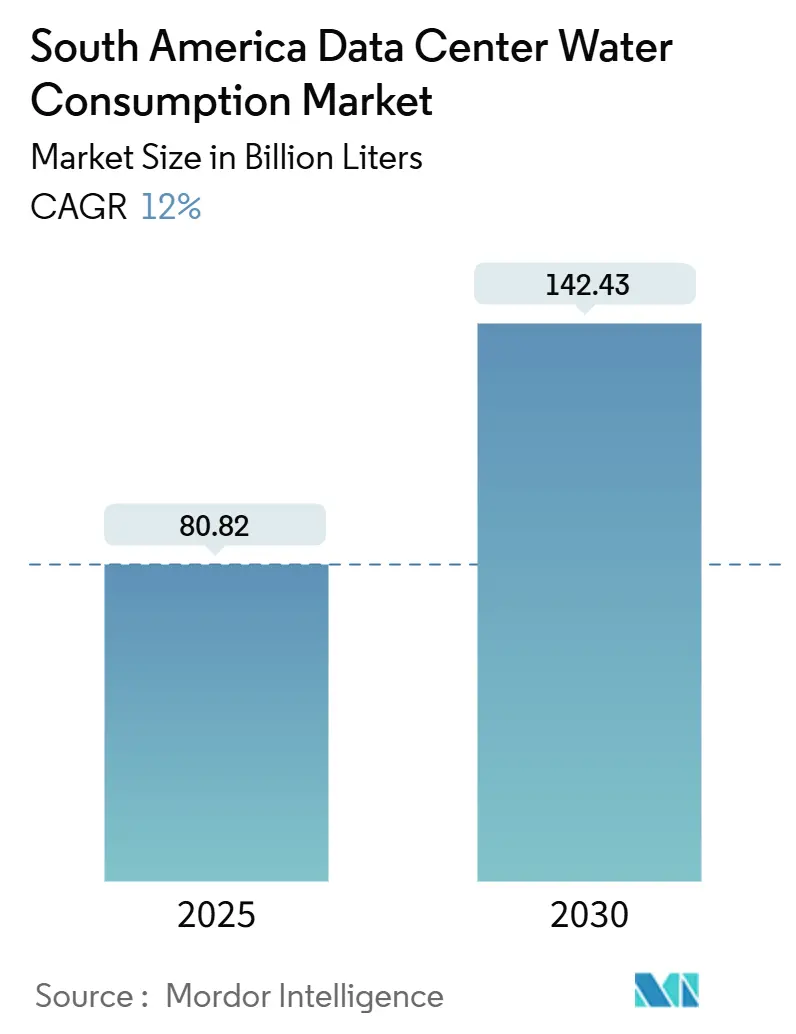
| Market Volume (2025) | 80.82 Billion liters |
| Market Volume (2030) | 142.43 Billion liters |
| Growth Rate (2025 - 2030) | 12.00% CAGR |
| Market Concentration | Medium |
Major Players *Disclaimer: Major Players sorted in no particular order Image © Mordor Intelligence. Reuse requires attribution under CC BY 4.0. | |
South America Data Center Water Consumption Market Analysis by Mordor Intelligence
The South America data center water consumption market stood at 80.82 billion liters in 2025 and is projected to reach 142.43 billion liters by 2030, reflecting a 12% CAGR over the forecast window. Rapid scale-up of AI-ready infrastructure, wider use of liquid-cooled racks, and municipal reclaimed-water build-outs are catalyzing this growth trajectory. Hyperscalers are co-investing in utility upgrades to derisk long-term water access, while regional specialists compete through zero-water-use-effectiveness (WUE) architectures. Mega campuses above 50 MW are consolidating workloads, compressing siting options yet enabling economies of scale in water treatment. Drought-induced permitting friction in Chile and Uruguay, alongside rising community activism, injects execution risk that may steer new capacity toward Brazil and Colombia.
Key Report Takeaways
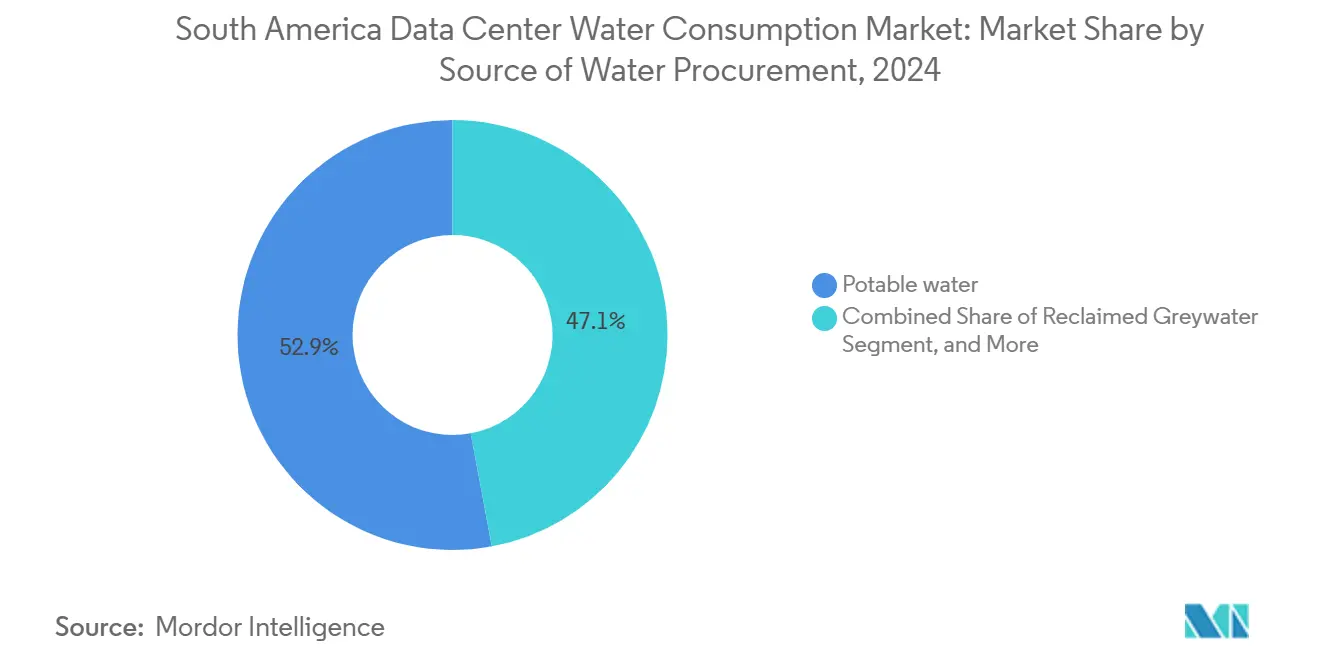
- By source of water procurement, potable municipal supplies retained 52.93% of the South America data center water consumption market share in 2024, whereas reclaimed greywater is advancing at 13.22% CAGR through 2030, the fastest rate among all sources.
- By data center type, colocation operators led with 46.84% of the South America data center water consumption market share in 2024, while cloud providers are expanding at 12.87% CAGR through 2030 as AI clusters intensify rack-level water demand.
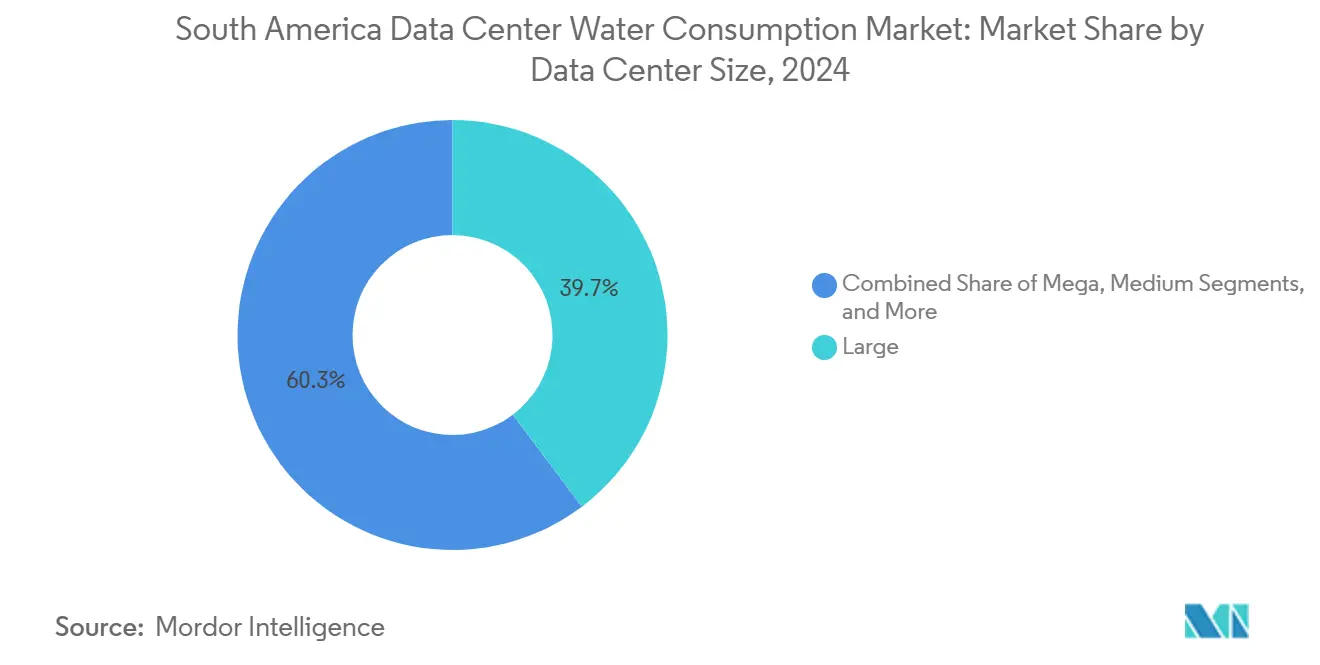
- By facility size, large facilities retained 39.72% of the South America data center water consumption market share in 2024, and mega sites exceeding 50 MW are projected to grow at a 12.56% CAGR through 2030.
- By country, Brazil captured 58% of regional consumption in 2024; Chile recorded the highest regulatory headwinds and tempering its forecast CAGR to 10.2% through 2030.
Understanding the full system requires moving beyond South america boundaries into a wider international view. Mordor Intelligence captures the global data center water consumption market scope in its worldwide coverage.
South America Data Center Water Consumption Market Trends and Insights
Drivers Impact Analysis*
| Driver | (~) % Impact on CAGR Forecast | Geographic Relevance | Impact Timeline |
|---|---|---|---|
| AI, 5G and cloud-led hyperscale expansion | +3.8% | Brazil, Chile, Colombia; spillover to Argentina | Medium term (2-4 years) |
| Liquid-cooled AI racks boosting water treatment demand | +2.9% | Brazil (São Paulo, Rio), Chile (Santiago, Antofagasta) | Short term (≤ 2 years) |
| Growth of colocation campuses in Brazil and Chile | +2.4% | Brazil (São Paulo, Rio), Chile (Santiago, Valparaíso) | Medium term (2-4 years) |
| Energy-efficiency regulations favouring evaporative cooling | +1.8% | Brazil (ANATEL jurisdiction), Chile (SEA oversight) | Long term (≥ 4 years) |
| Municipal reclaimed-water build-outs in São Paulo and Rio | +1.7% | Brazil (São Paulo metropolitan, Rio de Janeiro) | Long term (≥ 4 years) |
| Emergence of seawater/SWAC coastal campuses | +1.4% | Chile (Antofagasta, Valparaíso), Brazil (northeastern coast) | Long term (≥ 4 years) |
| Source: Mordor Intelligence | |||
AI, 5G and Cloud-Led Hyperscale Expansion
Hyperscale cloud providers are rolling out AI training clusters that use three to five times more cooling water per rack than legacy compute, reshaping procurement contracts across the South America data center water consumption market. AWS has earmarked BRL10 billion for Brazilian regions and Microsoft has committed BRL 14.7 billion for GPU-dense zones in São Paulo. Google’s USD 850 million Uruguay campus, slated for completion by 2030, set a regional precedent when community objections forced a pledge for net-positive water impact. Chile’s pipeline of over 500 MW by 2030 is hampered by permit delays linked to freshwater disputes. A less obvious trend is the privatization of water infrastructure: Equinix’s USD 12 million share of Rio’s reclaimed-water upgrade exemplifies how operators internalize public-utility roles, potentially widening barriers for smaller entrants.
Liquid-Cooled AI Racks Boosting Water Treatment Demand
Direct-to-chip liquid cooling now captures up to 95% of processor heat, cutting evaporative losses by 90% relative to legacy chillers, and is becoming the default for racks above 50 kW. Elea Digital’s Vertiv partnership in Argentina applies immersion technology in closed loops, while Scala’s R$6.2 billion AI City in Tamboré targets zero WUE by eliminating cooling towers. TECfusions’ 100 MW Chilean campus pairs liquid cooling with on-site desalination to achieve WUE below 0.2 l/kWh. These systems require feedwater purity of less than 1 µS/cm, adding USD 2 million to USD 4 million in upfront capital for a 20 MW build, yet they confer a permitting advantage in drought-prone locales. ISO 14046 water-footprint assessments have become standard in hyperscale RFPs, pushing smaller colocation providers to retrofit or risk client attrition.
Growth of Colocation Campuses in Brazil and Chile
Brazil’s colocation segment is expanding at 14% annually as enterprises migrate workloads from on-premise halls to shared campuses with superior water efficiency. Scala’s Tamboré complex will deliver 158 MW by 2025 and harness advanced chillers that lower consumption by 30%. Equinix completed its USD 94 million RJ3 site in December 2024 with Mecalor systems that boost water savings by another 30%. ODATA is scaling modular halls in Santiago and Valparaíso to align capacity increments with phased water upgrades. Brazil’s regulator ANATEL now awards certification bonus points for facilities sourcing at least 20% of cooling water from reclaimed supplies, effectively embedding diversification into corporate site-selection playbooks. In Chile, stricter EIAs require granular water-balance modeling and extended community consultation periods, elongating construction timelines by up to 18 months.
Municipal Reclaimed-Water Build-Outs in São Paulo and Rio
São Paulo’s Aquapolo plant delivers 1,000 l/s of reclaimed industrial water, shaving regional potable demand by 30% and serving petrochemical and data center clients alike. Rio’s Alegria facility is undergoing a USD 180 million upgrade to add UV disinfection for direct data-center supply by 2026. Long-term offtake contracts priced 40-50% below potable tariffs lock in cost certainty and ESG compliance. The São Paulo metro alone accounts for 78% of Brazil’s industrial reuse capacity, leaving secondary cities vulnerable to water shortages during dry seasons. ANA’s draft Resolução 121/2024 defines national reuse standards but caps penalties at BRL 50,000, limiting deterrence for non-compliance among large operators.
Restraints Impact Analysis*
| Restraint | (~) % Impact on CAGR Forecast | Geographic Relevance | Impact Timeline |
|---|---|---|---|
| Severe droughts and tighter water-withdrawal permits | -2.1% | Chile, Uruguay, northeastern Brazil | Short term (≤ 2 years) |
| Community activism delaying hyperscale builds | -1.4% | Chile (Santiago), Uruguay (Canelones), Brazil (São Paulo) | Medium term (2-4 years) |
| Low transparency / absent mandatory WUE disclosure | -0.9% | Global, with acute gaps in Argentina, Peru, Colombia | Long term (≥ 4 years) |
| Scrutiny of indirect reservoir-evaporation footprint | -0.6% | Brazil (hydropower-dependent regions), Uruguay | Medium term (2-4 years) |
| Source: Mordor Intelligence | |||
Severe Droughts and Tighter Water-Withdrawal Permits
Chile is in its fifteenth year of below-average rainfall, with Santiago reservoirs at 42% of historical norms. The DGA’s emergency rule freezes new non-residential allocations at 10% of 2019 baselines, stalling hyperscale permits until 2027. Google scrapped its 7 billion-liter Cerrillos request in late 2024 after local groups invoked the Escazú Agreement for full disclosure. Uruguay forced Google’s Canelones project to fund aquifer recharge volumes 120% above withdrawals, expanding lead times and capex. Northeastern Brazil’s semi-arid corridor prioritizes agriculture over industry as reservoirs hit 30-year lows. Equinix has begun pre-purchasing water rights from agricultural cooperatives, a practice that may heighten food-versus-data tensions. ANA’s Bolsa de Água pilot could formalize trading but faces state-level legal fragmentation.
Community Activism Delaying Hyperscale Builds
A November 2025 Guardian investigation found coordinated campaigns across Chile, Brazil, and Uruguay demanding transparency on data-center water use.[1]The Guardian, “Community Activism Challenges Data Center Water Use in South America,” theguardian.com Santiago’s “No Más Data Centers” coalition leveraged the Escazú Agreement to delay three hyperscale projects. Uruguay’s protesters compelled Google to downsize withdrawals by 35% and add rainwater harvesting systems. São Paulo residents filed suit against Scala’s Tamboré campus, alleging strain during summer peaks. Operators now embed benefit clauses such as Equinix’s pledge to retrofit 5,000 low-income homes with water-efficient fixtures, adding 8-12 months to schedules and raising capex by 3-5%. The absence of mandatory WUE disclosure fuels mistrust and litigation, amplifying non-technical risk across the South America data center water consumption market.
*Our forecasts treat driver/restraint impacts as directional, not additive. The impact forecasts reflect baseline growth, mix effects, and variable interactions.
Segment Analysis
By Source of Water Procurement: Reclaimed Greywater Gains Momentum Despite Potable Dominance
Potable municipal supplies accounted for 52.93% of the South America data center water consumption market in 2024, reflecting a legacy dependence on city grids and the convenience of urban buildouts. The segment grew at 8.2% CAGR between 2019 and 2024 but faces softening momentum as allocation caps tighten in drought-affected regions. Reclaimed greywater is racing ahead at 13.22% CAGR to 2030, supported by São Paulo’s Aquapolo and Rio’s Alegria upgrades that underwrite multisite contracts priced well below potable equivalents. The South America data center water consumption market size for reclaimed sources is thus set to double by 2030, narrowing the gap with potable supplies while advancing ESG credentials. Alternative sources, including groundwater, surface water, seawater, and rainwater, are growing at a 11.8% CAGR, buoyed by coastal pilots in Chile’s Antofagasta and mandatory rainwater harvesting rules in São Paulo.
The non-obvious nuance is spatial concentration: more than 62% of Brazil’s reclaimed offtake is clustered in the ABC Paulista corridor, while secondary cities lag due to limited treatment capacity. Chile’s seawater-intake modules could add 15 million liters daily by 2028, offering a template for Brazil’s northeast if solar-plus-storage costs fall. Rainwater reclamation at Equinix’s SP5 campus captures 2.3 million liters annually, trimming cooling-tower makeup water and illustrating how even micro-sources contribute to cumulative reductions. Collectively, diversified sourcing enhances resilience and underpins the South America data center water consumption market's long-term sustainability.


By Data Center Type: Cloud Providers Accelerate While Colocation Holds Scale
Colocation operators held 46.84% share in 2024 as enterprises favored shared halls that offer WUE improvements over legacy on-prem facilities. Yet cloud providers are scaling faster at a 12.87% CAGR through 2030, propelled by GPU-dense AI clusters. The South America data center water consumption market size linked to cloud builds is therefore set to outstrip enterprise hall demand by the decade’s end. Enterprise sites are consolidating: Brazil’s banks collapsed 47 centers into 12 colocation leases between 2022 and 2024, slicing aggregate water draws by 38%.
Hyperscalers are vertically integrating water supply chains, co-funding municipal upgrades for priority rights, AWS injected USD 18 million into São Paulo’s Guarapiranga treatment plant. Colocation firms struggle to match such capex but counter through rapid retrofits and ISO 50001 certifications that resonate with enterprise buyers. ISO frameworks increasingly stipulate WUE thresholds, meaning providers on both sides must demonstrate concrete reductions or risk RFP exclusion. Hence, competitive tension remains fluid, yet both archetypes collectively reinforce growth of the broader South America data center water consumption market.
By Data Center Size: Mega Facilities Drive Efficiency and Controversy
Large facilities (10-50 MW) accounted for 39.72% of 2024 consumption, striking a balance between economies of scale and siting flexibility. Mega facilities above 50 MW are expanding at a 12.56% CAGR, thanks to hyperscaler consolidation strategies, and their South America data center water consumption market size contribution will surpass that of large sites by 2030. Medium and massive facilities are growing more modestly, while small edge nodes are declining as operators pivot to air-cooled micro-data centers. Mega campuses like Scala’s 158 MW Tamboré project will use 4.2 billion liters annually by 2027, equivalent to the needs of 85,000 residents, spotlighting governance issues during droughts.[2]The Guardian, “Community Activism Challenges Data Center Water Use in South America,” theguardian.com
Yet mega builds often integrate advanced reuse and closed-loop systems that achieve WUE below 1 l/kWh, mitigating headline risk. Large facilities remain geographically dispersed, often utilizing existing industrial parks and incorporating reclaimed-water pipelines. Medium tiers adopt containerized cooling units to expand incrementally without proportional water escalation, exemplified by ODATA’s Santiago deployment. Small nodes, in contrast, are shifting toward indirect evaporative or fully air-cooled designs, effectively removing them from the South America data center water consumption market’s ledger. Regulatory carrots such as ANATEL’s Tier IV bonus points for sub-1.0 l/kWh WUE are steering all size classes toward liquid or hybrid cooling retrofits.
Geography Analysis
Brazil captured 58% of regional water use in 2024 on the back of 740 MW installed in São Paulo and over 120 MW in Rio de Janeiro. Investment pledges totaling BRL24.7 billion from AWS and Microsoft will elevate the nation’s South America data center water consumption market size at a 12.3% CAGR to 2030. Aquapolo’s scale allows São Paulo to grow without matching potable increases, yet Rio’s dependence on the Guandu reservoir, which dips to 68% capacity during dry spells, threatens expansion plans. Resolução 121/2024 will mandate WUE reporting for sites above 10 MW, but penalties remain low, limiting behavioral change. Community litigation in Tamboré and reservoir evaporation scrutiny signal social-license risks that could temper large-scale additions.
Chile held 18% of 2024 consumption but endures severe drought. The Dirección General de Aguas remains cautious, capping new non-residential allocations and moderating growth to a 10.2% CAGR through 2030. Google’s exit from the Cerrillos plan illustrates the chilling effect of contested water permits. Nevertheless, AWS and TECfusions are pursuing coastal strategies that draw Pacific seawater or leverage onsite desalination, potentially decoupling fresh-water risk from capacity additions. Historical growth of 13.5% between 2019 and 2024 revealed early-mover advantage; future expansion hinges on technology swaps and community negotiations under the Escazú framework.
The rest of South America, Colombia, Argentina, Peru, Uruguay, and smaller markets, combined for 24% of 2024 consumption. Colombia shines with a 13.8% forecast CAGR driven by EdgeConneX and Scala builds tapping abundant hydropower. Argentina touts immersion-cooled innovation but grapples with macroeconomic headwinds that deter foreign capital. Peru’s fragmented water governance complicates multi-site strategies despite GTD’s new 20 MW node. Uruguay drew headlines when protests forced Google to guarantee net-positive water impact, an emerging benchmark for hyperscale entrants. Across these nations, uneven disclosure standards and patchwork regulation inject additional complexity into regional deployment roadmaps.
Mordor Intelligence examines the data center water consumption market across diverse other regional markets as well, including Europe, Asia, and North America, while also offering granular country-level perspectives for Chile, Brazil, United States, Canada, United Kingdom, and Germany and more.
Competitive Landscape
South America data center water consumption market features a moderately concentrated environment where the top five operators hold 52% share, but none exceeds 15%. Hyperscale cloud providers, notably AWS, Microsoft, and Google, are consolidating AI workloads into mega facilities, leveraging balance-sheet heft to pre-purchase reclaimed-water rights and finance utility upgrades. Colocation specialists such as Scala, ODATA, and Ascenty respond with zero-WUE designs employing closed-loop liquid cooling, narrowing the efficiency gap with hyperscalers.
Strategic differentiation centers on water stewardship. Equinix injected USD 12 million into Rio’s reclaimed network, while AWS funded USD 18 million of São Paulo’s Guarapiranga upgrade, effectively securing preferred allocations that raise barriers for late entrants.[3]Wall Street Journal, “AWS and Microsoft Commit Billions to Brazilian Cloud Infrastructure,” wsj.com Regional players innovate through technical breakthroughs: Scala’s November 2025 patent filing for a modular greywater recycling system targets 95% recirculation rates, and Elea Digital’s immersion approach cuts evaporative loss by 90%. White-space opportunities remain along Chile’s and Brazil’s coasts, where seawater intake or desalination could unlock fresh capacity, but high capital costs limit participation to well-capitalized firms.
Technology adoption serves as a sorting mechanism. ISO 14046 and WUE below 1 l/kWh increasingly appear in enterprise RFPs, rewarding operators with advanced liquid-cooling or hybrid systems. EdgeUno pursues water-free micro-data centers targeting sub-20 ms latency applications, sidestepping water-rights hurdles entirely. Overall, the South America data center water consumption market continues to bifurcate into capital-intensive hyperscale builders and nimble edge innovators.
South America Data Center Water Consumption Industry Leaders
Microsoft Corporation
Google LLC
Equinix Inc.
Digital Realty Trust Inc.
Amazon Web Services Inc.
- *Disclaimer: Major Players sorted in no particular order

Recent Industry Developments
- November 2025: The Guardian published an investigation exposing coordinated community campaigns across Chile, Brazil, and Uruguay that leveraged the Escazú Agreement to demand full disclosure of data-center water use, forcing operators to embed community-benefit clauses in new projects
- November 2025: Scala Data Centers filed a patent application with Brazil’s INPI for a modular greywater recycling system designed to achieve 95% recirculation in AI racks, signaling the next competitive frontier in water-efficiency technology
- September 2025: Brazil’s National Water Agency (ANA) began field testing mandatory water-use-effectiveness (WUE) reporting for facilities above 10 MW under Resolução 121/2024, marking the country’s first step toward standardized disclosure
- June 2025: Brazil’s telecom regulator ANATEL released draft Tier IV certification criteria awarding bonus points to data centers that demonstrate WUE below 1 liter per kilowatt-hour, effectively tying top-tier ratings to advanced liquid-cooling adoption


South America Data Center Water Consumption Market Report Scope
The South America data center water consumption market report is segmented by Source of Water Procurement (Potable Water, Reclaimed Greywater, Alternative Sources), Data Center Type (Enterprise, Colocation, Cloud Service Providers), Data Center Size (Mega, Massive, Large, Medium, Small), and Country (Brazil, Chile, Colombia, Argentina, Peru, Uruguay, Rest of South America). Market Forecasts are Provided in Terms of Volume (Liters).
| Potable Water |
| Reclaimed Greywater |
| Alternative Sources (Ground-/Surface-/Sea-/Rain-water) |
| Enterprise |
| Colocation |
| Cloud Service Providers |
| Mega |
| Massive |
| Large |
| Medium |
| Small |
| Brazil |
| Chile |
| Colombia |
| Argentina |
| Peru |
| Uruguay |
| Rest of South America |
| By Source of Water Procurement | Potable Water |
| Reclaimed Greywater | |
| Alternative Sources (Ground-/Surface-/Sea-/Rain-water) | |
| By Data Center Type | Enterprise |
| Colocation | |
| Cloud Service Providers | |
| By Data Center Size | Mega |
| Massive | |
| Large | |
| Medium | |
| Small | |
| By Country | Brazil |
| Chile | |
| Colombia | |
| Argentina | |
| Peru | |
| Uruguay | |
| Rest of South America |


Key Questions Answered in the Report
What is the projected size of South America’s data center water consumption market by 2030?
The market is forecast to reach 142.43 billion liters by 2030, growing at a 12% CAGR.
Which water source segment is expanding fastest?
Reclaimed greywater is growing at 13.22% CAGR, the highest among procurement sources.
How are mega data centers affecting regional water demand?
Facilities above 50 MW are set to grow at 12.56% CAGR, concentrating demand but also adopting advanced reuse technologies that lower WUE.
Which country leads regional water consumption?
Brazil held 58% of regional consumption in 2024, supported by large-scale reclaimed-water infrastructure.
What role does liquid cooling play in water efficiency?
Direct-to-chip and immersion cooling capture up to 95% of heat at the processor, cutting evaporative water loss by up to 90%.
Page last updated on:


