South America Construction Market Size and Share
Market Overview
| Study Period | 2020 - 2031 |
|---|---|
| Forecast Data Period | 2026 - 2031 |
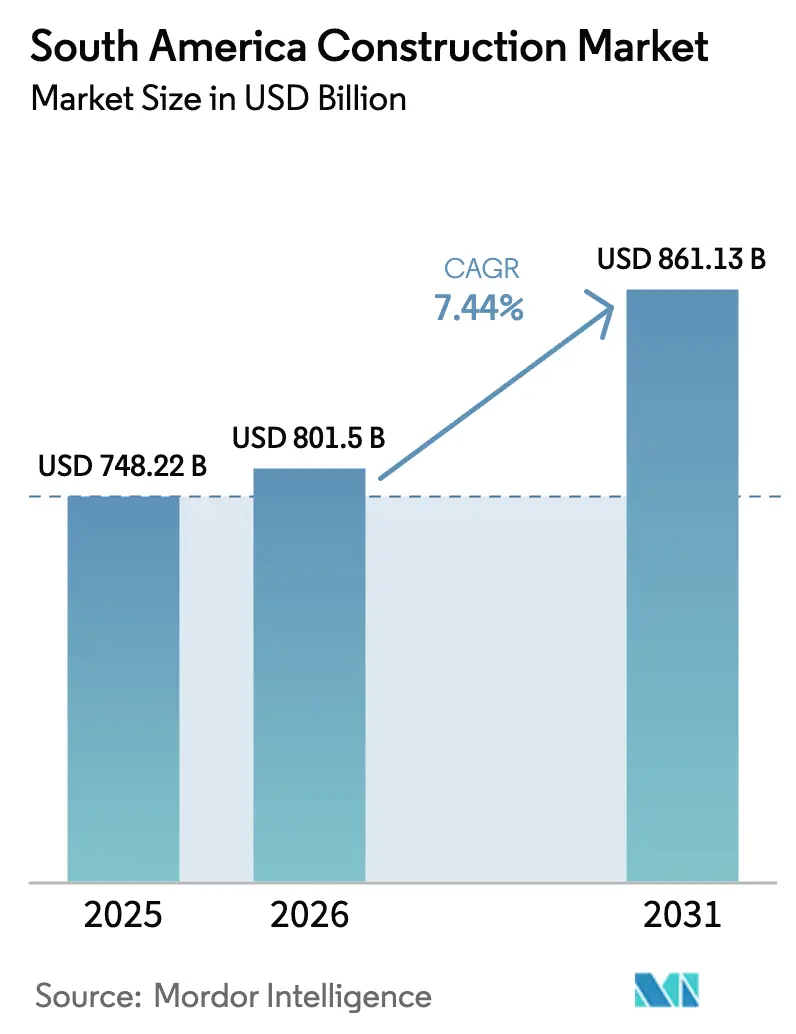
| Base Year Market Size (2025) | USD 748.22 Billion |
| Market Size (2026) | USD 801.5 Billion |
| Market Size (2031) | USD 861.13 Billion |
| Growth Rate (2026 - 2031) | 7.44% CAGR |
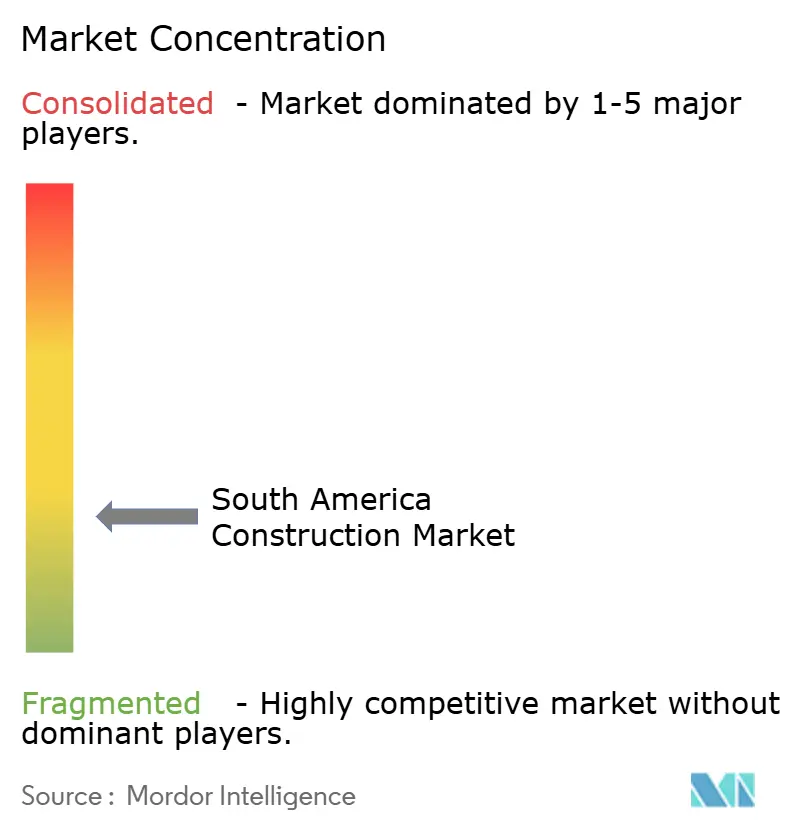
| Market Concentration | Low |
Major Players *Disclaimer: Major Players sorted in no particular order Image © Mordor Intelligence. Reuse requires attribution under CC BY 4.0. | |
South America Construction Market Analysis by Mordor Intelligence
South America Construction Market Analysis by Mordor Intelligence
The South America construction market size was valued at USD 748.22 billion in 2025 and is estimated to grow from USD 801.5 billion in 2026 to reach USD 861.13 billion by 2031, at a CAGR of 7.44% during the forecast period (2026-2031). Favorable policy cycles, a surge in sustainable-bond infrastructure programs, and deeper private-sector participation are reshaping capital flows into transport corridors, energy transition assets, and resilient social housing.
Brazil’s New PAC framework is crowding into engineering, procurement, and construction (EPC) contracts, which now bundle digital-twin oversight and real-time budget disclosure. Chile, Colombia, and Peru complement this momentum with tax incentives for desalination plants, metro extensions, and mine-site water pipelines. At the same time, modern prefabricated and modular methods are gaining traction as skilled-labor scarcity and tight schedules challenge traditional cast-in-place techniques across the region.
Key Report Takeaways
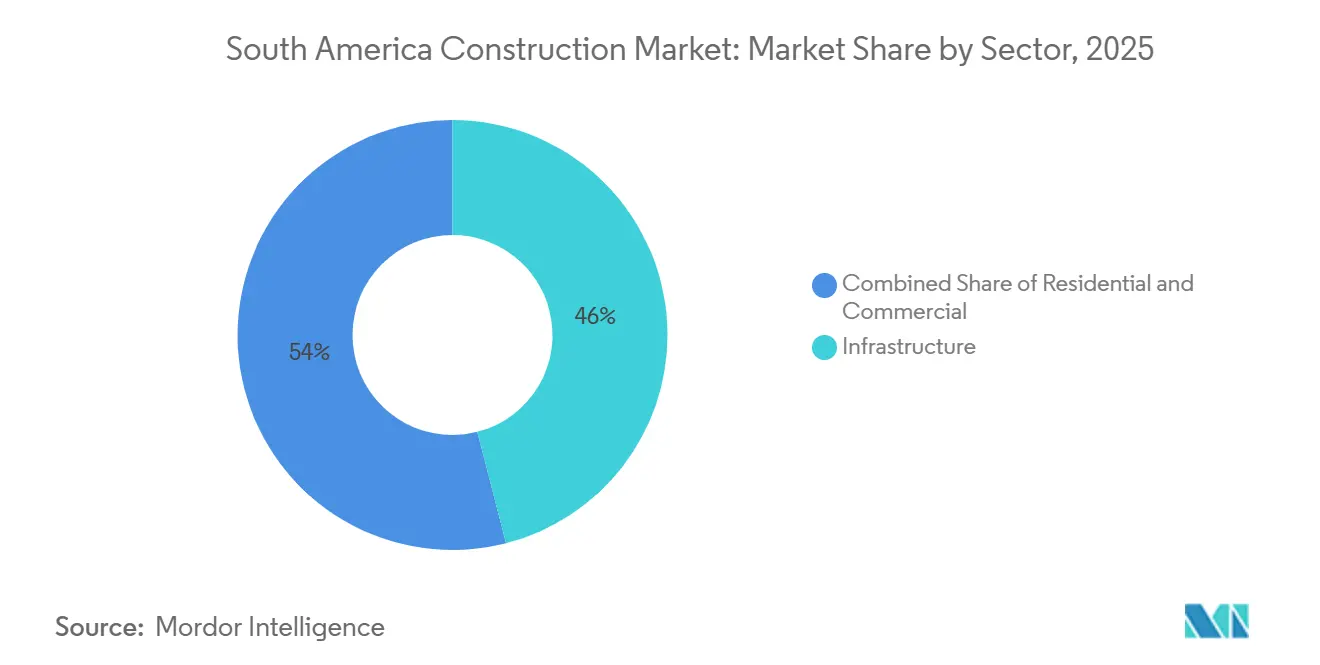
- By sector, infrastructure commanded a 46% share of the South America construction market in 2025, while the energy and utilities sub-segment is forecast to post an 8.0% CAGR through 2031.
- By construction type, new builds represented 68% of 2025 spend, whereas renovation and retrofit activity is projected to advance at an 8.44% CAGR to 2031.
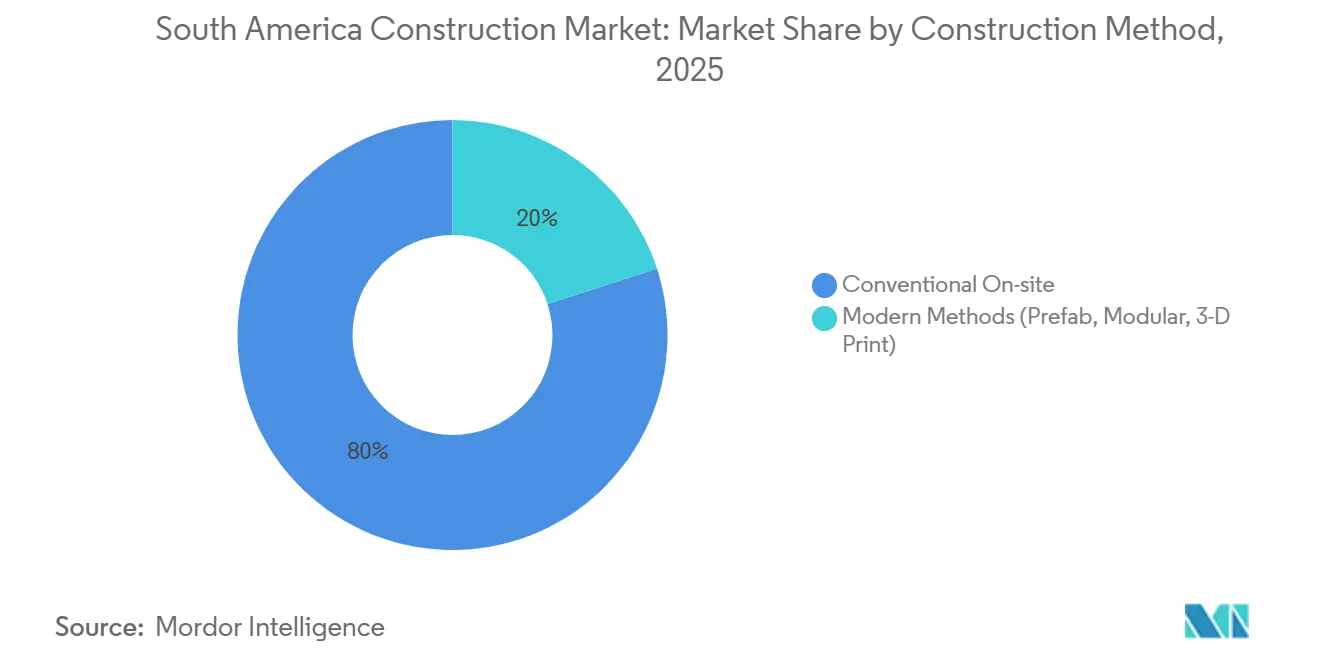
- By construction method, conventional on-site techniques held 80% of 2025 value; prefabricated and modular approaches are expected to expand at a 9.12% CAGR over the same horizon.
- By investment source, private capital accounted for 66% of 2025 activity, yet public outlays are set to register the faster 8.66% CAGR through 2031.
- By geography, Brazil led with 33% of 2025 expenditure, but Peru is primed for the quickest 8.45% CAGR between 2026 and 2031.
Note: Market size and forecast figures in this report are generated using Mordor Intelligence’s proprietary estimation framework, updated with the latest available data and insights as of January 2026.
South America Construction Market Trends and Insights
Drivers Impact Analysis*
| Driver | (%) Impact on CAGR Forecast | Geographic Relevance | Impact Timeline |
|---|---|---|---|
| Pan-South America green-bond PPP financing surge | +1.2% | Brazil, Chile, Colombia, spillover to Peru and Argentina | Medium term (2-4 years) |
| Brazil’s New PAC 2023-2027 infrastructure super-cycle | +1.8% | Brazil (Southeast and Northeast) | Long term (≥ 4 years) |
| Copper-belt mine-capex EPC pipeline | +1.0% | Chile and Peru mining belts; secondary impact in Argentina | Medium term (2-4 years) |
| Caribbean-coast climate-resilient housing PPP corridors | +0.6% | Colombia Caribbean coastline | Short term (≤ 2 years) |
| Amazon fiber-optic corridor-triggered data-center wave | +0.9% | Brazil Amazon basin; nodes in São Paulo and Rio de Janeiro | Medium term (2-4 years) |
| Southern Cone green-hydrogen mega-project EPC demand | +1.1% | Chile Magallanes, Argentina Patagonia, Southern Peru | Long term (≥ 4 years) |
| Source: Mordor Intelligence | |||
Pan-South America Green-Bond PPP Financing Surge
Issuance of sustainability-linked bonds earmarked for public-private partnerships climbed 42% year-on-year in 2025, channeling USD 164 billion into rail, port, and renewable-energy assets since 2014. Infrastructure ministries in Brazil and Chile now require independent ESG verification on all PPP concessions above USD 50 million, a step that narrows risk spreads by 80-120 basis points for long-tenor debt. Pension funds from Colombia and sovereign-wealth managers from the Gulf have consequently re-entered the South America construction market, diversifying what was once a bank-dominated funding pool. As covenants mandate ISO 14001 compliance, bidders invest earlier in environmental baselining, a shift that lengthens pre-award timetables but improves downstream cost certainty. Over the medium term, blended-finance vehicles backed by the Inter-American Development Bank (IDB) are expected to replicate Colombia’s 5G highway model in Peru and Argentina.
Brazil’s New PAC 2023-2027 Infrastructure Super-Cycle
The New Growth Acceleration Program allocates USD 340 billion, with disbursements front-loaded before municipal polls to accelerate metro expansions in São Paulo, Belo Horizonte, and Fortaleza, along with 12 GW of transmission-line capacity from the wind-rich Northeast. Unlike prior rounds, the initiative withholds transfers from sub-national entities that fail to publish real-time procurement dashboards, curbing the leakage that plagued earlier waves. Two marquee concessions awarded in 2025, the 1,100-kilometer BR-040 and the 870-kilometer BR-381, apply traffic-linked availability payments that lower sovereign exposure while guaranteeing contractors predictable cash flows. Social-housing schemes within the program absorb up to 18% of regional cement output, tightening supply for commercial starts. Over a longer horizon, project sponsors expect interoperability between federal and state digital twin systems, enabling instant status audits across the entire South American construction market[1]Casa Civil, “Programa de Aceleração do Crescimento 2023-2027,” casacivil.gov.br .
Copper-Belt Mine-Capex EPC Pipeline
Chile’s state miner Codelco and diversified majors such as BHP have collectively earmarked more than USD 26 billion to extend mine life at sprawling pit-to-plant complexes. Underground block-caving, tailings expansion, and desalination water supply dominate the scope, creating sustained demand for tunnel-boring machines, reinforced concrete liners, and 220-kV substations. Peru mirrors this trend, as Las Bambas and Quellaveco scale up concentrator throughput and leach capacity despite intermittent delays in social license approvals. Contractors offset labor scarcity at 3,000-meter elevations through fly-in rotations and modular camp units, which increase EPC outlays by nearly 12% while reducing schedule slippage. Argentina’s lithium-triangle brine fields add a secondary leg, requiring haul roads and sulfuric-acid transport infrastructure to feed battery-grade carbonate plants.
Caribbean-Coast Climate-Resilient Housing PPP Corridors
Colombia’s Ministry of Housing authorized a USD 1.2 billion bundle to deliver 50,000 flood-resistant homes between Cartagena and Santa Marta. Designs elevate floor plates, embed hurricane-rated roofing, and incorporate rainwater harvesting that meets Sendai Framework targets. Local builders Conconcreto and Colpatria captured 60% of lots by committing to 18-month completions that employ precast wall panels fabricated in new Barranquilla facilities. The IDB provides 40% of the debt as a concessional tranche, contingent on women-owned subcontractors winning at least 1/5 of the contract value. Early delivery of the first 12,000 units three months ahead of schedule has already trimmed insurance premiums for coastal lenders and sets a blueprint for replication in Venezuelan border states[2]Ministerio de Vivienda, “Programa de Vivienda Resiliente Costera,” minvivienda.gov.co .
Restraints Impact Analysis*
| Restraint | (%) Impact on CAGR Forecast | Geographic Relevance | Impact Timeline |
|---|---|---|---|
| Political-cycle project cancellations | –0.8% | Peru; secondary impact in Argentina and Ecuador | Short term (≤ 2 years) |
| Elevated regional lending rates squeezing residential demand | –1.1% | Argentina, Chile, Brazil; moderate in Colombia | Medium term (2-4 years) |
| Post-Lava-Jato anti-corruption compliance cost spike | –0.5% | Brazil; spillover to Peru and Colombia PPP rules | Long term (≥ 4 years) |
| Volcanic-ash cement-supply disruptions | –0.3% | Ecuador; localized in Southern Colombia | Short term (≤ 2 years) |
| Source: Mordor Intelligence | |||
Political-Cycle Project Cancellations
Peru’s cabinet reshuffles and budget stand-offs froze disbursements for 18 highway concessions and six hospital PPPs in 2024, stalling USD 2.8 billion of shovel-ready work. Similar turbulence in Argentina after the 2023 presidential transition forced renegotiation of 12 toll-road contracts, delaying financial close by up to a year and raising contractor risk spreads. Ecuador’s planned referendum on Amazon drilling has likewise chilled pipeline and port tenders, while municipal elections in Brazil periodically redirect earmarks away from long-lead schemes. These stop-go patterns introduce 200-300 basis-point premiums to EPC bids and deter small-cap builders that lack balance-sheet resilience. Over the short term, multilateral lenders impose escrow accounts and step-in rights to keep priority projects alive when politics shift.
Elevated Regional Lending Rates Squeezing Residential Demand
Policy rates peaking above double digits in Brazil and Chile translated into mortgage origination falling 22% and 18%, respectively, below 2021 levels. Argentine inflation above 200% rendered peso-linked loans untenable, prompting developers to pivot toward dollar-denominated luxury towers. Colombian rates stabilized at 13% but still curtailed first-home uptake, steering builders into social-rental PPPs with government guarantees. While high-income buyers in São Paulo and Santiago continue to absorb supply, the mid-tier has stalled, widening the affordability gap. Until monetary easing gains traction, private housing starts will trail the broader South America construction market by several percentage points[3]Banco Central do Brasil, “Relatório de Política Monetária 2026,” bcb.gov.br .
*Our forecasts treat driver/restraint impacts as directional, not additive. The impact forecasts reflect baseline growth, mix effects, and variable interactions.
Segment Analysis
By Sector: Infrastructure Anchors Regional Spend
Infrastructure captured 46% of the South America construction market share in 2025. Two elements keep it dominant: Brazil’s New PAC transportation drive and Chile’s grid upgrades tied to the scaling of renewables. Energy and utilities, although starting from a smaller base, is projected to log the fastest 8.0% CAGR to 2031 as hydrogen hubs, desalination plants, and long-distance transmission lines proliferate. Techint and Elecnor secured a combined 60% of Chile’s upcoming 3,200-kilometer high-voltage build-out, confirming that specialized EPC skill sets hold pricing power. Conversely, residential construction, representing 28% of the 2025 value, remains hostage to mortgage costs, albeit partially cushioned by social-housing PPP pipelines in Colombia and Brazil. Commercial starts have bifurcated: speculative office towers are on hold, while logistics and cold-storage warehouses are enjoying robust pre-leasing from e-commerce players, reinforcing the sector’s gradual pivot from commodity-linked cycles toward programmatic, climate-aligned investments.
The South American infrastructure construction market is projected to reach USD 395 billion by 2031, while energy and utilities are expected to exceed USD 195 billion, reflecting their higher CAGR. Investors increasingly assess carbon intensity and resilience features rather than mere traffic counts or mine grades when allocating capital. Private-equity funds now bundle grid, port, and data-center assets into blended vehicles, lowering concentration risk and improving rating-agency treatment. These structures give sovereign borrowers fiscal breathing room and explain why infrastructure retains top priority in multiyear spending laws across Brazil, Chile, and Colombia.


By Construction Type: Retrofit Momentum Building
New construction accounted for 68% of the South American construction market share in 2025, driven by metro extensions and mine portals. Renovation and retrofit work, however, is expected to clock an 8.44% CAGR through 2031, riding on stricter seismic and energy-efficiency mandates. Chile’s revised seismic code drives USD 1.8 billion in structural reinforcement in Greater Santiago alone, while Peru’s public-building efficiency law unlocks USD 600 million in LED, HVAC, and envelope upgrades. Retrofit specialists Mota-Engil and Besalco deploy digital twins to phase work around occupied facilities, cutting tenant disruption by up to 25% and boosting margin. Retrofit financing increasingly taps into the green bond market, as repayment can be tied to verified operational energy savings.
As buildings erected in the 1990s move past the three-decade mark, refurbishment shifts from discretionary to essential. Municipalities such as São Paulo deploy land-value capture to fund heritage façades, while Colombian cities package façade retention with income-linked rental covenants. Altogether, a balanced portfolio of ground-up and retrofit work now characterizes contractor pipelines, spreading risk across economic cycles.
By Construction Method: Prefabrication Gains Ground
Conventional on-site processes retained 80% of 2025 spend, but modern methods of construction (MMC) are poised for the quickest 9.12% CAGR as data-center shells, mining camps, and social-housing panels migrate to factory floors. AWS mandates modular data halls for its Brazil expansions, slicing timeline and onsite headcount, while Conconcreto’s Barranquilla plant supplies hurricane-rated wall units to Colombia’s coastal PPPs. Chilean miners install modular substations at altitudes where labor productivity lags, a tactic that offsets freight premiums with fewer man-hours. Prefab adoption also dovetails with decarbonization: off-site curing uses renewable electricity, slashing embodied CO₂ by nearly 20% per component.
Regulatory frameworks are catching up: Brazil’s standards agency is drafting a uniform code for 3D-printed concrete elements to smooth approvals. Equipment suppliers like Holcim and Lafarge invest in mobile batching plants that follow major PPP corridors, shrinking logistics costs. Skill-focused training programs sponsored by the IDB aim to reskill brick-layers into assembly technicians, widening the MMC talent pool.
By Investment Source: Public Funding Rebounds
Private capital held a 66% stake in 2025, reflecting robust mining and commercial pipelines, but state-sourced funding is expected to post an 8.66% CAGR to 2031 as green bonds and PAC outlays accelerate. Brazil alone budgets USD 136 billion for federally backed infrastructure through 2027, while Chile lifts its 2025 public-investment plan by 18%. Multilaterals grease the wheels with grant-like first-loss tranches that crowd-in pension funds. This pivot matters for the South American construction market because public projects emphasize social value, metro equity, road safety, and resilience, broadening the opportunity set beyond high-return private concessions. Hybrid models dominate Colombia’s 5G roads, where toll top-ups kick in only if traffic underperforms, aligning incentives while capping sovereign contingent liabilities.
Looking forward, the public share could climb to 40% as governments lean on infrastructure spending to support post-pandemic employment and underpin climate commitments. Fiscal ceilings do impose limits, particularly in Argentina, but provincial mechanisms such as revenue-backed trusts keep priority corridors alive. Contractors now segment their bid teams: one group masters availability-payment math, another focuses on commodity-linked EPC, ensuring balanced order books.
Geography Analysis
Brazil contributed 33% of total 2025 expenditure, driven by New PAC megaprojects and USD 14 billion of hyperscale data-center commitments slated through 2028. São Paulo alone captures two-fifths of national spend by combining metro expansions, toll-road upgrades, and multistory logistics hubs aligned with near-shoring trends. The Northeast’s share is climbing fast thanks to transmission-grid build-outs that evacuate its abundant wind and solar output. Despite this strength, compliance overhead after the Lava Jato scandal inflates bid-preparation costs, compelling many mid-tier firms to collaborate with international partners versed in ISO 37001 systems.
Chile’s pipeline is anchored by Magallanes green-hydrogen clusters, lithium-triangle infrastructure, and the USD 680 million Metro Line 7 extension in Santiago. Colombia leans on its 5G highway concessions and Caribbean housing corridors, together mobilizing around USD 12 billion during 2024-2025. Both countries signal policy continuity in support of PPP frameworks, which keeps risk premiums subdued relative to neighbors.
Peru, while wrestling with cabinet changes, is projected to post the swiftest 8.45% CAGR to 2031 as copper-belt mine life extensions and Lima Metro phases progress. Argentina remains a smaller 10-12% slice owing to fiscal austerity and elevated inflation, yet Vaca Muerta gas pipelines and Patagonia hydrogen pledges offer selective upside. The remainder, Ecuador, Bolivia, Paraguay, Uruguay, and Venezuela—collectively adds 8-10% of value, with Uruguay punching above its weight via renewable-energy ports and boutique data farms, whereas Ecuador’s volcanic-ash episodes underscore supply-chain fragility.
Competitive Landscape
Strategic focus has pivoted toward integrated design-build-finance packages that couple digital-twin monitoring with transparent, ledger-based procurement. Annual technology budgets of USD 50-80 million are now routine for leading firms, with Techint already deploying distributed-ledger tools that reduce change-order dispute time by 30%. European entrants such as Elecnor and OHL exploit niche expertise in green-hydrogen EPC and value capture finance, but must meet 30-40% local-content rules that favor incumbents’ supply networks.
A second competitive layer has emerged around hyperscale data center construction, where vertically integrated specialists like Ascenty and Datum Datacenters bypass traditional general contractors, offering turnkey delivery in under 15 months. Their rise puts pressure on mainstream builders to acquire or partner with modular fabricators to protect their market share. Meanwhile, circular-economy materials gain ground: three pilot projects in Chile and Brazil demonstrate 15-20% lower embodied carbon by incorporating recycled aggregates, earning them first-mover advantage with ESG-oriented investors.
Patent filings provide further differentiation. Techint’s 2025 modular substation design and SalfaCorp’s bridge-segment system shorten on-site activities, making them attractive for projects with tight right-of-way or severe weather windows. Andrade Gutierrez’s attainment of ISO 37001 certification after a three-year overhaul restores eligibility for multilaterally financed tenders. As compliance becomes table stakes, the next battleground lies in predictive analytics—systems that forecast weather, labor availability, and supply-chain risk simultaneously, to squeeze out single-digit margin gains in a cost-sensitive arena.
South America Construction Industry Leaders
Andrade Gutierrez
Camargo Corrêa
Techint Engineering & Construction
Mota-Engil Latin America
Sacyr Ingeniería e Infraestructuras
- *Disclaimer: Major Players sorted in no particular order

Recent Industry Developments
- January 2026: Amazon Web Services confirmed a USD 3.2 billion capacity expansion in its São Paulo cloud region, adding two availability zones and 120 MW of IT load, with Techint as EPC lead and commissioning slated for Q4 2027.
- December 2025: Sacyr Ingeniería secured a USD 680 million contract to extend Santiago’s Metro Line 7 by 8 kilometers and six stations, integrating seismic isolation bearings to comply with Chile’s 2024 code update.
- November 2025: Mota-Engil Latin America partnered with Ghella to pursue the USD 4.5 billion Lima Metro Line 3, aiming for financial close in Q3 2026 and start-up in 2031.
- October 2025: Conconcreto delivered the first 12,000 climate-resilient housing units on Colombia’s Caribbean coast three months early and 8% under budget, leveraging precast panels produced in a new Barranquilla plant,


South America Construction Market Report Scope
| Residential | Apartments / Condominiums |
| Villas / Landed Houses | |
| Commercial | Office |
| Retail | |
| Industrial & Logistics | |
| Others | |
| Infrastructure | Transportation (Road, Rail, Air, Marine) |
| Energy & Utilities | |
| Others |
| New Construction |
| Renovation / Retrofit |
| Conventional On-site |
| Modern Methods (Prefab, Modular, 3-D Print) |
| Public |
| Private |
| Brazil |
| Argentina |
| Chile |
| Colombia |
| Peru |
| Rest of South America |
| By Sector | Residential | Apartments / Condominiums |
| Villas / Landed Houses | ||
| Commercial | Office | |
| Retail | ||
| Industrial & Logistics | ||
| Others | ||
| Infrastructure | Transportation (Road, Rail, Air, Marine) | |
| Energy & Utilities | ||
| Others | ||
| By Construction Type | New Construction | |
| Renovation / Retrofit | ||
| By Construction Method | Conventional On-site | |
| Modern Methods (Prefab, Modular, 3-D Print) | ||
| By Investment Source | Public | |
| Private | ||
| By Country | Brazil | |
| Argentina | ||
| Chile | ||
| Colombia | ||
| Peru | ||
| Rest of South America | ||


Key Questions Answered in the Report
How large is the South America construction market in 2026?
It is estimated at USD 801.5 billion, on track to reach USD 861.13 billion by 2031.
Which segment holds the biggest share of spending?
Infrastructure leads with 46% of 2025 outlays, bolstered by transportation and energy corridors.
What area of construction is growing the fastest?
Energy and utilities is projected to expand at an 8.0% CAGR as green-hydrogen and grid projects accelerate.
Which country will grow the quickest to 2031?
Peru is forecast to post an 8.45% CAGR thanks to copper-belt mine expansions and metro extensions.
How are higher interest rates affecting residential projects?
Elevated policy rates have reduced mortgage origination 18-22% below pre-pandemic levels, delaying mid-tier housing starts.
What role do green bonds play in funding projects?
Sustainability-linked bonds now shave 80-120 basis points off financing costs and channel pension capital into PPP concessions.
Page last updated on:


