South Africa Water Treatment Chemicals Market Size and Share
Market Overview
| Study Period | 2021 - 2031 |
|---|---|
| Forecast Data Period | 2026 - 2031 |
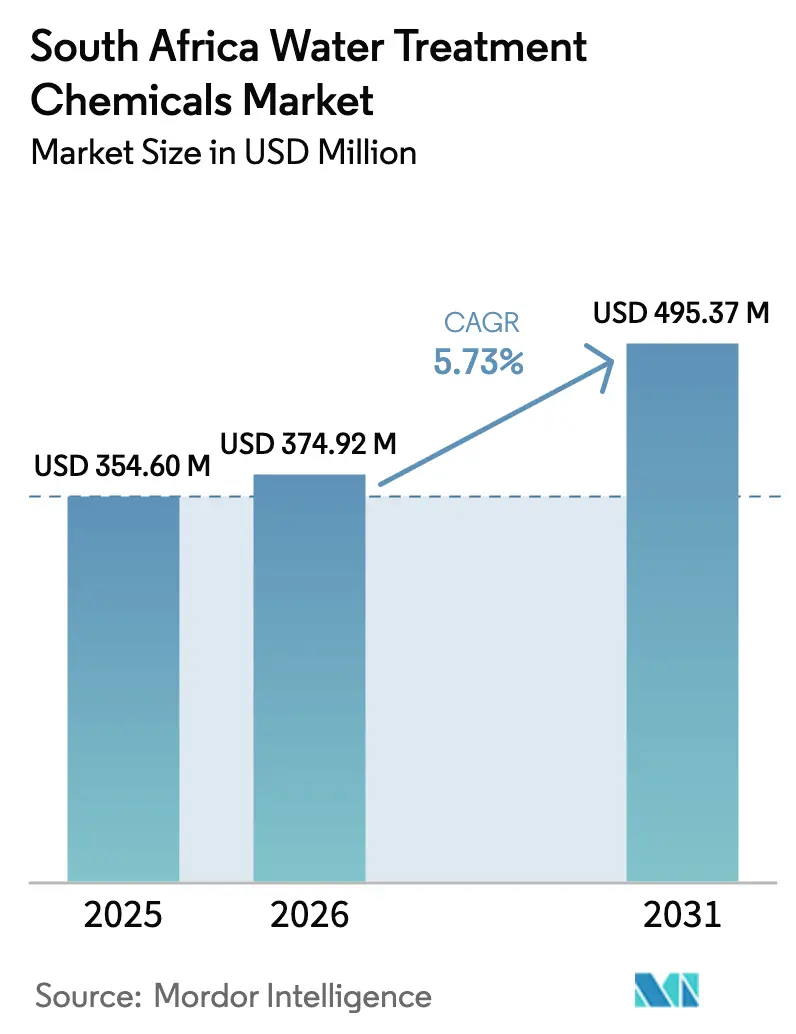
| Base Year Market Size (2025) | USD 354.60 Million |
| Market Size (2026) | USD 374.92 Million |
| Market Size (2031) | USD 495.37 Million |
| Growth Rate (2026 - 2031) | 5.73% CAGR |
| Market Concentration | Medium |
Major Players *Disclaimer: Major Players sorted in no particular order Image © Mordor Intelligence. Reuse requires attribution under CC BY 4.0. | |
South Africa Water Treatment Chemicals Market Analysis by Mordor Intelligence
The South Africa Water Treatment Chemicals Market size is expected to increase from USD 354.60 million in 2025 to USD 374.92 million in 2026 and reach USD 495.37 million by 2031, growing at a CAGR of 5.73% over 2026-2031. Persistent water scarcity, a high resource-allocation rate, and non-revenue water losses keep chemical demand structurally high. Renewed Blue Drop and Green Drop audits expose widespread municipal non-compliance, creating budget-protected procurement for coagulants, disinfectants, and polymers. Imported feedstock volatility and Stage 6 load-shedding raise cost pressures, yet infrastructure grants and mining water-reuse mandates sustain steady volume growth. Multinationals leverage specialty portfolios in membrane pretreatment and heavy-metal removal, while domestic producers protect bulk municipal accounts through local logistics and pricing agility.
Key Report Takeaways
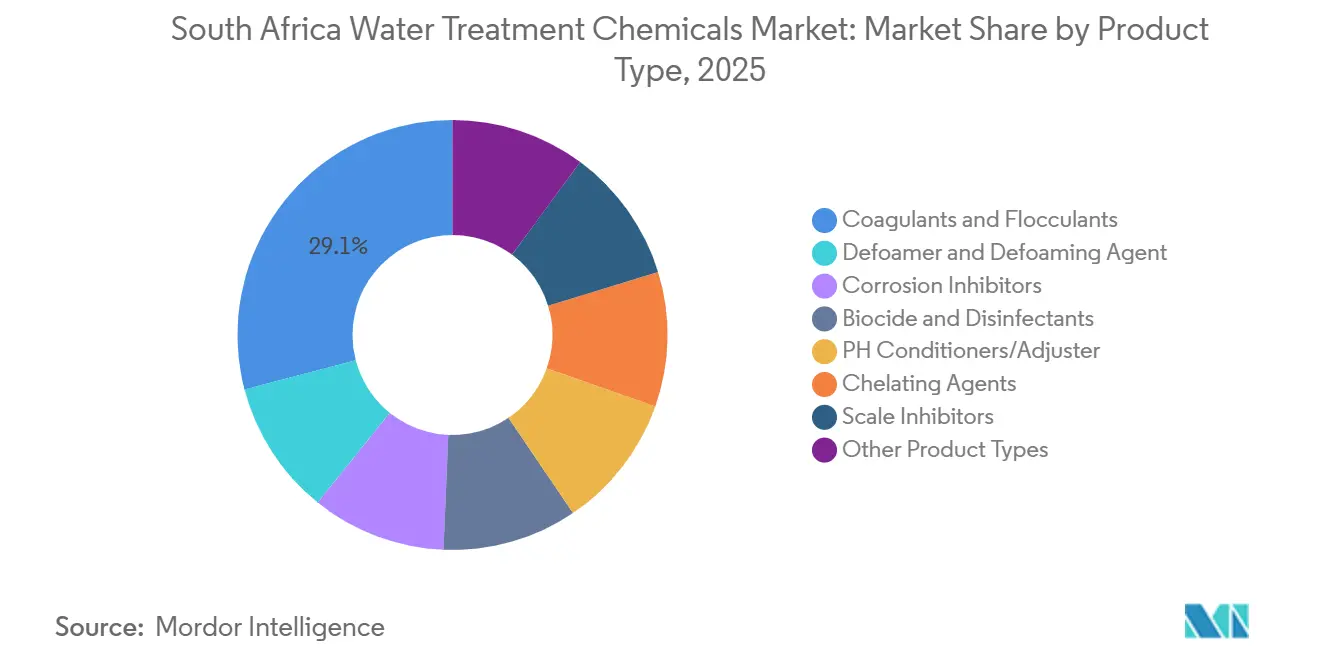
- By product type, coagulants and flocculants led with 29.07% of South Africa's water treatment chemicals market share in 2025. Biocides and disinfectants are forecast to expand at a 6.58% CAGR through 2031.
- By source, synthetic chemistries held 86.36% share of the South Africa water treatment chemicals market size in 2025 and are forecast to expand at a 5.93% CAGR through 2031.
- By application, raw-water clarification accounted for 39.79% of the South Africa water treatment chemicals market size in 2025 and is forecast to expand at a 6.32% CAGR through 2031.
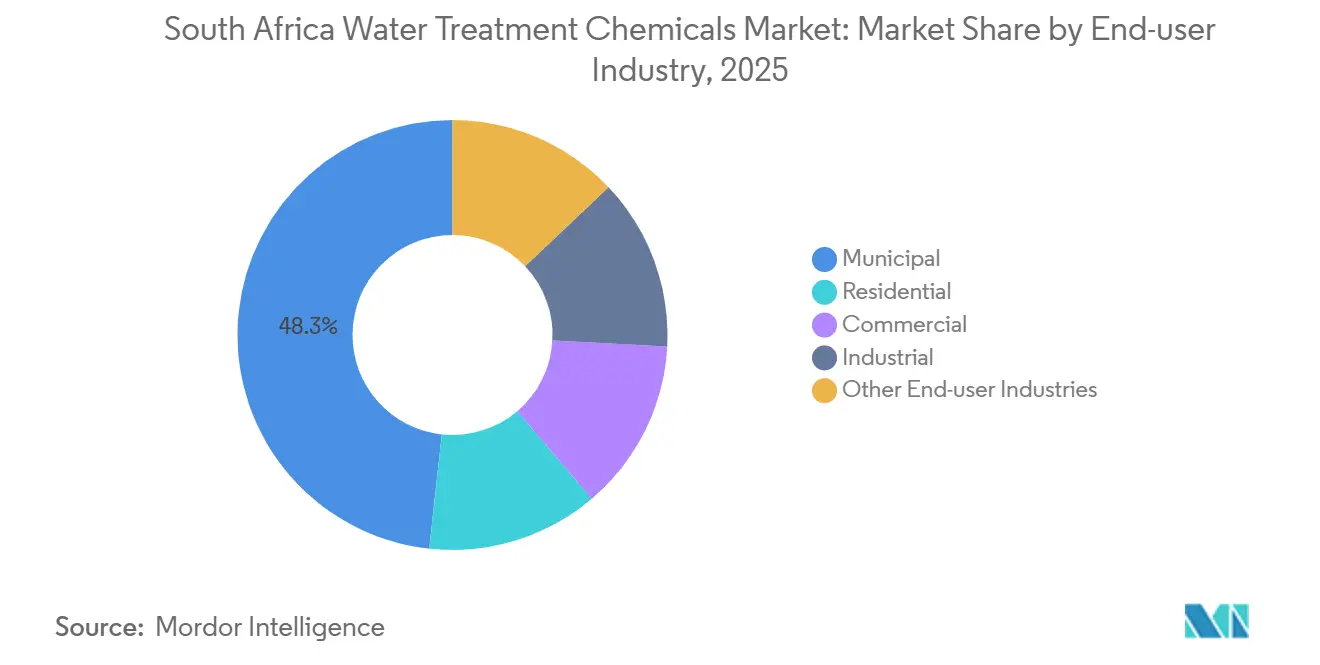
- By end user, the municipal segment captured 48.28% revenue in 2025 and is advancing at a 6.31% CAGR through 2031.
Note: Market size and forecast figures in this report are generated using Mordor Intelligence’s proprietary estimation framework, updated with the latest available data and insights as of January 2026.
South Africa Water Treatment Chemicals Market Trends and Insights
Drivers Impact Analysis*
| Drivers | (~) % Impact on CAGR Forecast | Geographic Relevance | Impact Timeline |
|---|---|---|---|
| Severe water scarcity intensifying post-2026 | +1.2% | National, with acute stress in Gauteng, Western Cape, Eastern Cape | Long term (≥ 4 years) |
| Escalating non-revenue water losses triggering chemical demand | +1.1% | National, concentrated in metros (Johannesburg, eThekwini, Cape Town) | Medium term (2-4 years) |
| Government Blue/Green Drop revival programme | +1.0% | National, prioritising 277 critical municipal systems | Medium term (2-4 years) |
| Mining and power sector water-reuse mandates | +0.9% | Gauteng, Mpumalanga, Limpopo, North West (mining belts); national (Eskom power stations) | Long term (≥ 4 years) |
| Rapid shift to membrane-based desalination units at coastal plants | +0.8% | Western Cape (Cape Town), KwaZulu-Natal (Durban), Eastern Cape (Nelson Mandela Bay) | Long term (≥ 4 years) |
| Source: Mordor Intelligence | |||
Severe Water Scarcity Intensifying Post 2026
South Africa faces a projected supply deficit by 2030, forcing higher chemical doses to safeguard potable water during droughts[1]Department of Water and Sanitation, “National Water and Sanitation Master Plan,” dws.gov.za. Rand Water’s Zuikerbosch System 5A, commissioned in 2025, consumes bulk lime, ferric chloride, carbon dioxide, and chlorine, illustrating project-driven volume. Climate variability shifts rainfall toward shorter, intense events, increasing raw-water turbidity and seasonal peaks in coagulant demand. Infrastructure upgrades lag master-plan targets, so chemicals remain the primary mitigation tool. Municipal tenders now favor bundled supply and technical service to stabilize dosing as quality fluctuates.
Escalating Non-Revenue Water Losses Triggering Chemical Demand
National NRW rose in 2023, compelling utilities to over-treat larger gross volumes. Leak-reduction projects in Johannesburg and eThekwini progress slowly, keeping chemical intensity above historical norms[2]City of Johannesburg, “Johannesburg Water Non-Revenue Water Reduction Programme,” joburg.org.za. Elevated residence times accelerate chlorine decay and biofilm formation, driving periodic shock-chlorination campaigns. Treasury grants prioritize pipe replacement, yet execution delays entrench chemical usage as a stopgap. Suppliers bundle leak-detection analytics with treatment chemistry to defend margins.
Government Blue/Green Drop Revival Programme
In 2023, audits reclassified systems as critical. Now, grant disbursements depend on improvement plans, ensuring chemical budgets are secured even in municipalities facing fiscal constraints. Microbiological failures lead to elevated residual-disinfectant set-points, bolstering biocide growth. Integrated service contracts are on the rise, combining chemical supply with operator training and automated dosing. As wastewater non-compliance grows, there's a heightened demand for ferric salt and polymer to aid in nutrient removal.
Mining and Power-Sector Water-Reuse Mandates
Water Use Licenses require mines to neutralize acid drainage with lime and ferric salts, then polish effluent with polyacrylamide flocculants. Eskom’s recirculating cooling systems rely on corrosion inhibitors and biocides to maintain plant efficiency. Sasol’s Secunda complex consumes specialty dispersants and pH adjusters, though capital discipline tempers near-term volume upside. Zero-liquid-discharge adoption fosters uptake of chelating agents and high-end polymers.
Restraints Impact Analysis*
| Restraints | (~) % Impact on CAGR Forecast | Geographic Relevance | Impact Timeline |
|---|---|---|---|
| Load-shedding inflates production and dosing costs | -0.7% | National, with acute impact on Gauteng and KwaZulu-Natal manufacturing hubs | Short term (≤ 2 years) |
| Raw-material import volatility (alum, epichlorohydrin) | -0.6% | National, affecting all formulators dependent on imported intermediates | Medium term (2-4 years) |
| Tightened metal-content specs (SANS 50883) raising compliance costs | -0.4% | National, affecting coagulant and flocculant manufacturers and municipal procurement | Medium term (2-4 years) |
| Source: Mordor Intelligence | |||
Load-Shedding Inflates Production and Dosing Costs
Chlor-alkali producers faced a surge in unit costs due to Stage 6 outages, compelling them to rely on diesel back-ups. In a bid to safeguard their electrolysis cells, companies secured dedicated power lines. Meanwhile, municipal plants grappled with dosing interruptions, leading to chemical wastage and potential compliance issues. Although suppliers incorporate a risk premium into their tender pricing, utilities, already strapped for cash, push back against absorbing the entire cost. As a result, energy insecurity tightens profit margins and hampers capacity expansions.
Raw-Material Import Volatility (Alum, Epichlorohydrin)
The ZAR depreciated against the USD, leading to heightened landed costs for alum and epichlorohydrin. Formulators, bound by annual tenders, find it challenging to pass on these costs, thereby squeezing their profit margins. AECI's divestment of its Public Water unit underscores the impact of margin pressures on portfolio decisions. With energy costs posing a challenge, local expansion in alum production seems improbable, leaving pricing susceptible to currency fluctuations.
*Our forecasts treat driver/restraint impacts as directional, not additive. The impact forecasts reflect baseline growth, mix effects, and variable interactions.
Segment Analysis
By Product Type: Coagulants Anchor Municipal Clarification Demand
Coagulants and flocculants captured 29.07% of South Africa water treatment chemicals market revenue in 2025. The category benefits from raw-water turbidity spikes and ongoing clarifier upgrades in 277 critical municipal systems. Commodity alum and ferric salts drive volume, while polyacrylamide blends provide margin. Biocides and disinfectants, the fastest-growing line at 6.58% CAGR, benefit from cholera outbreaks that prompted emergency chlorination in peri-urban areas. Antiscalants, corrosion inhibitors, and dispersants target industrial boilers, cooling towers, and desalination plants, providing premium positions for multinationals. Defoamers and chelating agents remain niche yet essential in sludge-dewatering and heavy-metal removal circuits.
Second-tier products show rising interest as Blue Drop scoring now awards points for advanced oxidation and nutrient control. Municipal tenders stipulate NSF or SANS certification, and 442 registered products meet this threshold, underscoring intense competition. Suppliers differentiate through blended chemistries that lower sludge volumes and cut polymer consumption, while public-private operators bundle dosing equipment leasing into multi-year contracts.


By Source: Synthetic Chemistries Dominate on Cost and Supply
Synthetic chemistries held 86.36% share in 2025, expanding at 5.93% CAGR through 2031. Chlor-alkali, sulfuric-acid, and polymer units in Gauteng and KwaZulu-Natal underpin local supply. Afro-Zonke’s plant, online in 2026, further secures chlorine and caustic soda feedstocks. Bio-based offerings—chitosan flocculants, plant-extract coagulants—remain pilot-scale because feedstock logistics and certification pathways are untested. A 2024 University of Johannesburg study proved cyclodextrin-ionic liquid polyurethanes effective for organics and chromium removal, but regeneration economics block commercialization.
Cost advantage, established dosing curves, and insurance-approved hazard classifications cement synthetic incumbency. Carbon-pricing debates may shift the balance, yet near-term volumes stay firmly synthetic.
By Application: Raw-Water Clarification Leads Consumption
Raw-water clarification accounted for 39.79% of demand in 2025, advancing at a 6.32% CAGR through 2031. High turbidity during summer storms forces elevated alum and polymer doses. Desalination and reverse-osmosis pretreatment grow fastest as coastal metros replicate Cape Town’s membrane model. Antiscalants and biocides for RO systems attract high unit prices, and tender specifications often bundle membrane autopsy and cleaning services, locking in multi-year revenue. Cooling-water and boiler-water treatment in Eskom stations and Sasol’s Secunda complex rely on corrosion and scale inhibitors to maintain thermal efficiency, placing a steady baseline demand. Acid mine drainage circuits consume lime, ferric chloride, and polymers at high per-cubic-meter ratios, sustaining regional volumes in Mpumalanga and Limpopo.
By End-User Industry: Municipal Sector Dominates Revenue and Growth
The municipal sector captured 48.28% of 2025 revenue and is growing at a 6.31% CAGR to 2031. Infrastructure grants flow toward clarifier refurbishment, sludge dewatering, and dosing automation. Rand Water’s Zuikerbosch project exemplifies large-scale chemical off-take. Industrial sectors, including mining, power, food and beverage, and chemicals, account for a significant portion of the volume and prefer longer contracts, pricing quarterly against feedstock indices. In contrast, the residential and commercial segments are more fragmented, concentrating on point-of-use chlorine tablets and compact softening units.
Geography Analysis
In South Africa, Gauteng, KwaZulu-Natal, and the Western Cape dominate the demand for water treatment chemicals. Gauteng boasts a concentrated corridor, spanning from chlorine production to polymer manufacturing, with key players like Afro-Zonke, NCP Chlorchem, and AECI clustered close to Johannesburg. This strategic positioning ensures swift deliveries to municipal depots. Meanwhile, KwaZulu-Natal capitalizes on Durban’s port for importing sulfuric acid and polymer feedstocks, while also exporting processed coagulants to neighboring SADC states. In the Western Cape, a persistent drought has hastened the adoption of desalination. With capital expenditure pipelines extending through 2028, there's a clear indication of a sustained demand for chemicals.
Mpumalanga and Limpopo, known for their mining prowess, exhibit a heightened chemical usage for every cubic meter treated. In the Witwatersrand and chrome belt, acid mine drainage plants utilize lime and ferric salts at above-average rates. While the Eastern Cape, North West, and Free State lag in per-capita spending, they benefit from prioritized Blue Drop interventions, hinting at potential growth. Due to logistical challenges on the Transnet rail, formulators are establishing satellite depots near provincial capitals. This move not only enhances service levels but also reduces the risk of stock-outs.
Competitive Landscape
The South Africa water treatment chemicals market is moderately concentrated. Multinationals control high-margin specialties and digital dosing platforms. Domestic majors hold bulk municipal tenders and leverage local logistics. Strategic moves include Solenis absorbing BASF flocculants in 2024 to deepen mining exposure; Ecolab acquiring Ovivo’s ultrapure-water unit in 2025 to target semiconductor and pharma clients; and Veolia expanding AQUAMAX antiscalant stocking near Cape Town to capture desalination growth. Local innovators explore bio-based polymers and phosphonate-free antiscalants but face certification hurdles and venture-capital scarcity.
South Africa Water Treatment Chemicals Industry Leaders
AECI
SNF
Ecolab Inc.
Solenis
Flocuchem
- *Disclaimer: Major Players sorted in no particular order

Recent Industry Developments
- December 2025: Ecolab completed the acquisition of Ovivo’s Electronics Ultrapure Water business, boosting advanced-treatment offerings for South African high-tech sites.
- November 2024: BASF divested its flocculant mining portfolio, including Magnafloc and Rheomax trademarks, to Solenis to refocus on flotation reagents.


South Africa Water Treatment Chemicals Market Report Scope
Water treatment chemicals are substances used to purify water by removing contaminants, disinfecting, and preventing scaling or corrosion in industrial, municipal, and residential water systems. These chemicals are categorized based on their specific roles in the water treatment process.
The water treatment chemicals market is segmented by product type, source, application, and end-user industry. By product type, the market is segmented into coagulants and flocculants, defoamers and antifoams, corrosion inhibitors, biocides and disinfectants, pH conditioners/adjusters, chelating agents, scale inhibitors, and other products. By source, the market is segmented into synthetic and bio-based. By application, the market is segmented into boiler water treatment, cooling water treatment, raw water clarification, desalination and RO pre-treatment, and other applications. By end-user industry, the market is segmented into residential, commercial, industrial, municipal, and other industries. For each segment, the market sizing and forecasts have been done on the basis of revenue (USD).
| Coagulants and Flocculants |
| Defoamer and Defoaming Agent (Antifoams) |
| Corrosion Inhibitors |
| Biocide and Disinfectants |
| PH Conditioners/Adjuster |
| Chelating Agents |
| Scale Inhibitors |
| Other Product Types |
| Synthetic |
| Bio-based |
| Boiler Water Treatment |
| Cooling Water Treatment |
| Raw Water/Intake Clarification |
| Desalination and RO Pre-treatment |
| Other Applications |
| Residential |
| Commercial |
| Industrial |
| Municipal |
| Other End-user Industries |
| By Product Type | Coagulants and Flocculants |
| Defoamer and Defoaming Agent (Antifoams) | |
| Corrosion Inhibitors | |
| Biocide and Disinfectants | |
| PH Conditioners/Adjuster | |
| Chelating Agents | |
| Scale Inhibitors | |
| Other Product Types | |
| By Source | Synthetic |
| Bio-based | |
| By Application | Boiler Water Treatment |
| Cooling Water Treatment | |
| Raw Water/Intake Clarification | |
| Desalination and RO Pre-treatment | |
| Other Applications | |
| By End-user Industry | Residential |
| Commercial | |
| Industrial | |
| Municipal | |
| Other End-user Industries |


Key Questions Answered in the Report
What is driving sustained demand for South Africa's water treatment chemicals despite fiscal constraints at municipalities?
Persistent water scarcity, non-revenue water losses, and Blue/Green Drop compliance mandates oblige utilities to maintain or raise chemical dosing even when capital budgets are tight.
Which product categories are growing fastest within South Africa water treatment chemicals?
Biocides and disinfectants are forecast to expand at a 6.58% CAGR through 2031, aided by cholera outbreaks and tougher microbiological standards.
Are bio-based coagulants likely to displace synthetic alum and ferric salts soon?
No near-term shift is expected because pilot projects struggle with feedstock availability, regeneration economics, and potable-water certification, keeping synthetics at 86.36% share in 2025.
What is the current South Africa demand for water treatment chemicals market and its expected growth by 2031?
South Africa's consumption is USD 374.92 million in 2026 and is projected to reach USD 495.37 million by 2031, reflecting a 5.73% CAGR.
Page last updated on:


