South Africa Solar Photovoltaic (PV) Market Size and Share
Market Overview
| Study Period | 2020 - 2030 |
|---|---|
| Forecast Data Period | 2025 - 2030 |
| Historical Data Period | 2020 - 2023 |
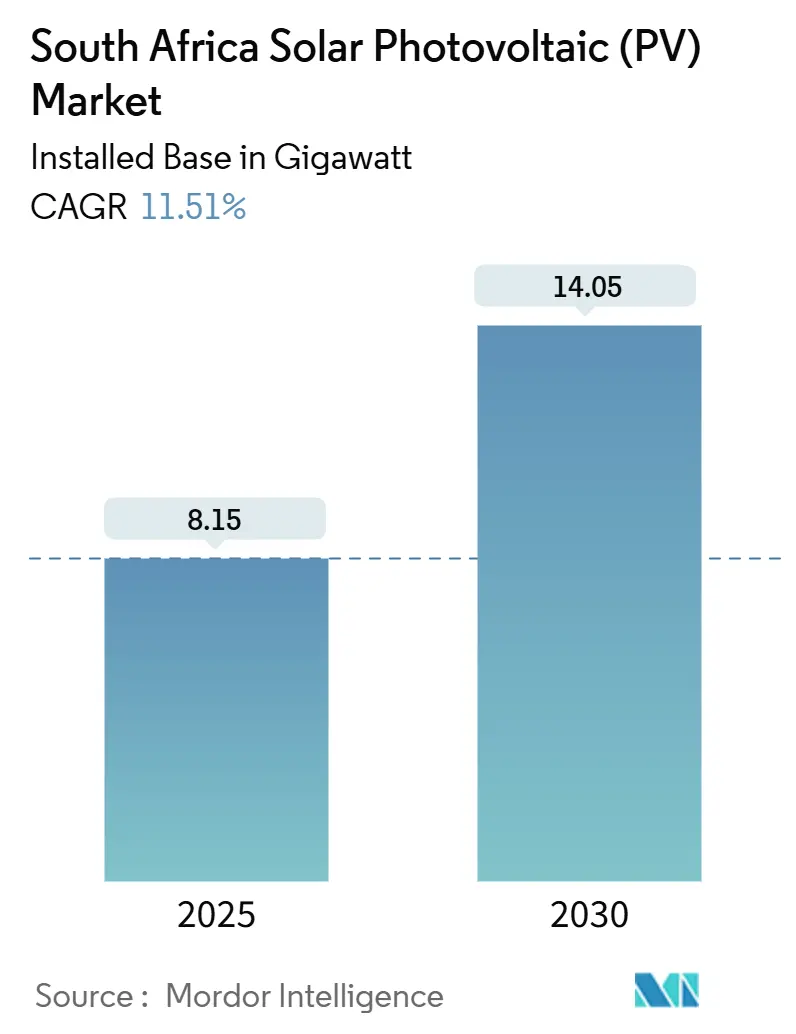
| Market Volume (2025) | 8.15 gigawatt |
| Market Volume (2030) | 14.05 gigawatt |
| Growth Rate (2025 - 2030) | 11.51% CAGR |
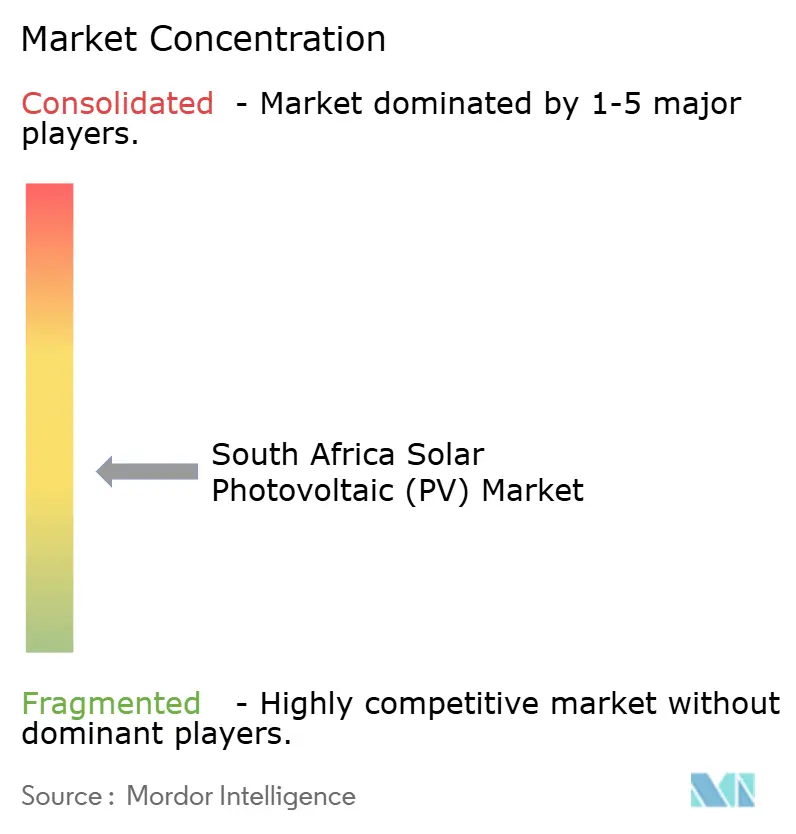
| Market Concentration | Medium |
Major Players *Disclaimer: Major Players sorted in no particular order Image © Mordor Intelligence. Reuse requires attribution under CC BY 4.0. | |
South Africa Solar Photovoltaic (PV) Market Analysis by Mordor Intelligence
The South Africa Solar Photovoltaic Market size in terms of installed base is expected to grow from 8.15 gigawatt in 2025 to 14.05 gigawatt by 2030, at a CAGR of 11.51% during the forecast period (2025-2030).
Capacity additions are accelerating as chronic load-shedding pushes companies to build self-generation assets, and Bid Window 7’s 1.76 GW award confirms government procurement momentum. Crystalline-silicon modules remain dominant, but thin-film cadmium-telluride technology is scaling on high-temperature performance advantages. Rooftop demand is expanding in Gauteng and Western Cape as leasing models remove upfront cost barriers, while large IPPs continue to anchor ground-mounted growth in Northern Cape desert zones. Equipment pricing is falling in tandem with global supply-chain overcapacity, yet grid bottlenecks and import tariffs temper near-term margin outlooks.
Key Report Takeaways
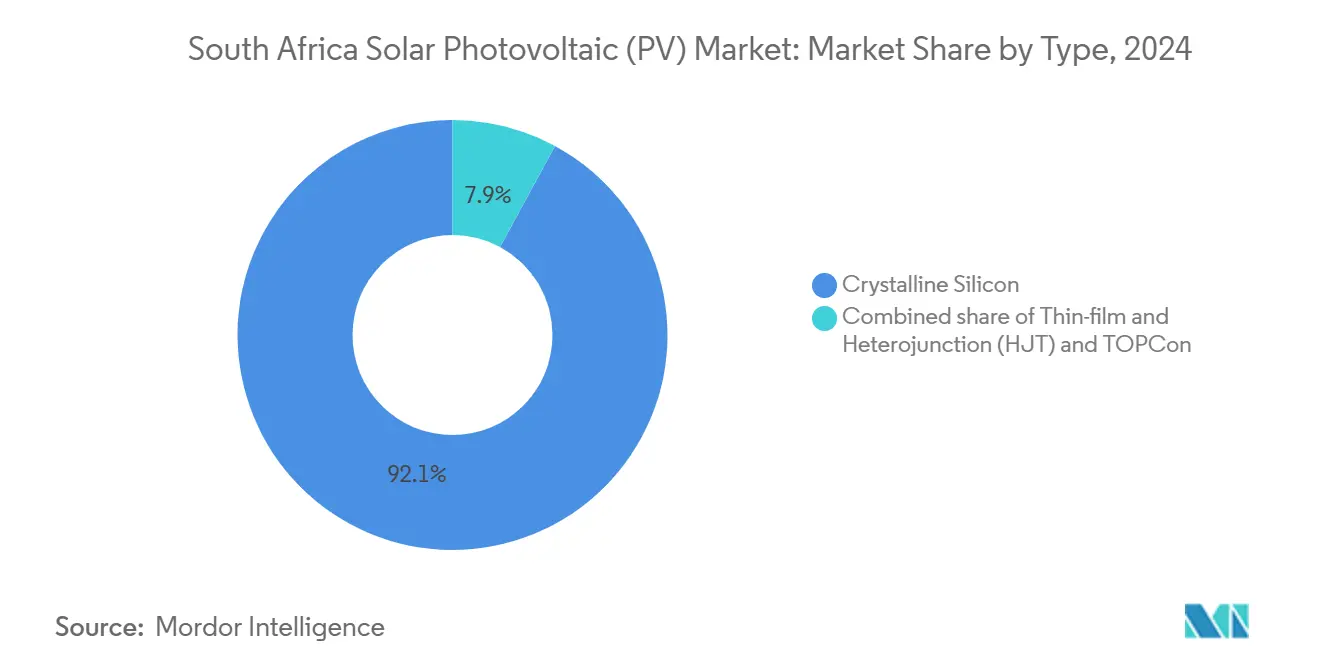
- By type, crystalline-silicon modules held 92.1% of the South Africa solar photovoltaic market share in 2024, whereas thin-film technology is forecast to grow at a 19.7% CAGR through 2030.
- By grid type, on-grid plants accounted for 93.9% of the South Africa solar photovoltaic market share in 2024, while off-grid systems are projected to expand at a 15.2% CAGR to 2030.
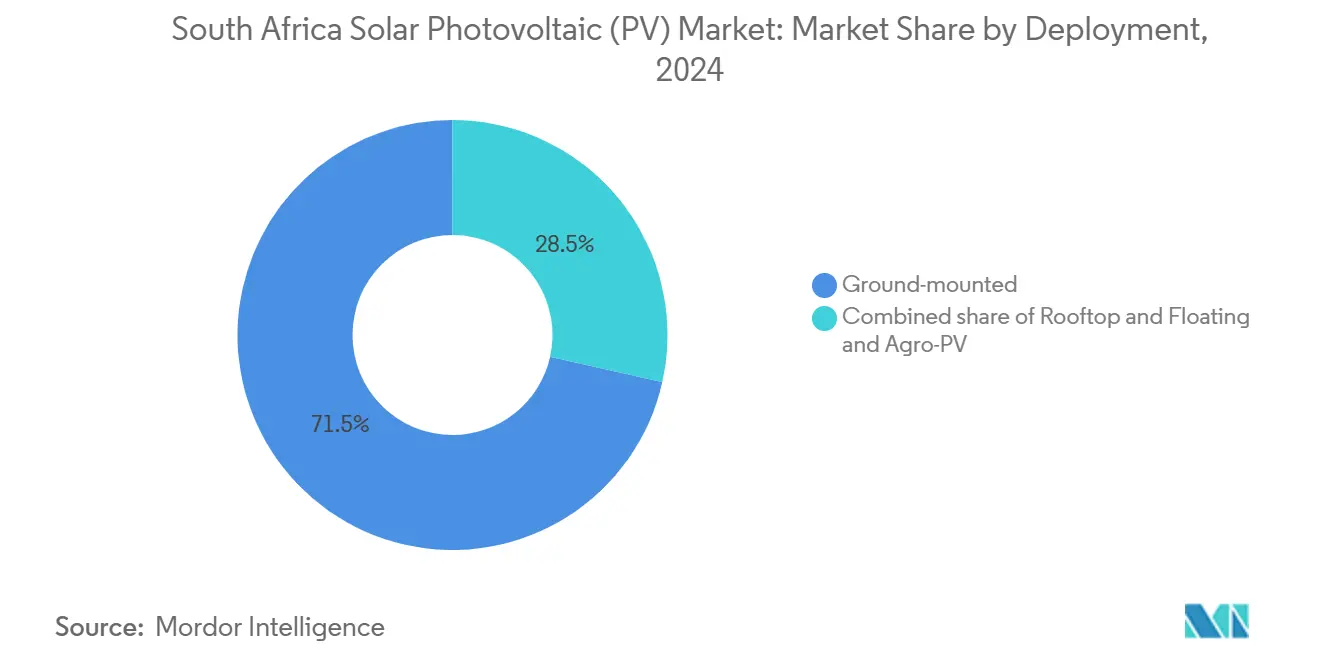
- By deployment, ground-mounted systems captured 71.5% revenue share in 2024; rooftop installations are advancing at a 16.4% CAGR to 2030.
- By end user, utility-scale IPPs accounted for 52.2% of the South Africa solar photovoltaic market size in 2024, while the residential segment exhibits the fastest trajectory at an 18.3% CAGR.
- LONGi, JinkoSolar, and Trina Solar together supplied roughly 70-75% of imported modules in 2024, indicating concentrated leverage in upstream components.
South Africa Solar Photovoltaic (PV) Market Trends and Insights
Drivers Impact Analysis*
| Driver | (~) % Impact on CAGR Forecast | Geographic Relevance | Impact Timeline |
|---|---|---|---|
| Declining solar PV module prices | +2.5% | National, strongest in Gauteng C&I and Northern Cape IPP zones | Short term (≤ 2 years) |
| Supportive government policies and REIPPPP reforms | +3.0% | Northern Cape, Western Cape, Free State corridors | Medium term (2-4 years) |
| Chronic load-shedding spurring C&I self-generation | +2.8% | Gauteng, Western Cape metros, KwaZulu-Natal industrial zones | Short term (≤ 2 years) |
| Green hydrogen value-chain pull for new solar capacity | +1.5% | Northern Cape, Western Cape, and Eastern Cape Coega SEZ clusters | Long term (≥ 4 years) |
| Mining sector decarbonization commitments | +1.2% | Limpopo, Mpumalanga, Northern Cape mining belts | Medium term (2-4 years) |
| Source: Mordor Intelligence | |||
Declining Solar PV Module Prices
Spot module prices fell to roughly USD 0.10/W by September 2024, 60% below early-2023 levels as Chinese suppliers faced a capacity overhang.[1]Bloomberg, “South Africa Rooftop Solar Installations Surge,” bloomberg.com Even after the 10% July 2024 tariff, imported crystalline-silicon panels remain 30-40% cheaper than domestic alternatives, compressing payback periods below four years in high-tariff municipalities. Developers are migrating toward bifacial TOPCon designs that reclaim margin through 10-15% energy-yield gains.[2]Financial Times, “Solar Tariff Local Content 2024,” ft.com Price deflation, therefore, simultaneously accelerates demand and intensifies competitive pressure.
Supportive Government Policies and REIPPPP Reforms
Bid Window 7 closed in December 2024 with 1.76 GW of solar awards, REIPPPP’s fastest cycle to date, and new rules now allow integrated battery storage within a single application. Streamlined environmental approvals shaved a year from typical permitting, and wheeling regulations enable IPPs to serve off-site offtakers such as mining majors. Standard Bank’s USD 140 million debt package for CrossBoundary’s C&I portfolio highlights renewed lender appetite. These reforms lower execution risk and improve revenue certainty for both utility-scale and distributed projects.
Chronic Load-Shedding Spurring C&I Self-Generation
Eskom imposed Stage 4-6 outages on more than 200 days in 2024, costing ZAR 80 billion in lost output. Large users now treat solar as core infrastructure: Teraco signed a 20-year PPA for 120 MW at tariffs below municipal rates. C&I systems of 1-5 MW paired with short-duration batteries regularly beat grid tariffs, delivering three-to-five-year paybacks. The migration erodes Eskom revenue, but it unlocks a robust private-procurement channel for solar EPCs and financiers.
Green Hydrogen Value-Chain Pull for New Solar Capacity
TotalEnergies and Mulilo inaugurated a 120 MW solar component within a hybrid complex powering Sasol and Air Liquide’s electrolyzers, establishing a template for future industrial offtake. South Africa’s Hydrogen Society projects 10-15 GW of dedicated renewables for export-oriented hydrogen by 2030, with Northern Cape and Western Cape ports favored for co-location. Although 24/7 supply requirements compel hybridization with wind and storage, solar still captures a majority share of daylight generation, embedding long-term demand beyond classic PPAs.
Restraints Impact Analysis*
| Restraint | (~) % Impact on CAGR Forecast | Geographic Relevance | Impact Timeline |
|---|---|---|---|
| Grid congestion and transmission bottlenecks | -1.8% | Northern Cape, Western Cape, and Free State renewable energy corridors | Medium term (2-4 years) |
| Rising competition from onshore wind projects | -0.8% | National, with wind concentration in Eastern Cape and Western Cape coastal zones | Long term (≥ 4 years) |
| Local content rules pushing up capex | -0.6% | National, affecting all REIPPPP and large-scale procurement | Short term (≤ 2 years) |
| Source: Mordor Intelligence | |||
Grid Congestion and Transmission Bottlenecks
Eskom's network requires ZAR 100 billion in upgrades, and 60-70% of new projects face curtailment or multi-year connection queues. Mid-day solar peaks saturate the Northern Cape-to-Gauteng corridor, forcing plants to ramp down and slashing revenues by as much as 20%. Private wheeling rules exist but lack consistent municipal implementation, delaying alternative evacuation paths. Until large-scale battery storage or new lines arrive, transmission will cap output in South Africa's solar photovoltaic market hotspots.
Rising Competition from Onshore Wind Projects
Wind delivers 35-45% capacity factors at USD 30-40/MWh, outperforming solar’s 25-30% in evening hours that align with Eskom’s demand curve. Developers such as Mainstream Renewable Power control 1.3 GW of prime Eastern Cape wind sites. Utility tenders that value system-wide benefits, therefore tilt procurement toward wind, forcing solar bidders to integrate storage or accept lower tariffs to stay competitive.
*Our forecasts treat driver/restraint impacts as directional, not additive. The impact forecasts reflect baseline growth, mix effects, and variable interactions.
Segment Analysis
By Type: Crystalline Silicon Dominance Faces Thin-Film Encroachment
Crystalline-silicon technology represented 92.1% of 2024 installations, underscoring its bankability and supply-chain depth. Within this category, TOPCon and heterojunction variants now exceed 25% efficiency, squeezing legacy multi-Si lines that few manufacturers keep active. Thin-film cadmium-telluride capacity is expanding at a 19.7% CAGR through 2030, riding superior temperature coefficients in Northern Cape's 40-45 °C summer highs. First Solar's Series 7 panels yield 8-10% more annual energy in desert climates, offsetting their larger land requirement.[3]First Solar, “Series 7 Modules,” firstsolar.com Consequently, developers weighing lifetime yield over capex are piloting thin-film at utility scale, while rooftops still prioritize crystalline-silicon's higher power density.
Crystalline suppliers defend share with bifacial TOPCon modules that harvest ground albedo for 10-15% output gains, narrowing thin-film's advantage. Falling polysilicon prices also sustain mono-Si cost leadership, maintaining crystalline-silicon's head start in South Africa's solar photovoltaic market supply contracts. Yet as tariffs push developers to local assembly, thin-film's simpler bill-of-materials could attract domestic investors seeking differentiated manufacturing niches.


By Grid Type: On-Grid Dominance with Off-Grid Acceleration
On-grid systems held 93.9% of the South Africa solar photovoltaic market share in 2024, reflecting grid reach to roughly 85-90% of the population and REIPPPP rules that mandate grid connection for projects above 1 MW. While on-grid volume dwarfs alternatives, off-grid deployments are forecast to grow at 15.2% CAGR to 2030 as 2-3 million rural households in Eastern Cape, Limpopo, and KwaZulu-Natal seek relief from diesel costs of ZAR 4-6/kWh (USD 0.22-0.33/kWh). The on-grid segment also benefits from municipal net-metering in Cape Town, Johannesburg, and eThekwini, which lets residential and C&I users monetize surplus power, reinforcing the baseline dominance of grid-tied assets. Yet chronic load-shedding is reshaping behavior: roughly 60-70% of new on-grid homes and businesses in 2024 installed 5-15 kWh batteries to “island” during outages, effectively creating hybrid systems that toggle between grid-tied and standalone modes.
Off-grid growth springs from a low base but taps unmet demand. Eskom deferred ZAR 15-20 billion in rural electrification, creating a service vacuum that solar home systems and mini-grids now fill. The 2024 mini-grid licensing framework shrank approval timelines to 6-9 months, catalyzing private capital and enabling investors such as GuarantCo, whose USD 27 million guarantee unlocked USD 270 million for mini-grids targeting 150,000 homes by 2027. Off-grid telecom retrofits provide an additional USD 80-100 million addressable pool as MTN and Vodacom replace diesel at 3,000-4,000 towers with 5-10 kW solar and 15-20 kWh storage, cutting operating costs up to 50%. Payment collection remains a hurdle; South Africa’s 30-35% mobile-money penetration trails East Africa’s 70-80%, forcing providers to rely on cash and inflating overheads. Meanwhile, lithium-ion prices fell to USD 120-150/kWh in 2024, so adding islanding capability now raises an on-grid bill by only 15-20%, making resilience an affordable insurance policy for commercial and high-income users.
By Deployment: Ground-Mounted Scale Versus Rooftop Agility
Ground-mounted arrays supplied 71.5% of the 2024 volume, leveraging USD 0.60-0.80/W capex and vast Northern Cape land banks. Yet rooftop installations are growing 16.4% annually and bypass transmission constraints entirely. Gauteng malls and office parks favor 500 kW-2 MW carport systems that double as shaded parking, while Western Cape suburbs adopt 5-8 kW household rigs. Floating installations on mine-tailings dams and agro-PV pilots in vineyards remain niche but showcase dual-use potential that could unlock new acreage as land prices rise.
Ground-mount developers must navigate communal land consultations lasting up to a year, and curtailment risk undermines revenue as grid saturation bites. Rooftop projects avoid these hurdles, explaining their outsized share of new connection approvals despite smaller average capacity.
By End User: Utility-Scale IPPs Lead, Residential Surges
Utility-scale IPPs accounted for 52.2% of demand in 2024, benefiting from REIPPPP’s long-dated PPAs that underpin bank financing. However, the residential segment is forecast to expand at an 18.3% CAGR on the back of leasing models that remove capital barriers and net-metering schemes in Cape Town and Johannesburg. Nearly 1 million homes already host panels, yet that equates to just 5.9% of South Africa’s 17 million households, leaving ample runway. The commercial and industrial category straddles these dynamics: Teraco’s 120 MW data-center procurement and Glencore’s 100 MW mining project highlight how corporate decarbonization and cost hedging converge to favor on-site solar.
Margins diverge widely. Residential installers bundle 5-10 kWh batteries in roughly two-thirds of new systems to ride out evening outages, while utility projects wrestle with three-to-five-year grid connection delays. Nevertheless, both poles of the South Africa solar photovoltaic market share common momentum: distrust of central supply and appetite for cheaper, cleaner electrons.
Geography Analysis
Northern Cape held just over half of the installed capacity in 2024, thanks to >2,200 kWh/m²/year irradiation and existing substations like Hydra that simplify interconnection. Transmission saturation, however, forces midday curtailment and prompts hybrid solar-plus-storage designs to shift dispatch into evening peaks. Western Cape follows, supported by Cape Town’s aggressive net-metering and the port of Saldanha’s green-hydrogen ambitions. Eastern Cape’s Coega SEZ adds industrial offtake and hybrid wind-solar potential, while its coastal sites deliver higher load factors when paired with batteries.
Gauteng leads rooftop demand despite lower irradiation, because Johannesburg-Pretoria businesses value resilience over pure yield. KwaZulu-Natal’s Richards Bay industries pursue 50-100 MW arrays to sidestep carbon-border tariffs on exports, although cloud cover trims output. Free State is emerging as a data-center hub with ample farmland for large single-axis projects. Limpopo and Mpumalanga mines piloted 20-50 MW arrays in 2024 as part of coal-to-renewable transition schemes, potentially opening 2-3 GW of redevelopment by 2035. North-West lags on sparse load centers and limited grid-spine infrastructure.[4]Department of Mineral Resources and Energy, “Provincial Renewable Energy Potential 2024,” dmre.gov.za
Growth dynamics thus split along provincial lines: Northern Cape remains the volume leader; Gauteng and Western Cape post the fastest percentage gains in distributed capacity; and Mpumalanga’s repowering story could surge if remediation hurdles ease.
Competitive Landscape
The South Africa solar photovoltaic market is moderately concentrated. Eight developers won Bid Window 7 awards, yet Pele Green Energy alone secured six projects, signaling early consolidation. Chinese suppliers LONGi, JinkoSolar, and Trina Solar furnished about 70-75% of imported modules, supported by TOPCon releases that top 25% conversion efficiency. Meanwhile, Canadian Solar’s Cape Town assembly unit combines local-content credits with global supply chains, raising barriers for purely domestic entrants.
Strategically, utility IPPs pivot to co-locating 2-4 hour batteries to capture evening peak tariffs and mitigate curtailment, mirroring trends in BESIPPPP Window 2. Residential and C&I installers compete on zero-down financing, resulting in brisk customer acquisition but thinner hardware margins. Disruptors such as Huawei and Solis chip away at SMA’s inverter share by underpricing while maintaining 98.8% efficiencies.[5]Engineering News, “Huawei Solis Inverters South Africa Market Share,” engineeringnews.co.za Off-grid micro-grids for rural Limpopo and Eastern Cape remain a USD 500 million white-space, yet payment-collection risk hampers scale.
Overall, the top five IPPs hold roughly 45-50% of utility-scale capacity, while three Chinese brands dominate modules. Equipment price compression prevents heavyweight incumbents from erecting insurmountable walls, keeping room for agile financiers and EPCs.
South Africa Solar Photovoltaic (PV) Industry Leaders
Scatec ASA
Enel Green Power South Africa
ACWA Power
SOLA Group
Mulilo Renewable Energy
- *Disclaimer: Major Players sorted in no particular order

Recent Industry Developments
- December 2024: DMRE awarded 1.76 GW of solar across eight Bid Window 7 projects valued at ZAR 31.4 billion (USD 1.7 billion).
- November 2024: TotalEnergies and partners commissioned 120 MW of solar within a 260 MW hybrid complex for Sasol’s green-hydrogen facility.
- October 2024: Teraco inked a 120 MW solar PPA in the Free State to power its data-center fleet.
- September 2024: Standard Bank financed USD 140 million for CrossBoundary’s 85 MW C&I portfolio.
- August 2024: Ener-G-Africa expanded its Paarl module line to 200 MW capacity.


South Africa Solar Photovoltaic (PV) Market Report Scope
The South Africa solar photovoltaic (PV) market report includes:
| Crystalline Silicon (mono-Si, multi-Si) |
| Thin-film (CdTe, a-Si, CIGS) |
| Heterojunction (HJT) and TOPCon |
| On-Grid |
| Off-Grid |
| Ground-mounted |
| Rooftop |
| Floating and Agro-PV |
| Utility-Scale |
| Commercial and Industrial (C&I) |
| Residential |
| Solar Modules/Panels |
| Inverters (String, Central, Micro) |
| Mounting and Tracking Systems |
| Balance-of-System and Electricals |
| Energy Storage and Hybrid Integration |
| By Type | Crystalline Silicon (mono-Si, multi-Si) |
| Thin-film (CdTe, a-Si, CIGS) | |
| Heterojunction (HJT) and TOPCon | |
| By Grid Type | On-Grid |
| Off-Grid | |
| By Deployment | Ground-mounted |
| Rooftop | |
| Floating and Agro-PV | |
| By End User | Utility-Scale |
| Commercial and Industrial (C&I) | |
| Residential | |
| By Component (Qualitative Analysis) | Solar Modules/Panels |
| Inverters (String, Central, Micro) | |
| Mounting and Tracking Systems | |
| Balance-of-System and Electricals | |
| Energy Storage and Hybrid Integration |


Key Questions Answered in the Report
What is the current installed capacity of the South Africa solar photovoltaic market?
Installed capacity reached 8.15 GW in 2025 and is forecast to exceed 14 GW by 2030.
How fast is rooftop adoption growing in South Africa?
Rooftop systems are expanding at a 16.4% CAGR, with about 1 million households already equipped with panels.
Which technology leads the South Africa solar photovoltaic market share?
Crystalline-silicon modules held 92.1% share in 2024, but thin-film cadmium-telluride is gaining traction in hot regions.
What are the main barriers to new utility-scale solar projects?
Grid congestion in Northern Cape corridors and a multi-year queue for connection are the primary bottlenecks.
How do falling module prices affect project economics?
Module costs near USD 0.10/W push payback periods below four years for many C&I and residential installations, even after tariffs.
Page last updated on:


