South Africa Global Capability Centers Market Size and Share
Market Overview
| Study Period | 2020 - 2031 |
|---|---|
| Forecast Data Period | 2026 - 2031 |
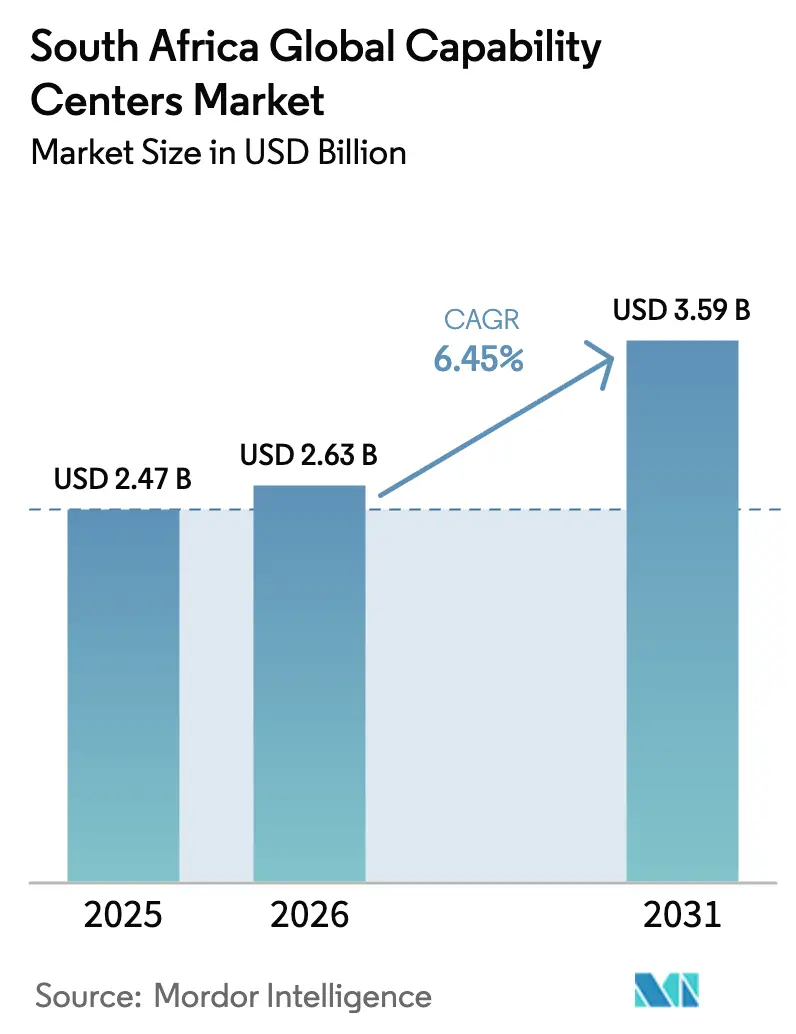
| Base Year Market Size (2025) | USD 2.47 Billion |
| Market Size (2026) | USD 2.63 Billion |
| Market Size (2031) | USD 3.59 Billion |
| Growth Rate (2026 - 2031) | 6.45% CAGR |
| Market Concentration | Medium |
Major Players *Disclaimer: Major Players sorted in no particular order Image © Mordor Intelligence. Reuse requires attribution under CC BY 4.0. | |
South Africa Global Capability Centers Market Analysis by Mordor Intelligence
The South Africa Global Capability Center market size was valued at USD 2.47 billion in 2025 and estimated to grow from USD 2.63 billion in 2026 to reach USD 3.59 billion by 2031, at a CAGR of 6.45% during the forecast period (2026-2031). The steady advance is driven by a 55-65% operating-cost gap compared to traditional hubs, a further 7-10% cost reduction within Special Economic Zone locations, and expanding undersea cable capacity that reduces latency to Europe by 35% and to the Asia Pacific by 28%. Rising cloud and AI investments, most notably Microsoft’s USD 1 billion commitment, and provincial incentives that drop corporate tax to 15% for qualifying projects, reinforce the appeal of the South Africa Global Capability Center market.[1]Microsoft South Africa, “Microsoft Announces USD 1 Billion Investment in South Africa,” microsoft.com Multilingual talent pools serving 70+ languages, time-zone alignment with Europe, and an improving power-grid outlook also underpin growth, even as intermittent power supply, higher energy tariffs, and acute shortages of senior ER&D architects temper expansion.
Key Report Takeaways
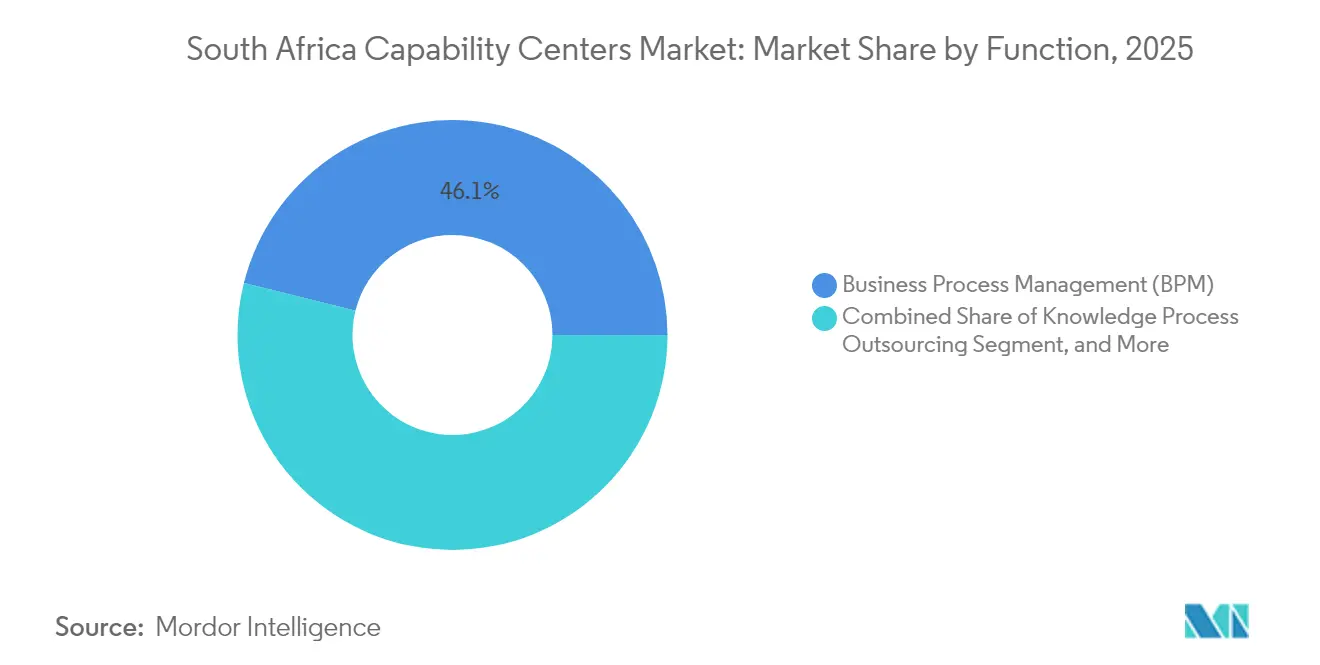
- By function/capability, Business Process Management led with 46.12% revenue share in 2025; Information Technology and Digital Services are projected to expand at a 6.78% CAGR through 2031.
- By engagement model, the captive in-house model held 58.25% share of the South Africa Global Capability Center market in 2025, while the hybrid Build-Operate-Transfer structure is forecast to record a 7.31% CAGR through 2031.
- By organization size, large enterprises commanded 75.95% share of the South Africa Global Capability Center market size in 2025, and the SME segment is projected to advance at an 7.95% CAGR to 2031.
- By industry vertical, telecom and IT led with a 33.12% revenue share in 2025; banking, financial services, and insurance are expected to advance at a 6.95% CAGR through 2031.
Note: Market size and forecast figures in this report are generated using Mordor Intelligence’s proprietary estimation framework, updated with the latest available data and insights as of 2026.
South Africa Global Capability Centers Market Trends and Insights
Drivers Impact Analysis*
| Driver | (~) % Impact on CAGR Forecast | Geographic Relevance | Impact Timeline |
|---|---|---|---|
| Rapid growth of digital transformation initiatives among South African corporates | +1.2% | National, with concentrations in Johannesburg, Cape Town, and Durban | Medium term (2-4 years) |
| Government's Special Economic Zone incentives for technology parks | +0.9% | Gauteng, Western Cape, KwaZulu-Natal SEZ zones | Long term (≥ 4 years) |
| Expanding undersea cable capacity, lowering latency to Europe and the Asia Pacific | +1.1% | Coastal regions with spillover to inland hubs | Short term (≤ 2 years) |
| Cost arbitrage versus mature Global Capability Center destinations | +1.4% | Global, with primary benefits in Johannesburg, Cape Town metropolitan areas | Medium term (2-4 years) |
| Availability of multilingual talent for EMEA service coverage | +0.8% | National, concentrated in urban centers | Long term (≥ 4 years) |
| Rising venture capital funding into enterprise tech start-ups, enabling Global Capability Center partnerships | +0.6% | Johannesburg, Cape Town innovation ecosystems | Medium term (2-4 years) |
| Source: Mordor Intelligence | |||
Rapid Digital-Transformation Spending Among Corporations
South African enterprises increased digital transformation outlays by 23% in 2024, and 78% of large companies listed cloud migration and AI adoption among their top three strategic goals.[2]South African Reserve Bank, “Quarterly Bulletin Q3 2024,” resbank.co.za Because the South Africa Global Capability Center market offers near-time-zone service to Europe, these firms channel analytics, cybersecurity, and automation programs into local centers for 24-hour coverage. The Digital Skills Development Program, jointly run with Microsoft and Amazon Web Services, aims to target 50,000 graduates by 2026 and facilitate future capacity expansion. Strong data-privacy enforcement under the Protection of Personal Information Act widens demand for governance and risk services, pushing higher-value knowledge work into Global Capability Center portfolios.
Government Special Economic Zone Incentives
Revisions in 2024 granted 100% tax deductions on eligible technology infrastructure and cut work-permit processing from eight months to six weeks. Corporate tax rates can drop to 15% for the first five years once a center crosses 100 employees. Dube TradePort and Atlantis zones expanded the Global Capability Center's headcount by 34% in 2024 and now offer pre-certified ISO 27001 pathways, reducing compliance timelines for risk-sensitive industries. As a result, the South Africa Global Capability Center market sees an influx of high-value functions such as automotive engineering design and AI model development.
Expanding Under-Sea Cable Capacity
The 2Africa and Equiano systems increased national and international bandwidth capacity by 180 Tbps, reducing round-trip latency to London to 165 ms and to Singapore to 245 ms.[3]Google Cloud, “Equiano Cable Operational Update,” cloud.google.com Real-time collaboration enables engineering simulations, high-frequency trading platforms, and live financial-risk analytics, workloads that previously required co-location in Europe. Lower data-transfer costs, down 25% for enterprise customers, further widen margins inside the South Africa Global Capability Center market.
Cost Arbitrage Versus Mature Global Capability Center Destinations
Skilled labor costs remain 30-40% lower than those in Poland and the Czech Republic, and 55-65% lower than in cities such as Dallas, Manchester, or Sydney. Meanwhile, real estate rents average USD 12-18 per m² in prime Johannesburg and Cape Town corridors. SEZ abatements shave another 7-10% off the total cost of ownership, giving the South Africa Global Capability Center a decisive edge for routine BPM tasks and, increasingly, for complex knowledge processes that carry higher wage components.
Restraints Impact Analysis*
| Restraint | (~) % Impact on CAGR Forecast | Geographic Relevance | Impact Timeline |
|---|---|---|---|
| Intermittent power supply and elevated energy costs | -1.8% | National, with a severe impact in Gauteng, KwaZulu-Natal | Short term (≤ 2 years) |
| Scarcity of senior ER&D architects for deep-tech programs | -1.2% | National, concentrated in technical hubs | Long term (≥ 4 years) |
| Rigid labour regulations are increasing time-to-hire for large headcounts | -0.9% | National, with administrative burden in major cities | Medium term (2-4 years) |
| Heightened cybersecurity concerns amid rising ransomware incidents | -0.7% | National, with a focus on financial services centers | Medium term (2-4 years) |
| Source: Mordor Intelligence | |||
Intermittent Power Supply and Elevated Energy Costs
Load-shedding incidents decreased by 40% year-over-year in 2024, yet still affected 60% of businesses, prompting investments in backup power ranging from USD 50,000 to USD 200,000 per facility.[4]Eskom Holdings, “Load-Shedding Performance Report 2024,” eskom.co.za Tariffs climbed 18.65% in 2024, adding USD 0.08-0.12 per kWh and compressing margins for data-intensive functions. Operators such as Amazon and Microsoft counter the risk by investing in utility-scale solar projects and are taking advantage of 2024 regulations that allow for up to 100 MW of self-generation without requiring a license.
Scarcity of Senior ER&D Architects
Only 2,400 professionals hold advanced credentials in embedded systems or semiconductor design, while demand for 4,200 roles is expected by 2026. Graduate programs at the University of the Witwatersrand and the University of Cape Town release just 150-200 qualified specialists annually, forcing firms to court expatriate talent. Visa processing has improved; however, salary premiums in the United States and Western Europe exceed South African offers by 40-60%, thereby sustaining the talent gap.
*Our forecasts treat driver/restraint impacts as directional, not additive. The impact forecasts reflect baseline growth, mix effects, and variable interactions.
Segment Analysis
By Function / Capability: BPM Remains Anchor While Digital Gains Speed
Business Process Management contributed 46.12% of the 2025 revenue for the South African Global Capability Center market and maintained a healthy 5.11% CAGR over the 2020-2025 period. Banking expertise, mature contact-center infrastructure, and robust compliance credentials draw L1-L3 finance and accounting, customer service, and claims-processing work. Information Technology and Digital Services gained momentum as cloud adoption accelerated, boosting its growth rate to 6.78% from 2026 to 2031. Microsoft’s USD 1 billion AI program and Amazon’s expanded Cape Town development center are channeling high-value AI, DevOps, and cybersecurity roles into the country, signaling that digital functions will capture a larger share of the South Africa Global Capability Center market by the end of the decade.
Engineering, ER&D account for an estimated 17.60% share yet face the talent constraint noted earlier. Investments by BMW, Mercedes-Benz, and Ford focus on electric and autonomous platforms, driving demand for model-based systems engineering and battery-management software. Knowledge Process Outsourcing (KPO) holds a 12.30% share, driven by regulatory sandbox programs at the South African Reserve Bank that shift fintech, regtech, and risk analytics workloads to local centers. As more clients bundle transaction-heavy BPM with analytics and AI, cross-function synergies are likely to unlock further margin expansion across the South Africa Global Capability Center market.


By Engagement Model: Captive Dominance, Hybrid Momentum
Captive centers commanded 58.25% of revenues in 2025 because data-sovereignty rules in banking, telecom, and public-sector verticals favor direct ownership. Average seat counts exceed 450 and encompass multi-function setups integrating BPM, IT support, and compliance teams. Hybrid Build-Operate-Transfer structures are growing at the fastest rate, with a 7.31% CAGR, as companies balance risk control with capital agility by handing over early-stage build-out to third-party specialists and then absorbing operations at maturity.
Standard Bank’s digital-banking hub, developed in collaboration with Accenture, exemplifies a hybrid approach that reduced launch times by nine months while maintaining ownership of intellectual property. Traditional BOT models capture a 21.70% share and appeal mainly to mid-market firms seeking cost-efficient entry points without long-term fixed assets. Regulatory obligations under the Protection of Personal Information Act continue to tilt critical data-handling functions toward captive and hybrid formats, implying that the South Africa Global Capability Center market will sustain a dual-track model mix.
By Organization Size: Enterprise Scale Meets SME Democratization
Large enterprises accounted for 75.95% of the demand in 2025. Their capital heft supports end-to-end facilities with disaster recovery sites, layered cyber defense, and ISO 27001 certification. Set-up investments range between USD 2 million and USD 5 million, yet per-seat costs remain 55-65% lower than in Western Europe.
The SME segment, although smaller, is advancing at an 7.95% CAGR, powered by cloud-native platforms and shared workspaces that cut entry costs to USD 50,000. Government programs, such as the Small Enterprise Development Agency’s Global Capability Center readiness fund, supply grants and advisory services, thereby widening access. Over the forecast horizon, the SME cohort is expected to broaden sector coverage beyond customer support into compliance services and niche analytics, adding depth to the South Africa Global Capability Center market.

By Industry Vertical: Telecom Leads, BFSI Rises
Telecom and IT together deliver 33.12% of market revenue. Vodacom’s nationwide 5G and MTN’s fiber rollout create sustained demand for network operations centers, customer experience hubs, and OSS/BSS support. Banking, financial services, and insurance are poised for a 6.95% CAGR as regulatory reporting, KYC, and digital-banking workload migrate into Global Capability Centers.
Standard Bank’s USD 100 million fintech fund and Nedbank’s digital banking overhaul exemplify how capital outlays translate into demand for shared services. The manufacturing and automotive industries are centered around BMW’s Rosslyn EV engineering center and Toyota’s distribution hub, with a focus on engineering, research, and development (ER&D), as well as supply-chain orchestration. The healthcare and life sciences sectors are experiencing growth through Discovery Health’s AI diagnostics and Clicks Group’s digital pharmacy network. Retail and consumer goods leverage the South Africa Global Capability Center market for e-commerce support, last-mile logistics planning, and consumer analytics that span 15 African countries.
Geography Analysis
Johannesburg and Cape Town accounted for 67.30% of the South African Global Capability Center market in 2025, driven by robust fiber backbones, multilingual labor pools, and proximity to OR Tambo International Airport and Cape Town International Airport. Gauteng hosts the most financial services Global Capability Centers due to its proximity to the Johannesburg Stock Exchange, well-developed corporate campuses, and established regulatory relationships. Western Cape dominates digital and cloud workloads thanks to Amazon’s and Google’s research clusters, university partnerships, and the direct landings of Equiano and 2Africa cables.
KwaZulu-Natal emerges as a growing automotive and manufacturing node powered by Dube TradePort SEZ incentives, Toyota’s parts hub, and a burgeoning supplier ecosystem near Durban harbor. The Eastern Cape, anchored by Port Elizabeth, benefits from Ford’s and Volkswagen’s assembly operations, focusing on engineering, research, and development (ER&D), as well as supply-chain support for automotive clients. Inland provinces offer real estate savings of 35-45% compared to coastal metros; however, they rely on redundant connectivity via Teraco’s Johannesburg campus to mitigate latency drawbacks.
Historical data indicate that Western Cape Global Capability Center employment is projected to scale at a rate of 26.80% annually from 2020 to 2025, compared to Gauteng’s mature yet solid 17.60% pace. Provincial programs differ: The Western Cape grants fast-track permits and tech-skills vouchers, while Gauteng emphasizes SEZ tax offsets and commuter rail expansion to widen labor catchments. National infrastructure plans totaling ZAR 400 billion by 2030 prioritize power grid upgrades and highway expansions, gradually leveling regional cost and reliability disparities within the South African Global Capability Center market.
Competitive Landscape
The South African Global Capability Center market exhibits a moderate concentration, with the five largest operators holding approximately 35% of the revenue, leaving room for niche specialists. Domestic financial institutions, including Standard Bank, FirstRand, and ABSA, retain leadership through their entrenched BPM and compliance centers. Global cloud providers, notably Microsoft, Amazon, and Google, inject more than USD 4 billion in combined capital that accelerates AI, analytics, and ER&D work placements. Teraco’s USD 2.8 billion Johannesburg campus expansion provides 40 MW of carrier-neutral capacity with 99.99% uptime guarantees, attracting latency-sensitive workloads.
Strategic behaviors increasingly favor hybrid engagement models. Standard Bank’s co-build with Accenture cut roll-out risk while preserving data oversight. Discovery Health’s Azure-based analytics suite slashed claim-processing times by 60% and allowed the insurer to redeploy staff toward higher-value clinical reviews. Emerging disruptors, such as Synthesis Software Technologies, utilize cloud-native tooling and agile delivery to undercut traditional rates by 20-25%, while maintaining ISO 27001 compliance.
White-space opportunities lie in quantum-computing research, advanced manufacturing automation, and region-specific regulatory compliance. The country’s unique blend of emerging-market cost structures and developed-economy governance positions the South Africa Global Capability Center market as the preferred node for pan-African service orchestration. Ongoing power-generation partnerships and solar projects aim to reduce long-run energy costs by 30-40%, thereby strengthening cost competitiveness against India and Eastern Europe.
South Africa Global Capability Centers Industry Leaders
Amazon Development Centre South Africa (Amazon.com Inc.)
Google South Africa (Alphabet Inc.)
Microsoft South Africa (Microsoft Corporation)
Accenture South Africa (Accenture plc)
IBM South Africa (International Business Machines Corporation)
- *Disclaimer: Major Players sorted in no particular order


Recent Industry Developments
- October 2025: The South African government introduced a 150% tax deduction incentive for manufacturers that invest in electric- or hydrogen-vehicle production assets, effective March 2026. Paired with the ZAR 1 billion Industrial Development Support Programme, the policy is forecast to unlock ZAR 30 billion (USD 1.6 billion) of private automotive manufacturing investment and position the country to secure next-generation GCC functions in battery engineering, power-train development, and vehicle electrification research.
- March 2025: Microsoft committed ZAR 5.4 billion (USD 297 million) to expand cloud and AI infrastructure through 2027. The plan adds a second cloud region in Centurion and funds 50,000 youth certifications in AI, data science, cybersecurity analysis, and cloud solution architecture, tackling South Africa’s GCC talent pipeline constraints.
- March 2025: Google opened its first African cloud region in Johannesburg with a ZAR 2.5 billion (USD 137 million) investment. The site reduces latency for African users, is projected to add USD 2.1 billion to the national GDP, and could create 40,000 jobs by 2030, thereby strengthening South Africa’s appeal for cloud-native GCC operations.
- March 2025: Business Process Enabling South Africa released an updated National Value Proposition showing sector employment growth from 65,000 in 2019 to 150,000 in 2024, with revenue rising from USD 1.04 billion to USD 2.91 billion. The roadmap aims to create 500,000 cumulative jobs by 2030 and offers a 55-65% cost advantage over Dallas, Manchester, and Sydney, with a potential additional 7-10% reduction through government incentives.


South Africa Global Capability Centers Market Report Scope
The scope of the global capability center study for the market segmentation by the Function/Capability for (i) Information Technology (IT) and Digital Services segment is limited to Software Development, Cloud and Infrastructure Management, Cybersecurity, Data Analytics and AI/ML; (ii) Engineering / ER&D segment is limited to Product Design and Testing, Embedded Systems, Digital Twin / Simulation; (iii) Business Process Management (BPM) segment is limited to Finance and Accounting, HR, Payroll and Talent Management, Procurement, Customer Service; and (iv)Knowledge Process Outsourcing (KPO) segment is limited to Market Research and Insights, Risk and Compliance, Legal and Regulatory Support, Strategy and Consulting Support. Similarly, for segmentation by the Engagement Model, scope for (i) Hybrid Build-Operate-Transfer (BOT) is limited to Joint Venture / Strategic Partnership and Virtual Captive Model. The rest of the segment scope is as specified for the listed segment.
| Information Technology (IT) and Digital Services |
| Engineering / ER&D |
| Business Process Management (BPM) |
| Knowledge Process Outsourcing (KPO) |
| Captive (Self-Build)/ In-house |
| Build-Operate-Transfer (BOT) |
| Hybrid Build-Operate-Transfer (BOT) |
| Large Enterprises |
| Small and Medium Enterprises (SMEs) |
| Banking, Financial Services, and Insurance (BFSI) |
| Telecom and IT |
| Healthcare and Life Sciences |
| Manufacturing, Automotive and Industrial |
| Retail and Consumer Goods |
| Other Industry Verticals |
| By Function / Capability | Information Technology (IT) and Digital Services |
| Engineering / ER&D | |
| Business Process Management (BPM) | |
| Knowledge Process Outsourcing (KPO) | |
| By Engagement Model | Captive (Self-Build)/ In-house |
| Build-Operate-Transfer (BOT) | |
| Hybrid Build-Operate-Transfer (BOT) | |
| By Organization Size | Large Enterprises |
| Small and Medium Enterprises (SMEs) | |
| By Industry Vertical | Banking, Financial Services, and Insurance (BFSI) |
| Telecom and IT | |
| Healthcare and Life Sciences | |
| Manufacturing, Automotive and Industrial | |
| Retail and Consumer Goods | |
| Other Industry Verticals |


Key Questions Answered in the Report
How large is the South Africa Global Capability Center market in 2026?
The South African Global Capability Center market size is expected to reach USD 2.63 billion by 2026 and is projected to grow to USD 3.59 billion by 2031.
What is the expected growth rate for Global Capability Center activity in South Africa?
Aggregate revenue is forecast to expand at a 6.45% CAGR between 2026 and 2031.
Which functional area currently dominates operations at the Global Capability Center in the country?
Business Process Management holds the highest share in 2025 at 46.12%, leveraging deep financial services expertise.
Which engagement model is growing fastest?
The hybrid Build-Operate-Transfer structure shows the strongest momentum with a projected 7.31% CAGR through 2031.
How are power-supply issues being addressed by Global Capability Center operators?
Major operators invest in solar farms and backup generators, and 2024 rules now allow self-generation up to 100 MW without licenses, mitigating reliability concerns.
Page last updated on:


