South Africa Data Center Construction Market Size and Share
Market Overview
| Study Period | 2020 - 2031 |
|---|---|
| Forecast Data Period | 2026 - 2031 |
| Historical Data Period | 2020 - 2024 |
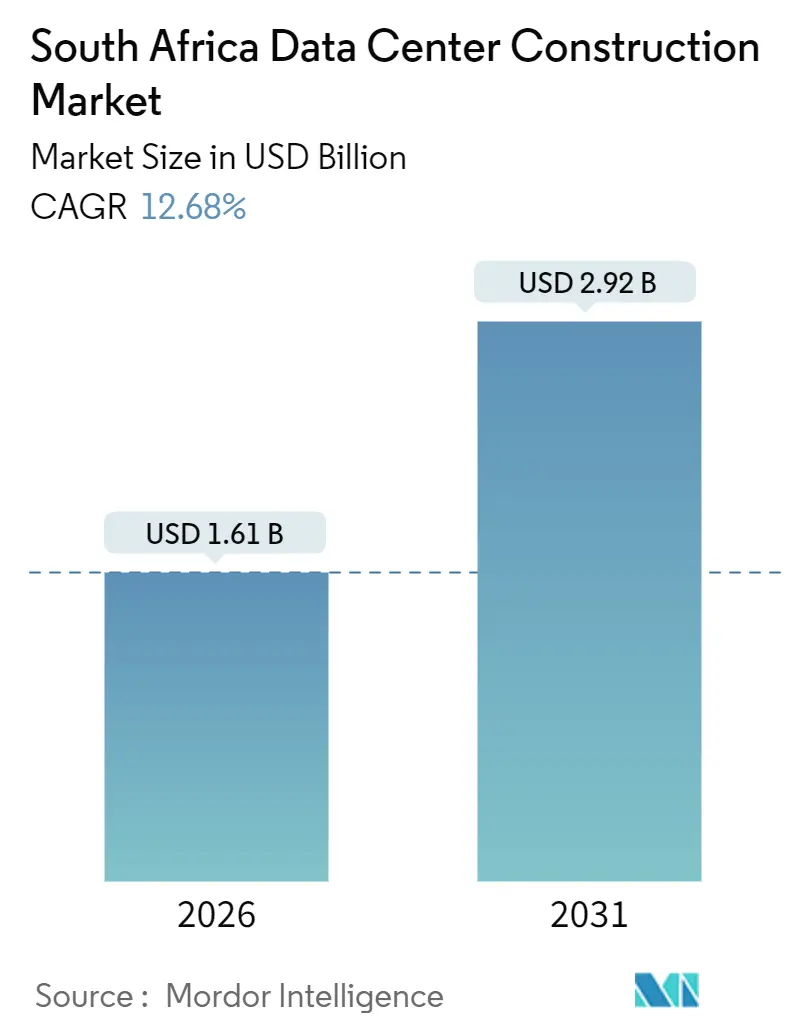
| Market Size (2026) | USD 1.61 Billion |
| Market Size (2031) | USD 2.92 Billion |
| Growth Rate (2026 - 2031) | 12.68% CAGR |
| Market Concentration | Medium |
Major Players *Disclaimer: Major Players sorted in no particular order Image © Mordor Intelligence. Reuse requires attribution under CC BY 4.0. | |
South Africa Data Center Construction Market Analysis by Mordor Intelligence
The South Africa data center construction market size stood at USD 1.61 billion in 2026 and is projected to reach USD 2.92 billion by 2031, expanding at a 12.68% CAGR throughout the forecast period, underscoring the structural pivot toward locally hosted cloud and colocation capacity. Enterprise migration to in-country platforms is accelerating as submarine-cable bandwidth, on-site renewables, and modular cooling mitigate the twin bottlenecks of Eskom grid instability and lingering latency to European hubs. Capital formation remains brisk, hyperscalers now pre-build Tier 4 campuses able to host 40-megawatt pods, while incumbent colocation operators retrofit legacy halls for 50-kilowatt liquid-cooled racks. Competition is intensifying around fiber diversity, renewable power purchase agreements, and sovereign-cloud compliance mandates that lock regulated workloads inside national borders. Meanwhile, inflation in steel, cement, and imported mechanical equipment is forcing staggered project phasing, even as operators hedge currency risk to protect margins in the South Africa data center construction market.
Key Report Takeaways
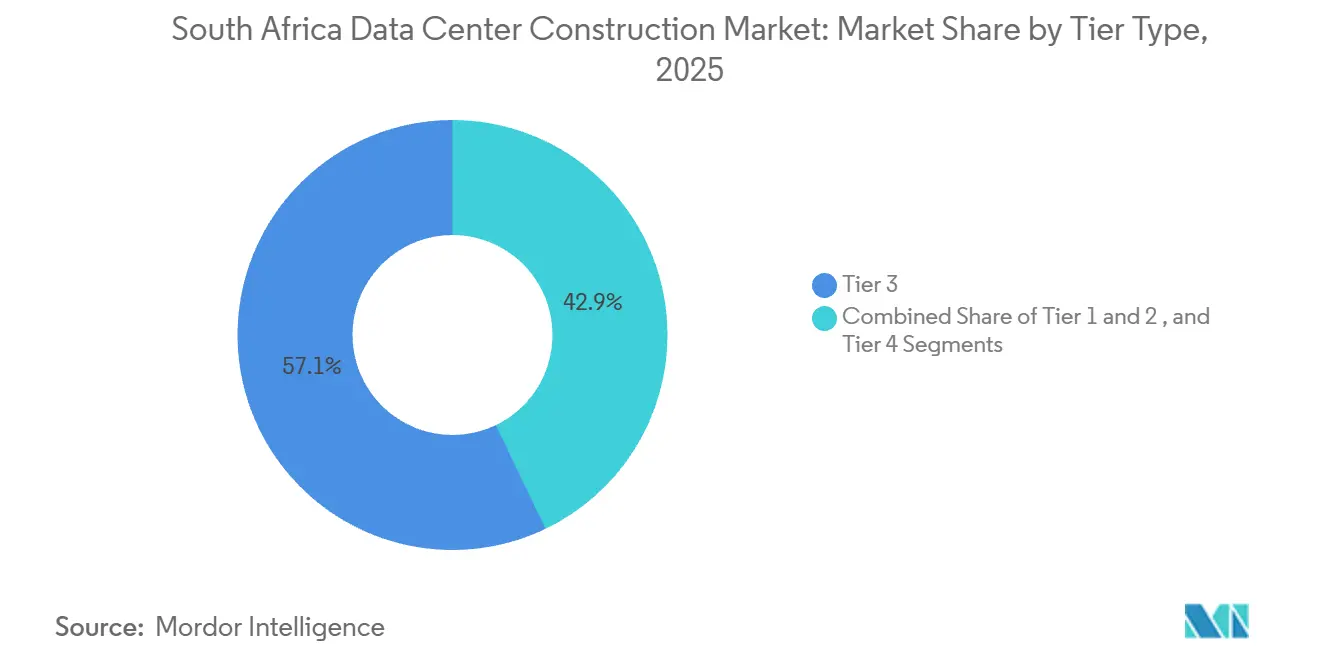
- By tier classification, Tier 3 facilities held 57.13% of the South Africa data center construction market share in 2025, whereas Tier 4 deployments are expanding at a 13.41% CAGR to 2031.
- By data center size, large segment accounted for 50.45% of the South Africa data center construction market size in 2025 and hyperscale advancing at a 13.62% CAGR as AI inference workloads scale.
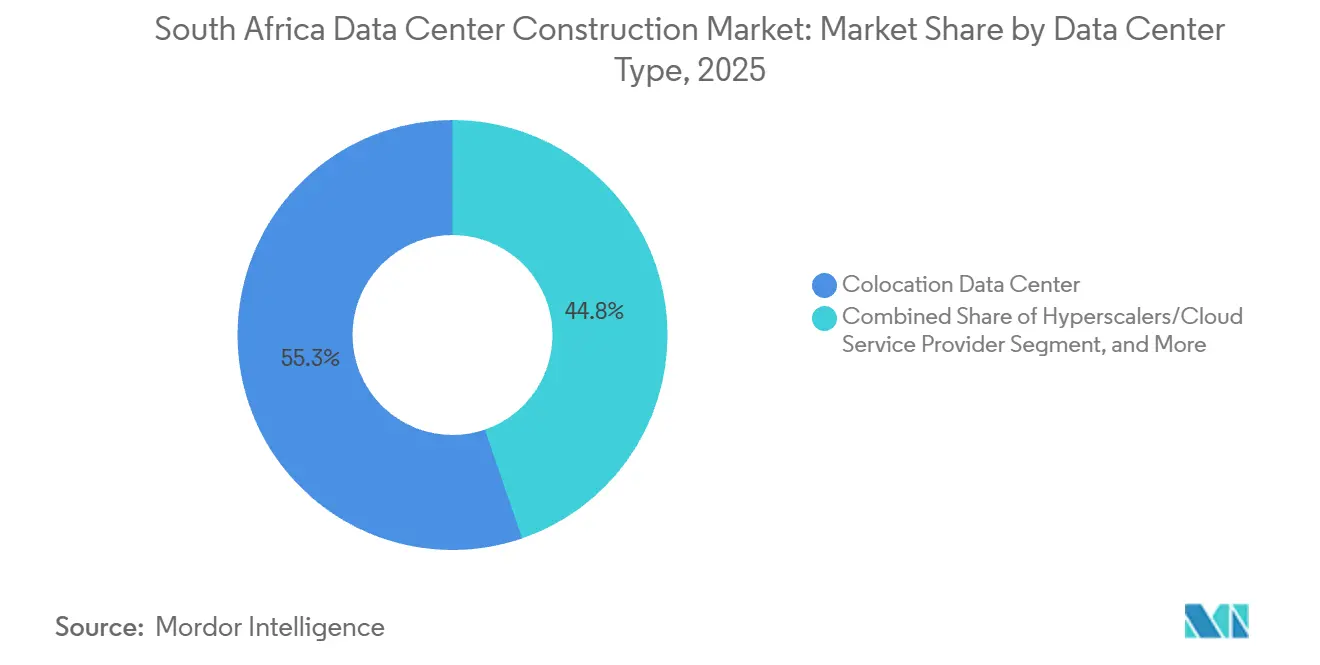
- By data-center type, colocation captured 55.25% of revenue in 2025, yet hyperscaler self-builds are forecast to log the fastest 13.55% CAGR through 2031.
- By infrastructure component, electrical systems accounted for 40.35% of 2025 spend, while mechanical systems are tracking a 13.83% forecast CAGR on the back of liquid cooling.
Note: Market size and forecast figures in this report are generated using Mordor Intelligence’s proprietary estimation framework, updated with the latest available data and insights as of January 2026.
South Africa Data Center Construction Market Trends and Insights
Drivers Impact Analysis*
| Driver | (~) % Impact on CAGR Forecast | Geographic Relevance | Impact Timeline |
|---|---|---|---|
| Rapid Cloud and Hyperscaler Expansion | +3.2% | National – strongest in Johannesburg and Cape Town | Medium term (2-4 years) |
| Submarine Cable Landings Boosting Connectivity | +2.8% | National – primary beachheads in Cape Town, Durban, Port Elizabeth | Long term (≥ 4 years) |
| On-Site Renewable Energy Projects Mitigating Grid Risk | +2.1% | National – led by Western Cape and Gauteng | Medium term (2-4 years) |
| National AI Strategy Accelerating High-Density Builds | +1.9% | National – early movers in Johannesburg tech districts | Long term (≥ 4 years) |
| Government Support for Data Center Development | +1.4% | Special economic zones nationwide | Medium term (2-4 years) |
| Special Economic Zone Tax Incentives | +1.2% | Coega, Atlantis, Richards Bay, OR Tambo | Medium term (2-4 years) |
| Source: Mordor Intelligence | |||
Rapid Cloud and Hyperscaler Expansion
Microsoft’s ZAR 5.4 billion (USD 300 million) Azure expansion announced in March 2025 and Google Cloud’s ZAR 2.5 billion Johannesburg launch the same month confirm hyperscalers’ commitment to local infrastructure. [1]Google LLC, “Johannesburg Cloud Region Launch,” cloud.google.comscaled its Cape Town region in 2025 to serve financial-services clients that face data-residency strictures. [2]Amazon Web Services, “Cape Town Region Documentation,” aws.amazon.com These rollouts compel colocation landlords to reserve multi-megawatt suites, deepen fiber routes, and guarantee 99.99% uptime, lifting the South Africa data center construction market as enterprises follow cloud-provider footprints. Hyperscalers’ preference for direct PPAs with renewable developers raises entry barriers for smaller firms. Margin pressure is prompting second-tier operators to bundle managed services, sovereign-cloud options, and hybrid-integration toolkits as differentiators.
Submarine Cable Landings Boosting Connectivity
The 2Africa cable delivered 180 Tbps of capacity into Cape Town and Durban in 2024, cutting IP-transit pricing by up to 40% for domestic carriers. Google’s Equiano system added another 144 Tbps and unprecedented 24-fiber-pair diversity, enabling dual-path resilience prized by banks and content networks. Cable consortia are now colocating landing stations inside Tier 3 halls, collapsing latency below 10 milliseconds for traffic to Johannesburg metros. Lower network cost of ownership is shifting content-delivery nodes from London to Cape Town, reinforcing the South Africa data center construction market’s role as a regional hub. Operators positioned adjacent to beachheads can monetize cross-connect density and capture edge workloads from streaming and gaming platforms.
On-Site Renewable Energy Projects Mitigating Grid Risk
Teraco’s under-construction JB7 campus integrates rooftop solar and battery storage designed to cover 30% of its 40-megawatt baseload. [3]Teraco Data Environments, “JB4 and CT2 Facility Updates,” teraco.co.za Africa Data Centres raised ZAR 2 billion (USD 110 million) in June 2024 to install photovoltaics and lithium-ion packs across Johannesburg and Cape Town sites. The International Energy Agency recorded a 120% jump in South African behind-the-meter battery deployments in 2024, with data-center demand accounting for a sizeable share. Renewable self-generation de-risks hyperscale leases, enabling five-nines uptime promises despite persistent load-shedding. Capital intensity around USD 1-1.5 million per megawatt for solar-plus-storage raises thresholds for would-be entrants, consolidating market power among incumbents able to secure concessional debt or equity.
National AI Strategy Accelerating High-Density Builds
The Department of Science and Innovation’s 2024 AI blueprint mandates that 50% of public-sector AI workloads reside domestically by 2027, triggering procurements for GPU clusters and inference servers. Schneider Electric is partnering with South African operators to deploy rear-door heat exchangers and immersion baths that support 50-kilowatt-plus racks. High-density pods demand liquid cooling, 400-gigabit spine fabrics, and Tier 4 power paths, elevating per-megawatt capex and lengthening commissioning timelines. A 2024 survey by the Institute of Information Technology Professionals South Africa flagged a 27% shortage in AI-engineering talent, indicating that skills scarcity may temper rollout velocity. Nonetheless, the policy signal anchors forecast demand, helping hyperscalers justify speculative capacity additions in the South Africa data center construction market.
Restraints Impact Analysis*
| Restraint | (~) % Impact on CAGR Forecast | Geographic Relevance | Impact Timeline |
|---|---|---|---|
| Strained and Unreliable Power Grid | -2.4% | National – peak pressure in Gauteng and Western Cape | Short term (≤ 2 years) |
| Escalating Construction and Equipment Costs | -1.8% | National – magnified by currency risk | Medium term (2-4 years) |
| Construction-Mafia Security Threats to Job-Sites | -1.1% | Gauteng, KwaZulu-Natal, Eastern Cape | Short term (≤ 2 years) |
| Shortage of Liquid-Cooling Engineering Talent | -0.9% | National – acute in major metros | Medium term (2-4 years) |
| Source: Mordor Intelligence | |||
Strained and Unreliable Power Grid
Eskom still carries debt near ZAR 400 billion (USD 22 billion) and an aging coal fleet that forces rotational load-shedding despite incremental renewable additions. Municipal tariffs jumped 12.6% in the 2024-2025 fiscal cycle, squeezing operating margins for megawatt-scale halls. Operators oversize gensets and lithium-ion strings by 15-20% compared with peers in stable-grid geographies, lifting capital requirements and elongating payback periods. Data-sovereignty rules prevent many enterprises from failing over to European regions, so migration timelines stretch until providers can prove 99.99% uptime through on-site renewables and batteries. Transmission bottlenecks further constrain wheeling of independent-power-producer energy into Johannesburg clusters, underscoring the structural drag on the South Africa data center construction market.
Escalating Construction and Equipment Costs
Statistics South Africa’s producer-price index showed a 5.2% rise in construction materials in Q4 2024, while a weaker rand inflated imported UPS and cooling-plant invoices 8-10% in 2025. Vertiv and Schneider Electric systems make up roughly one-quarter of electrical spend, so currency swings reverberate directly through budgets. Skilled-trade wages accelerated 15-20% year-over-year as data-center, mining, and renewable projects competed for electricians and HVAC technicians. Construction-mafia extortion adds an unpredictable 10-15% premium and months of delays, according to industry reports. To hedge exposure, builders lock in fixed-price EPC contracts and forward-book forex, but these tactics curtail flexibility and may bake in elevated costs if materials soften, cooling near-term growth in the South Africa data center construction market.
*Our forecasts treat driver/restraint impacts as directional, not additive. The impact forecasts reflect baseline growth, mix effects, and variable interactions.
Segment Analysis
By Tier Type: Fault-Tolerance Premium Drives Tier 4 Uptake
In 2025, Tier 3 facilities commanded a dominant 57.13% share of South Africa's data center construction market, while Tier 4 deployments are on track to grow at a robust 13.41% CAGR, extending to 2031.Tier 3 halls represented the lion’s share of deployed space in 2025, yet Tier 4 new-builds are growing faster as hyperscalers and payment processors demand absolute resilience. A single Tier 4 pod can host 40-megawatt blocks, with duplicate utility feeds, concurrently maintainable switchgear, and dual liquid-cooling loops raising capex roughly 35% above Tier 3 blueprints. Those economics are offset by service-level agreements guaranteeing 99.995% availability, a baseline required by real-time trading and mobile-money platforms.
Insurance carriers and sector regulators now reference Tier 4 guidelines, nudging financial institutions to upgrade disaster-recovery footprints inside the South Africa data center construction market. Operators mitigate front-loaded cash outlay through modular deployment, stacking 5-10 megawatt blocks in phased succession while leveraging predictive-maintenance analytics to limit downtime. The approach builds a runway for hybrid AI training clusters, which rely on uninterrupted power trains and direct-to-chip coolant circulation.


By Data Center Size: Hyperscale Campuses Command Capital Allocation
In 2025, the large segment made up 50.45% of South Africa's data center construction market. As AI inference workloads surge, the hyperscale segment is poised for growth, advancing at a notable 13.62% CAGR. Hyperscale footprints, defined as facilities above 20 megawatts or 10,000 square meters, delivered the strongest growth trajectory in 2025 and retain a leading double-digit CAGR. Speculative builds now feature 400-gigabit Ethernet fabrics, aisle-containment for liquid immersion tanks, and 48U racks capable of hosting 8-GPU nodes for generative-AI inference.
Microsoft and Google both selected greenfield plots near Johannesburg fiber trunks, pre-installing high-voltage feeders and water-treatment plants to support expansion phases. Large-campus economics hinge on long-term power-purchase agreements that lock renewable tariffs for 10-15 years, hedging against Eskom rate volatility. Medium-sized facilities, serving traditional enterprise colocation, confront churn as software-as-a-service vendors siphon moderate-density workloads into public cloud zones. Small edge centers anchor 5G network slices and regional caching but capture a narrower capital envelope relative to hyperscale’s gravitational pull within the South Africa data center construction market.
By Data Center Type: Colocation Pivots to Managed Services as Hyperscalers Internalize
Colocation services secured 55.25% of the revenue in 2025. However, hyperscaler self-builds are set to outpace, with a projected growth rate of 13.55% CAGR through 2031.Colocation remained the dominant revenue source in 2025 but now grows below the South Africa data center construction market average. Anchor tenants prefer dedicated campuses that guarantee latency, cost, and security outcomes without intermediary mark-ups. The resulting wholesale-to-self-build migration is most visible in hyperscaler footprints that bundle fiber rights, 150 kilovolt substation connections, and solar PPAs under a single build-operate-own framework.
Colocation incumbents safeguard share by offering managed network fabrics, cross-cloud interconnects, and regulatory-compliant sovereign vaults, cementing relevance for enterprises pursuing hybrid IT. Edge and enterprise data centers preserve a role in latency-critical financial crime detection and low-footprint disaster recovery but face margin compression. The pivot toward service-layer differentiation rather than physical floor space underpins strategic spending across the South Africa data center construction market.
By Infrastructure: Mechanical Systems Capture Rising Share on AI Cooling Needs
Electrical systems constituted 40.35% of the 2025 expenditure. On the other hand, mechanical systems, buoyed by the rise of liquid cooling, are charting a forecasted growth rate of 13.83% CAGR.Electrical equipment, switchgear, UPS arrays, diesel gensets, and lithium-ion batteries still tops capital outlay, yet mechanical systems post the fastest expansion through 2031. Liquid cooling adoption is ubiquitous in new GPU halls, where 50-kilowatt rack densities triple heat-removal requirements versus virtualized x86 loads. Operators partner with Schneider Electric for rear-door heat exchangers that cut water consumption 40%, satisfying municipal restrictions in Western Cape.
Vertiv’s adiabatic coolers, rolled out in 2025, lower PUE to 1.3, aligning with hyperscaler sustainability mandates. Server, storage, and network hardware also scale cost curves as GPU node counts increase. General construction spending ticks upward because thicker slab foundations and enhanced fire suppression accommodate heavier racks and dielectric coolant reservoirs. Design-build integrators embed digital-twin modeling to validate fluid dynamics, shortening time-to-revenue despite higher upfront engineering fees across the South Africa data center construction market.
Geography Analysis
Johannesburg accounts for the overwhelming majority of installed megawatts, leveraging proximity to the Johannesburg Stock Exchange, banking headquarters, and the densest metropolitan fiber. New capacity additions in Isando, Bredell, Midrand, and Samrand averaged double-digit growth in 2025, fueled by wholesale leases from cloud and fintech anchors. Grid constraints remain most acute in Gauteng, so on-site solar and gas turbines figure prominently in new permitting applications, reinforcing capital intensity in the South Africa data center construction market.
Cape Town, historically a secondary hub, accelerated in 2025 thanks to Equiano and 2Africa landings that slashed international transit costs. Teraco’s CT2 hall added 32 megawatts and became the first in Africa to colocate dual submarine-cable beachheads under one roof, creating a content-delivery node for streaming and gaming providers targeting Southern African viewers. Favorable land pricing and cooler ambient temperatures support lower PUE targets, but water-scarcity regulations compel widespread adoption of adiabatic or closed-loop cooling configurations. Provincial incentives promoting green-jobs and renewable uptake further sweeten project economics.
Secondary metros such as Durban, Port Elizabeth, Bloemfontein remain nascent yet strategically relevant for edge processing, disaster recovery, and regulatory geographic-redundancy mandates. The Coega, Atlantis, and Richards Bay special economic zones extend tax holidays and accelerated depreciation, but uptake is modest because tenants prioritize workload adjacency to Johannesburg’s financial core. Nonetheless, 5G low-latency use cases in telemedicine and autonomous mining stir demand for micro-edge deployment clusters, hinting at a distributed-computing layer that will complement rather than cannibalize flagship campuses within the South Africa data center construction market.
Competitive Landscape
Market leadership is concentrated among a handful of incumbents possessing the capital depth to knit together land, power, and carrier-neutral interconnects. Teraco, under Berkshire Partners and Permira ownership, operates close to 190 megawatts in four metro campuses and wields exclusive long-haul fiber routes linking Johannesburg and Cape Town. Africa Data Centres, parented by Liquid Intelligent Technologies, integrates retail colocation with last-mile connectivity, leveraging Liquid’s pan-African backbone to cross-sell bandwidth bundles. Vantage Data Centers, backed by DigitalBridge, imports its U.S. hyperscale blueprint to deploy 30-megawatt modules complete with 110-kilovolt substations and solar PPAs. Together, these firms sustain pricing power through multi-year cross-connect contracts, yet rising hyperscaler self-builds curb rack-rate escalation, preserving customer leverage in the South Africa data center construction market.
New entrants target vertical integration to bypass landlord dependency. Visa inaugurated a dedicated Johannesburg facility in July 2025 to host payment-processing workloads requiring PCI-DSS compliance and single-digit-millisecond latency. Equinix tapped Platform Equinix to open the JN1 hall in late 2024, betting that global interconnection fabrics entice multinational enterprises that already leverage the brand in other regions. Development-finance backing from the World Bank’s USD 100 million loan to Raxio underscores institutional appetite for African digital-infrastructure yield as long as operators secure credible power and fiber pipelines.
Competitive differentiation now hinges on sustainability credentials, AI-ready density, and managed-service overlays. Operators deploying EcoStruxure analytics from Schneider Electric or machine-learning-driven cooling optimization tighten PUE and carbon-intensity metrics, winning hyperscaler sustainability mandates. Service-layer plays include sovereign-cloud enclaves for public-sector data, cyber-resilience solutions, and compliance orchestration addressing Protection of Personal Information Act requirements. The playbook signals a shift from pure brick-and-mortar toward platform-centric value capture in the South Africa data center construction market.
South Africa Data Center Construction Industry Leaders
Teraco Data Environments (Pty) Ltd
Africa Data Centres (Pty) Ltd
Equinix South Africa (Pty) Ltd
Vantage Data Centers South Africa (Pty) Ltd
Open Access Data Centres (Pty) Ltd
- *Disclaimer: Major Players sorted in no particular order

Recent Industry Developments
- January 2026: Teraco topped out structural steel on its JB7 Tier 4 campus in Johannesburg, staying on schedule for a 40-megawatt phase-one energization in Q4 2026.
- November 2025: Teraco completed its CT2 Cape Town expansion, adding 32 megawatts of capacity across eight halls featuring on-site solar and batteries.
- August 2025: Teraco commissioned its JB4 Johannesburg expansion, unlocking 30 megawatts tailored for high-density AI racks.
- July 2025: Visa opened its first African data center in Johannesburg to run payment-processing and fraud-detection workloads.


South Africa Data Center Construction Market Report Scope
The South Africa Data Center Construction Market refers to the development and establishment of data center facilities, encompassing the design, construction, and installation of infrastructure required to support data storage, processing, and management. This includes electrical systems, mechanical components, general construction, and associated services.
The South Africa Data Center Construction Market Report is Segmented by Tier Type (Tier 1 and 2, Tier 3, and Tier 4), Data Center Size (Small, Medium, Large, and Hyperscale), Data Center Type (Colocation, Hyperscalers/CSPs, and Enterprise and Edge), Infrastructure (Electrical, Mechanical, General Construction, and Services). The Market Forecasts are Provided in Terms of Value (USD).
| Tier 1 and 2 |
| Tier 3 |
| Tier 4 |
| Small |
| Medium |
| Large |
| Hyperscale |
| Colocation Data Center |
| Hyperscalers/Cloud Service Provider (CSPs) |
| Enterprise and Edge Data Center |
| Electrical Infrastructure | Power Distribution Solution |
| Power Backup Solutions | |
| Mechanical Infrastructure | Cooling Systems |
| Racks and Cabinets | |
| Servers and Storage | |
| Other Mechanical Infrastructure | |
| General Construction | |
| Services - Design and Consulting, Integration, Support and Maintenance |
| By Tier Type | Tier 1 and 2 | |
| Tier 3 | ||
| Tier 4 | ||
| By Data Center Size | Small | |
| Medium | ||
| Large | ||
| Hyperscale | ||
| By Data Center Type | Colocation Data Center | |
| Hyperscalers/Cloud Service Provider (CSPs) | ||
| Enterprise and Edge Data Center | ||
| By Infrastructure | Electrical Infrastructure | Power Distribution Solution |
| Power Backup Solutions | ||
| Mechanical Infrastructure | Cooling Systems | |
| Racks and Cabinets | ||
| Servers and Storage | ||
| Other Mechanical Infrastructure | ||
| General Construction | ||
| Services - Design and Consulting, Integration, Support and Maintenance | ||


Key Questions Answered in the Report
How large is the South Africa data center construction market in 2026?
It is valued at USD 1.61 billion in 2026, with a forecast CAGR of 12.68% toward 2031.
Which tier segment is growing fastest in South African data-center builds?
Tier 4 facilities, designed for five-nines uptime, are expanding at a 13.41% CAGR through 2031.
Why are hyperscale campuses gaining share over traditional colocation?
Cloud providers prefer owning dedicated campuses to control latency, renewable power, and cost, pushing colocation operators to pivot toward managed services.
What role do submarine-cable landings play in market growth?
New systems such as 2Africa and Equiano cut transit costs, improve redundancy, and attract content-delivery and cloud workloads to in-country data centers.
How are operators mitigating Eskom grid instability?
Builders embed solar arrays, lithium-ion batteries, and diesel gensets into greenfield designs, targeting on-site generation coverage of 30-50% of baseload demand.
Which provinces outside Gauteng and Western Cape show potential for edge deployments?
Durban in KwaZulu-Natal and the Coega special economic zone near Port Elizabeth are emerging edge locations for disaster recovery and 5G-enabled applications.
Page last updated on:


