
SOP Fertilizer Market Size and Share
Market Overview
| Study Period | 2021 - 2031 |
|---|---|
| Market Size (2026) | USD 5.27 Billion |
| Market Size (2031) | USD 6.77 Billion |
| Growth Rate (2026 - 2031) | 6.16 % |
| Fastest Growing Market | South America |
| Largest Market | Asia-Pacific |
| Market Concentration | Medium |
Major Players
*Disclaimer: Major Players sorted in no particular order Image © Mordor Intelligence. Reuse requires attribution under CC BY 4.0. |
|
SOP Fertilizer Market Analysis by Mordor Intelligence
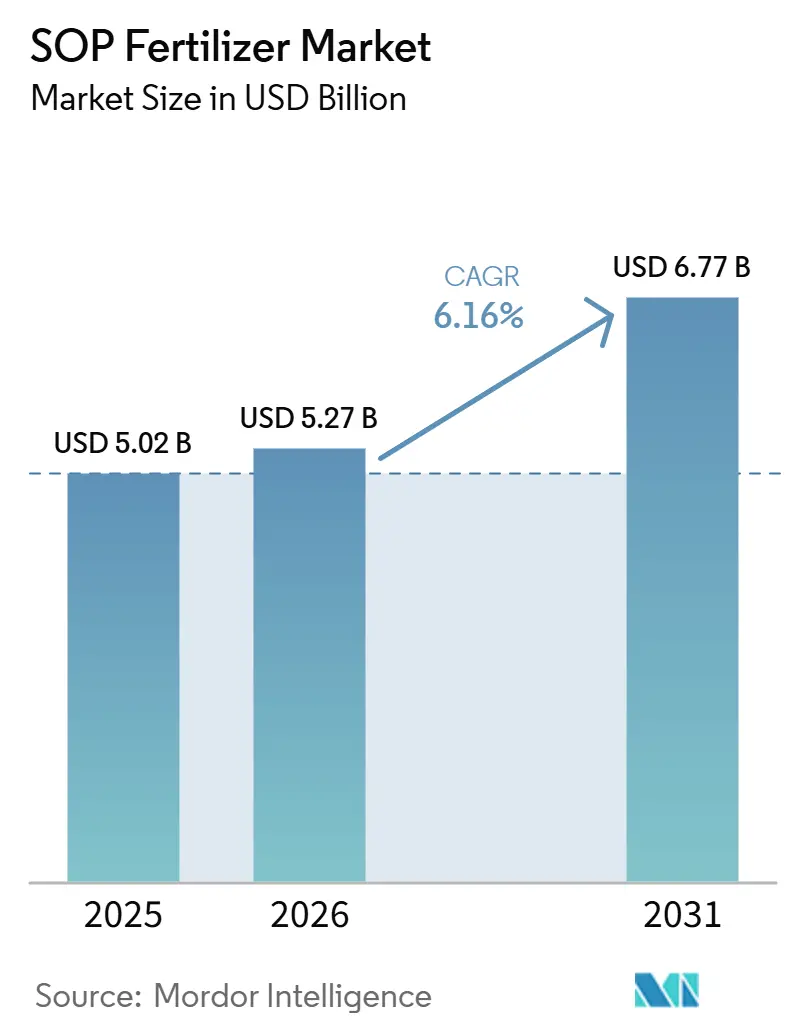
The SOP market was valued at USD 5.02 billion in 2025 and is anticipated to grow from USD 5.27 billion in 2026 to USD 6.77 billion by 2031, at a CAGR of 6.16% during the forecast period 2026–2031. The market is supported by a steady shift in fertilizer demand away from chloride-bearing potassium sources in crops where quality, shelf life, and export acceptance directly influence farm returns. The market is also benefiting from wider fertigation use in protected cultivation, as these systems require chloride-free and fully water-soluble nutrient inputs. Price discipline remains relevant, but the premium over alternative potassium sources remains defensible in horticulture programs supplying quality-focused domestic and export channels. Supply remains moderately concentrated, with integrated producers holding strong positions in premium grades while secondary manufacturers compete in standard products. These dynamics are keeping the market focused on feedstock security, soluble-grade expansion, and selective capacity additions in regions with high horticulture intensity.
Key Report Takeaways
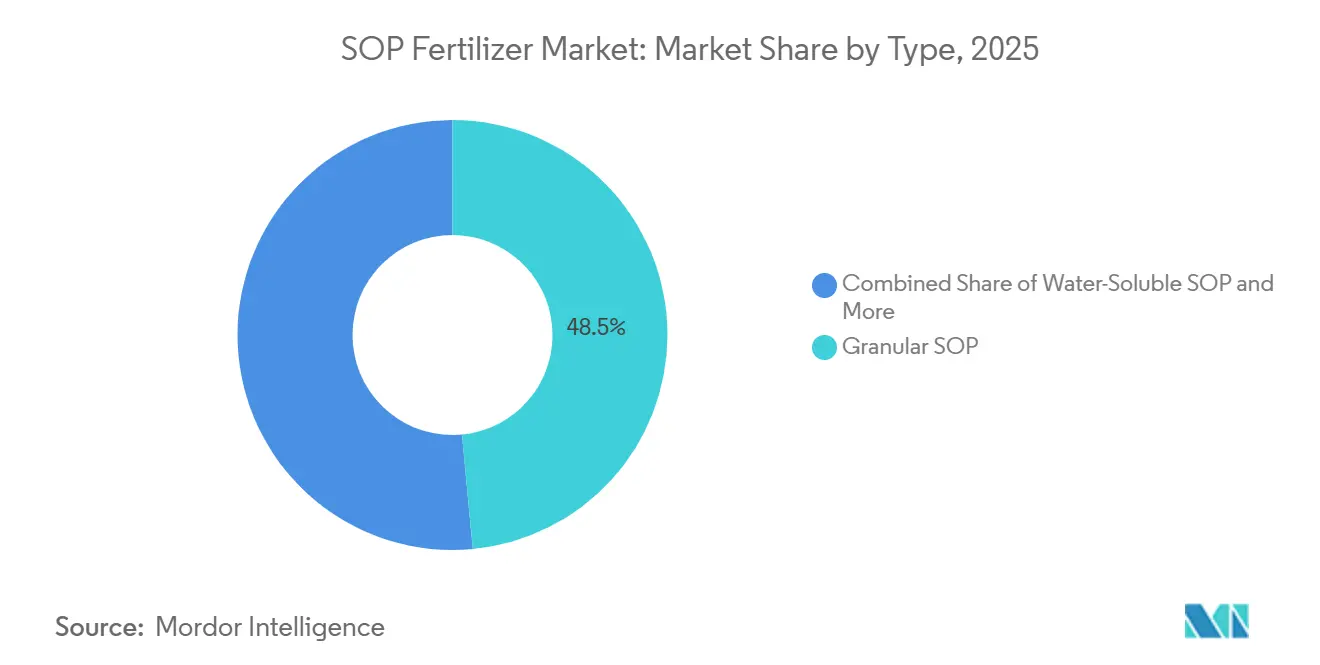
- By type, granular SOP was the largest segment and held 48.5% of the SOP fertilizer market share in 2025, while water-soluble SOP is the fastest growing segment and is anticipated to expand at a 7.8% CAGR between 2026 and 2031.
- By application mode, soil application was the largest segment and held 39.0% of the market share in 2025, while fertigation is the fastest growing segment and is anticipated to expand at a 7.2% CAGR between 2026 and 2031.
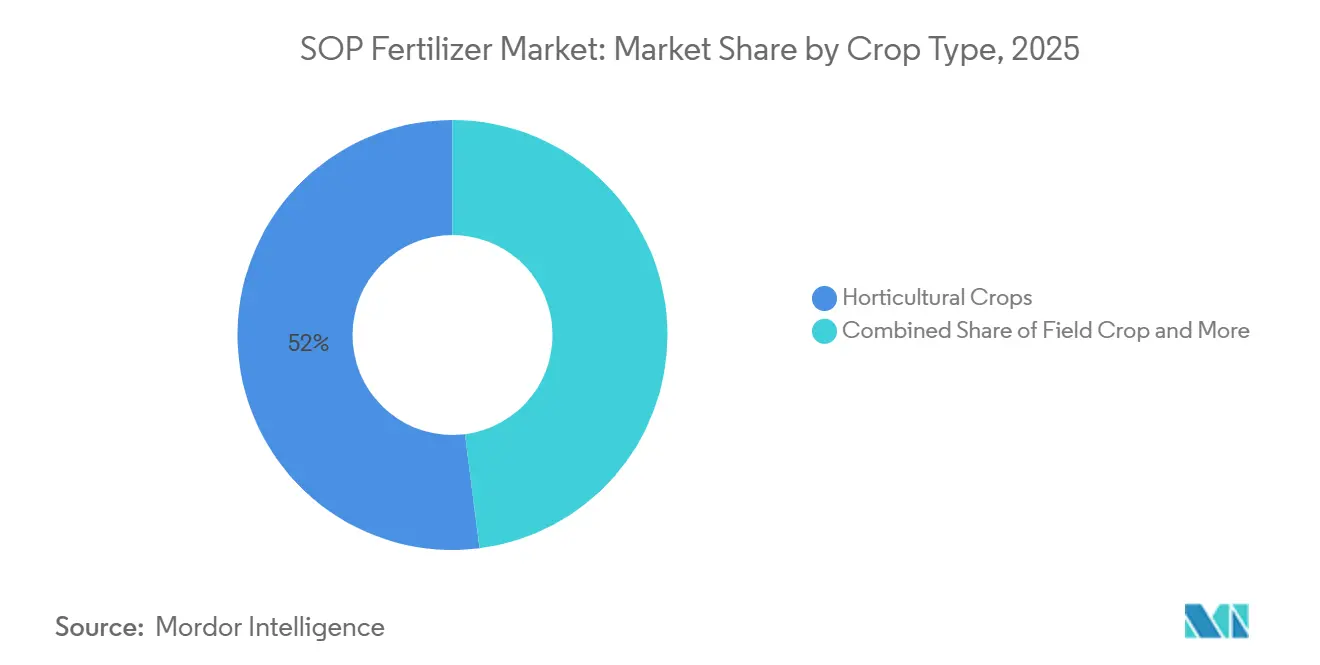
- By crop type, horticultural crop was the largest segment and held 52.0% of the SOP fertilizer market size in 2025, while horticultural crop is also the fastest growing segment and is anticipated to expand at a 7.1% CAGR between 2026 and 2031.
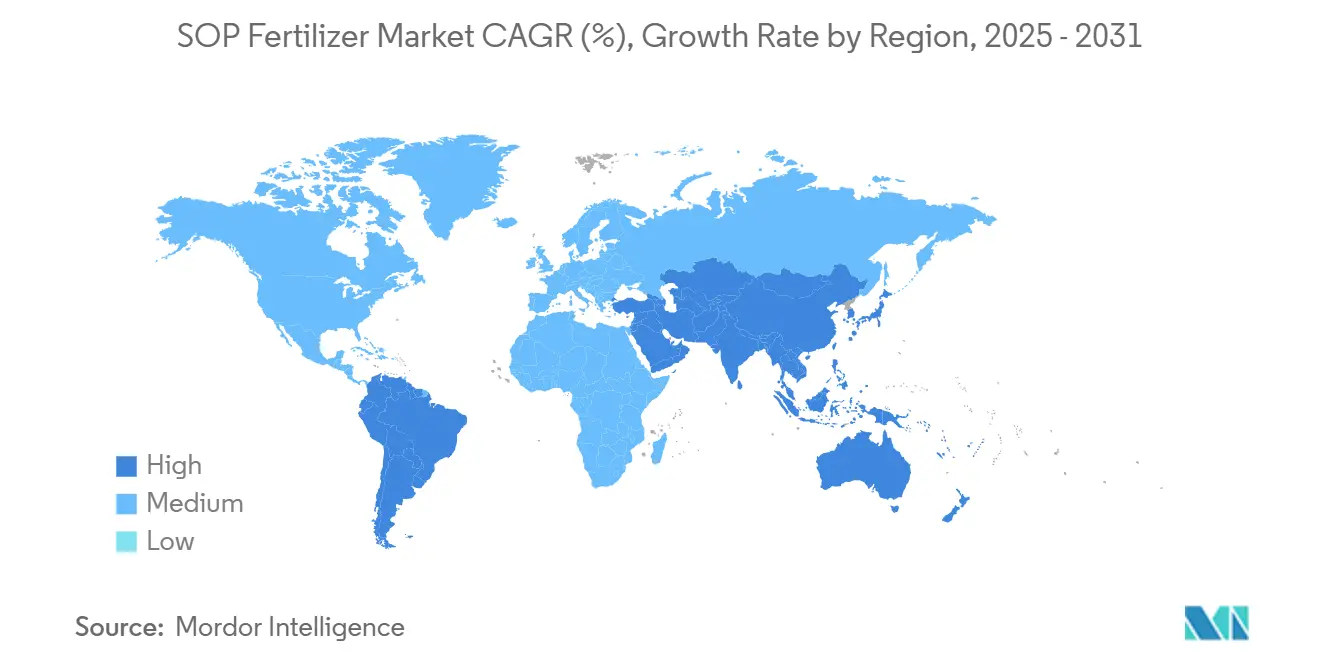
- By geography, Asia-Pacific was the largest segment and held 38.5% of the market share in 2025, while South America is the fastest growing segment and is anticipated to expand at a 6.4% CAGR between 2026 and 2031.
Note: Market size and forecast figures in this report are generated using Mordor Intelligence’s proprietary estimation framework, updated with the latest available data and insights as of January 2026.
Global SOP Fertilizer Market Trends and Insights
Drivers Impact Analysis*
| Driver | (~) % Impact on CAGR Forecast | Geographic Relevance | Impact Timeline |
|---|---|---|---|
| Rising demand for chloride-free potassium nutrition in high-value crops | +1.4% | Global, with core concentration in Asia-Pacific, Europe, and South America | Long term (≥ 4 years) |
| Expansion of protected cultivation and horticulture-driven fertigation | +1.2% | Asia-Pacific core, spill-over to the Middle East and Europe | Medium term (2-4 years) |
| Soil salinity concerns accelerating adoption of low-chloride fertilizers | +0.9% | Middle East, South Asia, and coastal Southeast Asia | Medium term (2-4 years) |
| Precision nutrient management improving uptake efficiency in specialty crops | +0.8% | North America, Europe, and technology-forward growers in Asia-Pacific | Long term (≥ 4 years) |
| Government support for export-oriented fruit and vegetable production | +0.7% | South America, the Middle East, and Africa with export exposure | Medium term (2-4 years) |
| Growth in water-soluble fertilizer adoption across micro-irrigated farms | +1.0% | Asia-Pacific, the Middle East, and South America | Short term (≤ 2 years) |
| Source: Mordor Intelligence | |||
Rising Demand for Chloride-Free Potassium Nutrition in High-Value Crops
Chloride sensitivity in fruits, vegetables, tree nuts, and tobacco provides a strong agronomic basis for the SOP market. In these crop systems, chloride-bearing potassium inputs can reduce sugar formation, fruit firmness, color development, and post-harvest quality, making crop nutrition selection a direct commercial decision. A 2025 study in Agronomy from Oregon State University found that K₂SO₄(Potassium sulfate) delivered total potato yields comparable to KCl (Potassium chloride) in Oregon's Columbia Basin while avoiding the tuber specific-gravity decline linked to chloride accumulation[1]Source: Research Article, "Potato Productivity Response to Potassium Fertilizer Source and Rate in Oregon’s Columbia Basin,"mdpi.com. This result is relevant because buyers in premium food supply chains typically pay for pack-out quality rather than raw yield alone. As a result, the SOP market remains closely tied to crop systems where sale value depends on maintaining visual and storage quality.
Expansion of Protected Cultivation and Horticulture-Driven Fertigation
Protected cultivation is strengthening the technical demand base for the market across greenhouse, shade-house, and polyhouse systems. These systems require precise nutrient control and clean dissolution, which increases the value of chloride-free and highly soluble crop nutrition products. Recirculating fertigation setups are particularly sensitive to chloride buildup, as excess chloride can disrupt nutrient balance across repeated irrigation cycles. As a result, SOP often functions as a technical requirement rather than a premium option in hydroponic and substrate-based farming. This trend is also evident in export-oriented berry, tomato, pepper, and floriculture programs, where input consistency supports crop quality and market acceptance. As protected cultivation expands, demand in the sulfate of potash market is shifting toward higher-purity products compatible with irrigation equipment and closed-loop nutrient systems.
Soil Salinity Concerns Accelerating Adoption of Low-Chloride Fertilizers
Soil salinity is another long-term factor supporting the market in irrigated agriculture. Salinity pressure increases when fields face poor drainage, saline irrigation water, and repeated use of chloride-bearing fertilizers over multiple crop cycles. A 2025 study in the Journal of Environmental Engineering reported that K₂SO₄ (Potassium sulfate) applied at 90 kg per hectare in degraded humid-tropical Ultisols in South Sumatra improved plant performance compared to KCl (Potassium chloride) controls and reduced chloride load in the production system[2]Source: Research Article, "Engineering sulfate potassium nutrient pathways as a nature-based solution for productivity recovery and externality mitigation in degraded humid-tropical Ultisol agroecosystems,"jeeng.net. This is relevant in arid and coastal production areas where salt stress already reduces crop response and lowers input efficiency. In these settings, growers are not only choosing between two potassium sources but also trying to avoid adding further soil and water stress. This makes SOP more relevant in premium crop districts that already operate under difficult salinity conditions.
Growth in Water-Soluble Fertilizer Adoption Across Micro-Irrigated Farms
Micro-irrigation adoption is directly supporting the SOP market by increasing demand for water-soluble grades. Drip and micro-spray systems require fertilizers that dissolve cleanly and move evenly through pipes and emitters without leaving residues. According to the Press Information Bureau (PIB) and the Ministry of Agriculture and Farmers Welfare, the Per Drop More Crop (PDMC) scheme, the main central program for micro-irrigation, had added 4.64 million hectares of drip-irrigated area by 2025, expanding the installed base for soluble specialty fertilizers in horticulture-focused farming systems[3]Source: Ministry of Agriculture & Farmers Welfare, "DRIP AND SPRINKLER IRRIGATION THROUGH PMKSY,"pib.gov.in. SQM S.A. reported in its 2025 annual results that healthy specialty fertilizer demand supported Specialty Plant Nutrition revenue growth, and the company guided 2026 volume growth of 2-4% for the segment. Tighter specialty fertilizer supply in parts of Asia is opening room for alternative chloride-free suppliers in soluble crop nutrition. As irrigation systems become more precise, the SOP market is benefiting from both agronomic fit and stronger demand for delivery-compatible formulations.
Restraints Impact Analysis*
| Restraint | (~) % Impact on CAGR Forecast | Geographic Relevance | Impact Timeline |
|---|---|---|---|
| Higher production cost versus muriate of potash limiting broad-acre adoption | -1.3% | Global, strongest in commodity crop belts in North America and South America | Long term (≥ 4 years) |
| Limited availability of high-grade sulfate feedstock constraining supply | -0.8% | Global, particularly affecting European and North American Mannheim producers | Medium term (2-4 years) |
| Price sensitivity among smallholder farmers in emerging markets | -0.9% | Asia-Pacific, including India and Southeast Asia, and Africa | Medium term (2-4 years) |
| Substitution by blended fertilizers and alternative potassium sources | -0.7% | North America, Europe, and commodity crop markets globally | Short term (≤ 2 years) |
| Source: Mordor Intelligence | |||
Higher Production Cost Versus Muriate of Potash Limiting Broad-Acre Adoption
The primary commercial constraint on the SOP market is its higher cost compared to Muriate of Potash (MOP). This price gap is manageable for fruit, vegetable, and other quality-sensitive crops, but is more difficult to absorb in cereals, oilseeds, and other broad-acre systems. Many growers in these segments purchase fertilizers based on cost per unit of nutrient, as their crop economics do not reward chloride exclusion in the same direct way. Even where SOP offers agronomic benefits, the price premium can delay adoption if the crop does not command higher value at sale. This creates a structural ceiling on SOP market penetration in large-acreage commodity farming, with demand remaining concentrated in crop systems where quality and marketability can offset the price difference.
Price Sensitivity Among Smallholder Farmers in Emerging Markets
Price sensitivity among smallholder farmers is a clear constraint on the sulfate of potash market across South Asia, Southeast Asia, and parts of Africa. Many growers compare SOP with lower-cost NPK blends and muriate of potash, rather than evaluating it on the basis of crop appearance, shelf life, and market acceptance. This purchasing behavior reflects credit constraints, short planning cycles, and limited extension support in many horticulture regions. In India, fertilizer subsidy structures continue to favor muriate of potash on a per-nutrient basis, making chloride-bearing options more accessible through subsidized channels. This reduces SOP adoption even in fruit and vegetable systems that would benefit from chloride-free nutrition. As a result, the sulfate of potash market faces a gap between agronomic suitability and farm-level purchasing power in several emerging markets.
*Our forecasts treat driver/restraint impacts as directional, not additive. The impact forecasts reflect baseline growth, mix effects, and variable interactions.
Segment Analysis
By Type: Granular SOP Anchors Volume, Water-Soluble Grade Reshaping Value Mix
Granular Sulfate of Potash (SOP) held 48.5% of the Sulfate of Potash market share in 2025, making it the largest product type by value. Its dominant position reflects its long-established role in soil-applied nutrition programs for tree fruits, vines, and vegetable crops, where growers value ease of handling and consistent field application. Standard SOP retained an important secondary position, while other product types served smaller and more specialized crop programs.
Water-soluble SOP is anticipated to expand at a CAGR of 7.8% between 2026 and 2031, making it the fastest-growing type in the Sulfate of Potash market. Water soluble grades are better suited to fertigation, greenhouse production, and hydroponic crop systems than field-applied products, which is shifting the value mix of the SOP market. Water-soluble SOP also supports more precise nutrient delivery, which is important in premium horticulture where fruit finish and uniformity affect realized prices. Producers offering reliable purity, low chloride content, and strong dissolution performance are better positioned to benefit from this trend. Over time, granular products are anticipated to retain the largest installed base, but a greater share of market value is likely to shift toward soluble formulations.



By Application Mode: Fertigation Sets the Growth Pace While Soil Application Holds the Base
Soil application accounted for 39.0% of the SOP market share in 2025, making it the largest application mode. Its position is supported by widespread adoption across orchards, vineyards, and open-field vegetable production systems, where growers rely on pre-season and scheduled soil applications to maintain a stable nutrient supply throughout the crop cycle. This application method also sustains demand for granular sulfate of potash products, particularly in established horticultural operations where soil-based nutrient management remains standard practice. Foliar application complements the market by addressing localized nutrient deficiencies and short-term crop stress, though its use is generally limited to targeted correction rather than primary nutrient delivery.
Fertigation is anticipated to expand at a CAGR of 7.2% between 2026 and 2031, making it the fastest-growing application mode. Growth is driven by increasing adoption of drip irrigation, protected cultivation, and high-value horticultural crops that require precise nutrient management. Fertigation enables growers to apply smaller, crop-stage-specific nutrient doses during critical growth periods such as flowering and fruit development, improving nutrient-use efficiency and supporting higher crop quality. As precision agriculture and water-efficient irrigation systems gain wider adoption, manufacturers are increasingly developing sulfate of potash formulations optimized for fertigation, alongside products designed for soil and foliar applications.
By Crop Type: Horticulture Remains the Core Demand Engine
Horticultural crops accounted for 52.0% of the sulfate of potash market in 2025, making them the largest crop category. This dominance is driven by the widespread cultivation of fruits, vegetables, berries, tree nuts, grapes, and greenhouse specialty crops, where chloride-free potassium is preferred because crop value depends heavily on appearance, firmness, taste, and storage performance. As a result, SOP demand remains concentrated in high-value crop systems where nutrient quality directly influences commercial returns.
Horticultural crops are also anticipated to expand at a 7.1% CAGR between 2026 and 2031, making them the fastest-growing crop category in the market. Growth is supported by the continued expansion of protected cultivation, precision fertigation, and premium horticultural production, where growers increasingly prioritize crop quality, export standards, and efficient nutrient management. Turf and ornamental crops continue to provide stable demand, particularly in applications where visual quality and salinity tolerance favor chloride-free fertilizers. Field crops remain the smallest segment, as the economic advantage of sulfate of potash over muriate of potash is often insufficient to justify its higher cost in large-acreage production systems. Consequently, the sulfate of potash market is anticipated to remain strongly aligned with specialty horticultural production, while field crop adoption remains selective.
Geography Analysis
Asia-Pacific held 38.5% of the market in 2025, making it the largest regional segment by value. China remained the largest national market due to its extensive protected agriculture base, rising fruit and vegetable consumption, and strong use of specialty crop inputs. India is strengthening its position as drip irrigation expands across horticulture-focused states, driving demand for soluble grades. Vietnam, Indonesia, and the Philippines are also contributing to demand growth as export-oriented vegetable, coffee, and tropical fruit programs place greater emphasis on crop quality and compliance. The region's large specialty crop acreage and growing interest in premium nutrient programs keep Asia-Pacific at the center of the market.
South America is anticipated to expand at a 6.4% CAGR between 2026 and 2031, making it the fastest-growing regional segment in the market. Brazil is driving this growth as growers shift toward premium horticultural crops that benefit from chloride-free nutrition. Argentina and Chile are following the same trend, as citrus, avocado, grape, and related export supply chains are highly sensitive to quality and market access requirements. In this region, crop nutrition choices are increasingly linked to export readiness and buyer acceptance.
North America remains a stable, premium destination in the market, supported by specialty crops, organic production, and precision nutrient programs. Europe also remains an attractive market as buyers place greater weight on traceability, production standards, and lower-carbon input options in premium supply chains. The Middle East supports demand through controlled-environment agriculture and saline water conditions that favor chloride-free crop nutrition in greenhouse systems. Africa is adding demand through export horticulture in Egypt, South Africa, and Nigeria, where supermarket standards and overseas buyer requirements are raising crop quality expectations.

Competitive Landscape
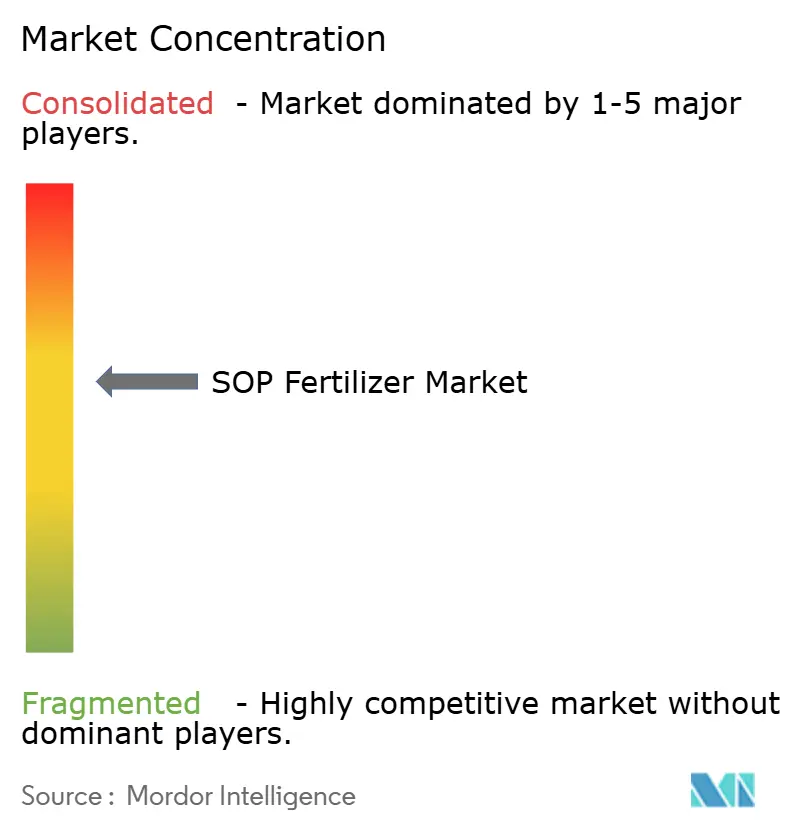
The SOP market remains moderately concentrated, with the top five producers, K+S Aktiengesellschaft, Tessenderlo Group, SQM S.A., ICL Group Ltd., and Compass Minerals International, accounting for a major share in 2025. This structure gives the market a mix of strong integrated suppliers at the premium end and a large number of regional manufacturers, particularly in China, that compete more heavily in standard grades. Integrated producers hold an advantage because feedstock access, product consistency, and logistics reliability matter more as buyers shift toward soluble and quality-assured products. This balance keeps competition active, while also increasing the value of scale and resource security in the SOP market.
Strategic activity in the market is increasingly focused on asset quality, local manufacturing, and long-term feedstock positioning. In Q1 2026, ICL Group Ltd. established a new specialty and water-soluble fertilizer production facility in Maharashtra, India, strengthening its position in horticulture and protected cultivation demand segments. In May 2026, EuroChem Group AG launched Phase II of its Kazakhstan investment project and continued work on a Phase III chemical complex that includes a SOP facility scheduled for completion in 2027. These developments indicate that the market is rewarding companies that combine capacity growth with tighter control over operations and end-market reach.
A clear shift in the market is the growing importance of certification, transparency, and supply reliability in premium crop chains. Buyers in organic, greenhouse, and export-oriented fresh produce programs are placing greater weight on documented product quality and dependable fulfillment. This makes it more difficult for smaller suppliers that compete primarily on price and have limited traceability or technical support. At the same time, larger producers are using portfolio depth and regional distribution to defend market share as demand becomes more specialized.
SOP Fertilizer Industry Leaders
-
Nutrien Ltd.
-
SQM S.A.
-
ICL Group Ltd.
-
K+S Aktiengesellschaft
-
Tessenderlo Group SA
- *Disclaimer: Major Players sorted in no particular order

Recent Industry Developments
- May 2026: EuroChem Group AG launched Phase II of its large-scale Kazakhstan investment project, commissioning a sulfuric acid plant in the Zhambyl Region with an annual design capacity of 800,000 metric tons. Phase III, a chemical complex producing over 1 million metric tons of fertilizers annually, including a SOP facility, is scheduled for completion in 2027. Total project investment exceeds USD 1 billion.
- March 2026: Compass Minerals International, Inc. completed the sale of its Wynyard SOP operation in Saskatchewan, Canada for total cash consideration of USD 30.8 million, directing proceeds toward debt reduction. The company consolidated its North American SOP production onto the higher-performing Ogden, Utah facility under its Back-to-Basics strategic framework.
- March 2026: ICL Group established a new specialty and water-soluble fertilizer production facility in Maharashtra, India, targeting growing demand from protected cultivation belts in horticulture-intensive states. The facility aims to strengthen local manufacturing and improve supply chain resilience for SOP-relevant specialty crop nutrition programs.


Global SOP Fertilizer Market Report Scope
Sulfate of Potash (SOP) is a premium, chloride-free potassium fertilizer (K₂SO₄) that supplies both potassium (K₂O) and sulfur (S) to plants, making it ideal for chloride-sensitive, high-value crops such as fruits, vegetables, and tobacco.
The SOP Market is Segmented by Type (Standard SOP, Granular SOP, Water-Soluble SOP, and Other SOP Types), by Application Mode (Soil, Foliar, and Fertigation), by Crop Type (Field Crops, Horticultural Crops, and Turf and Ornamental), and by Geography (North America, Europe, Asia-Pacific, South America, the Middle East, and Africa). The Market Forecasts are Provided in Terms of Value (USD) and Volume (Metric Tons).
| Standard SOP |
| Granular SOP |
| Water-Soluble SOP |
| Other SOP Types |
| Soil |
| Foliar |
| Fertigation |
| Field Crop |
| Horticultural Crop |
| Turf and Ornamental |
| North America | Canada |
| Mexico | |
| United States | |
| Rest of North America | |
| Europe | France |
| Germany | |
| Italy | |
| Netherlands | |
| Russia | |
| Spain | |
| Ukraine | |
| United Kingdom | |
| Rest of Europe | |
| Asia-Pacific | Australia |
| Bangladesh | |
| China | |
| India | |
| Indonesia | |
| Japan | |
| Pakistan | |
| Philippines | |
| Thailand | |
| Vietnam | |
| Rest of Asia-Pacific | |
| South America | Argentina |
| Brazil | |
| Rest of South America | |
| Middle East | Saudi Arabia |
| Turkey | |
| United Arab Emirates | |
| Rest of Middle East | |
| Africa | Egypt |
| Nigeria | |
| South Africa | |
| Rest of Africa |
| By Type | Standard SOP | |
| Granular SOP | ||
| Water-Soluble SOP | ||
| Other SOP Types | ||
| By Application Mode | Soil | |
| Foliar | ||
| Fertigation | ||
| By Crop Type | Field Crop | |
| Horticultural Crop | ||
| Turf and Ornamental | ||
| By Geography | North America | Canada |
| Mexico | ||
| United States | ||
| Rest of North America | ||
| Europe | France | |
| Germany | ||
| Italy | ||
| Netherlands | ||
| Russia | ||
| Spain | ||
| Ukraine | ||
| United Kingdom | ||
| Rest of Europe | ||
| Asia-Pacific | Australia | |
| Bangladesh | ||
| China | ||
| India | ||
| Indonesia | ||
| Japan | ||
| Pakistan | ||
| Philippines | ||
| Thailand | ||
| Vietnam | ||
| Rest of Asia-Pacific | ||
| South America | Argentina | |
| Brazil | ||
| Rest of South America | ||
| Middle East | Saudi Arabia | |
| Turkey | ||
| United Arab Emirates | ||
| Rest of Middle East | ||
| Africa | Egypt | |
| Nigeria | ||
| South Africa | ||
| Rest of Africa | ||


Key Questions Answered in the Report
What is the forecast for the SOP market by 2031?
The SOP market is forecasted to reach USD 6.77 billion by 2031, up from USD 5.27 billion in 2026, at a 6.16% CAGR between 2026 and 2031.
Which product type leads the market?
Granular Sulfate of potash (SOP) led the market with a 48.5% share in 2025 because it remains widely used in soil-applied horticulture programs.
Why do horticultural crops account for the largest use of SOP?
Horticultural crops held the major demand in 2025 because fruit and vegetable producers place high value on chloride-free nutrition that supports crop quality, shelf life, and market acceptance.
Which region is anticipated to grow the fastest?
South America is anticipated to expand the fastest at a 6.4% CAGR between 2026 and 2031.
Page last updated on:





