Smart Finance Connectivity Market Size and Share
Market Overview
| Study Period | 2020 - 2031 |
|---|---|
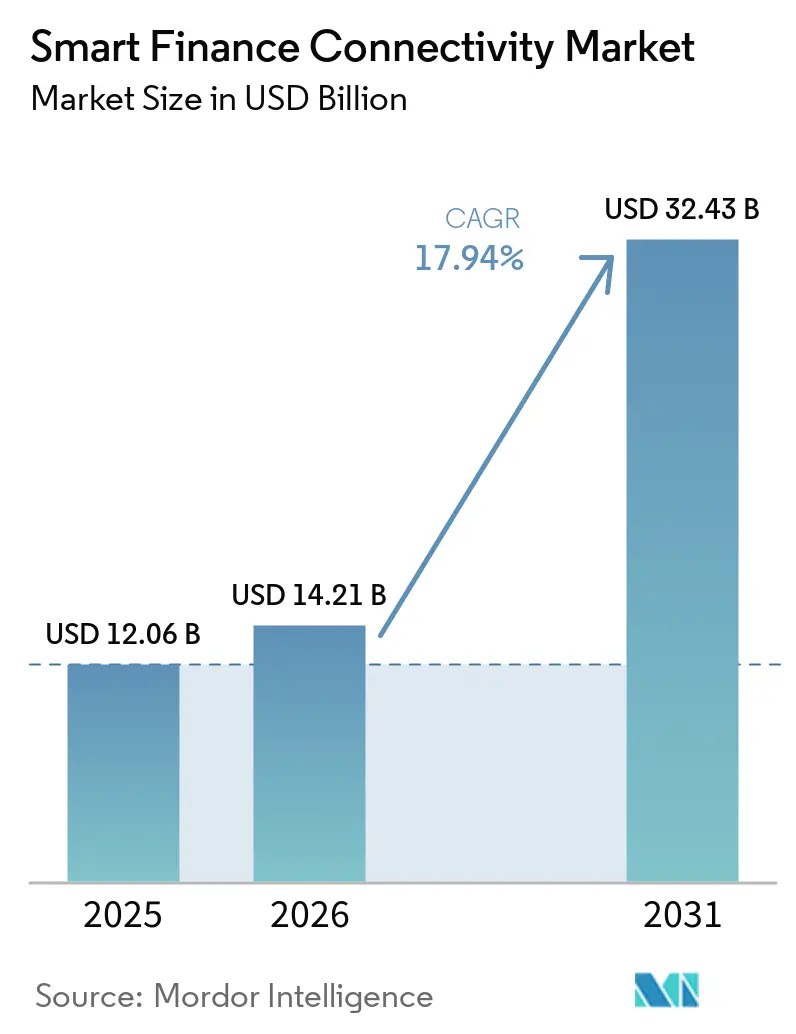
| Market Size (2026) | USD 14.21 Billion |
| Market Size (2031) | USD 32.43 Billion |
| Growth Rate (2026 - 2031) | 17.94% CAGR |
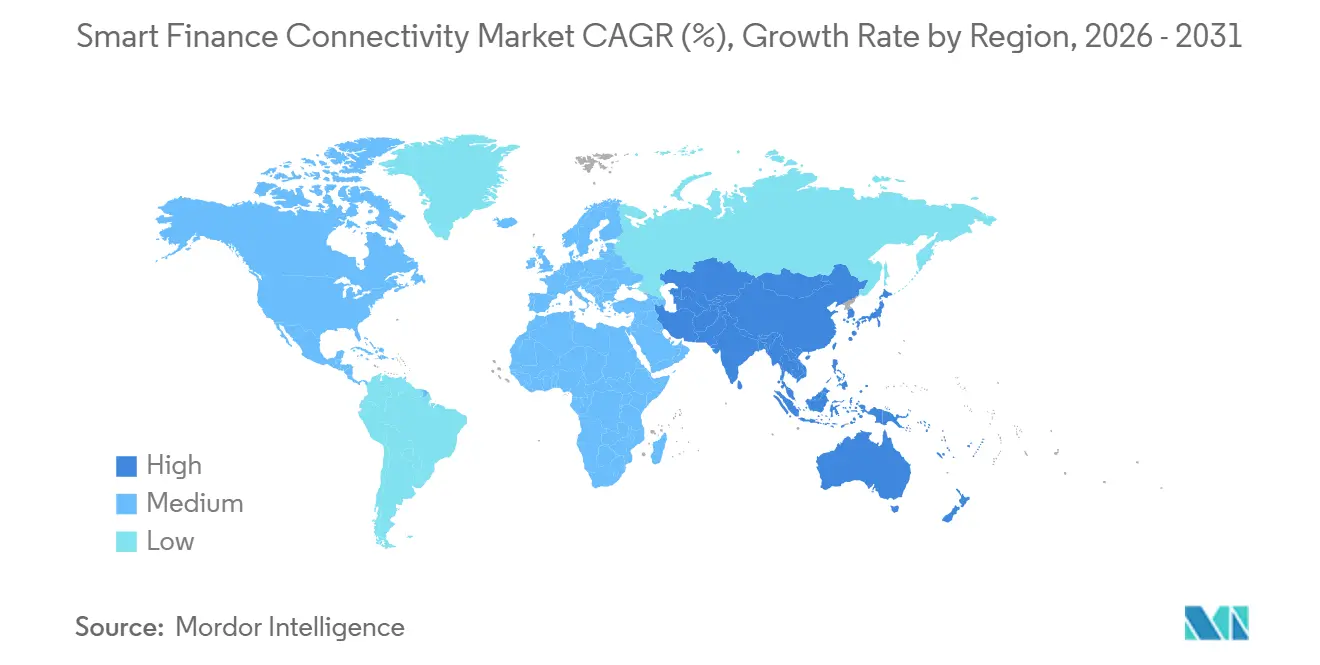
| Fastest Growing Market | Asia Pacific |
| Largest Market | North America |
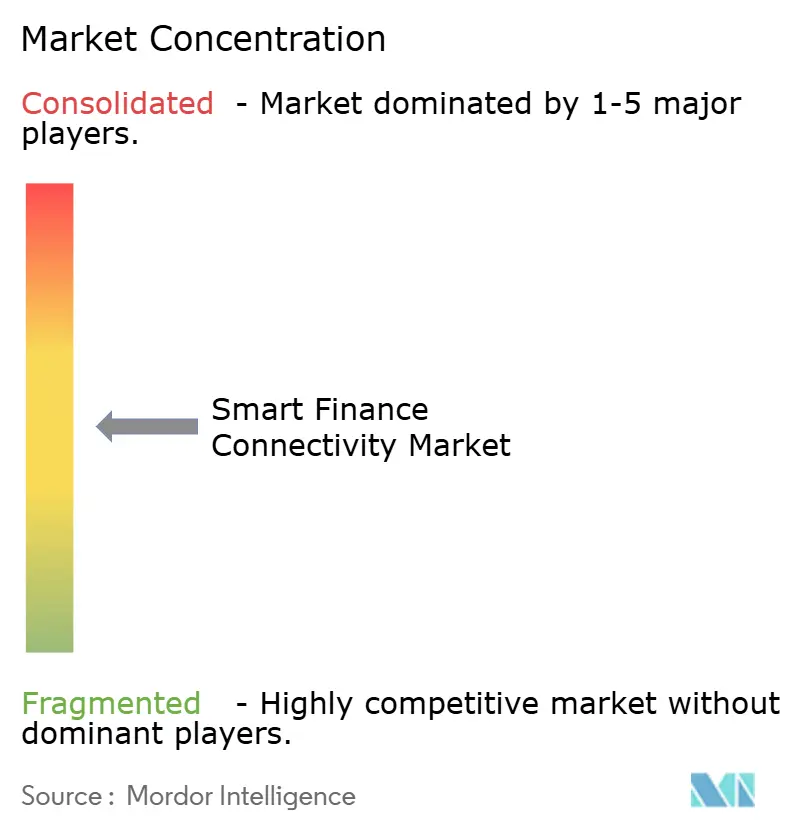
| Market Concentration | Medium |
Major Players *Disclaimer: Major Players sorted in no particular order Image © Mordor Intelligence. Reuse requires attribution under CC BY 4.0. | |
Smart Finance Connectivity Market Analysis by Mordor Intelligence
The smart finance connectivity market size is projected to be USD 12.06 billion in 2025, USD 14.21 billion in 2026, and reach USD 32.43 billion by 2031, growing at a CAGR of 17.94% from 2026 to 2031. Rising regulatory mandates for open banking, the proliferation of real-time payment rails, and artificial-intelligence-powered application programming interfaces are rewiring how capital, data, and authentication flow between banks, fintechs, and software platforms. Enterprises across regions are embedding payment, lending, and identity services directly into e-commerce, mobility, and software-as-a-service workflows, compressing the distance between a customer action and a financial transaction. Competitive intensity has sharpened as horizontal multi-rail platforms and vertical specialists race to become the connective tissue for programmable finance. Operational resilience, data portability, and zero-trust security are now table-stakes capabilities rather than differentiators, raising the execution bar for incumbents and new entrants alike.
Key Report Takeaways
- By connectivity technology, payments and digital wallets held 30.75% of the smart finance connectivity market share in 2025. However, the account-to-account connectivity segment is the fastest-growing connectivity segment, advancing at an 18.79% CAGR through 2031.
- By deployment mode, cloud solutions commanded 58.94% of the smart finance connectivity market share in 2025 and also posted the highest growth, expanding at an 18.63% CAGR between 2026 and 2031.
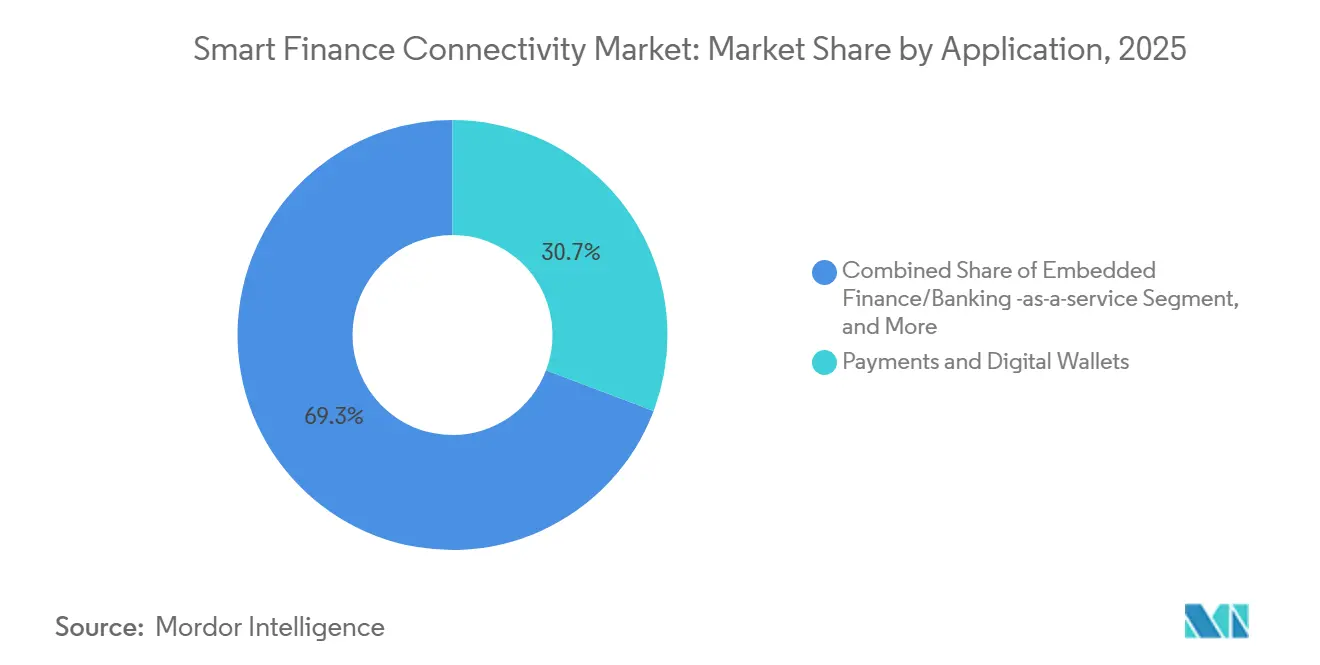
- By application, payments and digital wallets accounted for 30.75% of the smart finance connectivity market size in 2025, whereas embedded finance and banking-as-a-service applications led growth with a 19.12% CAGR to 2031.
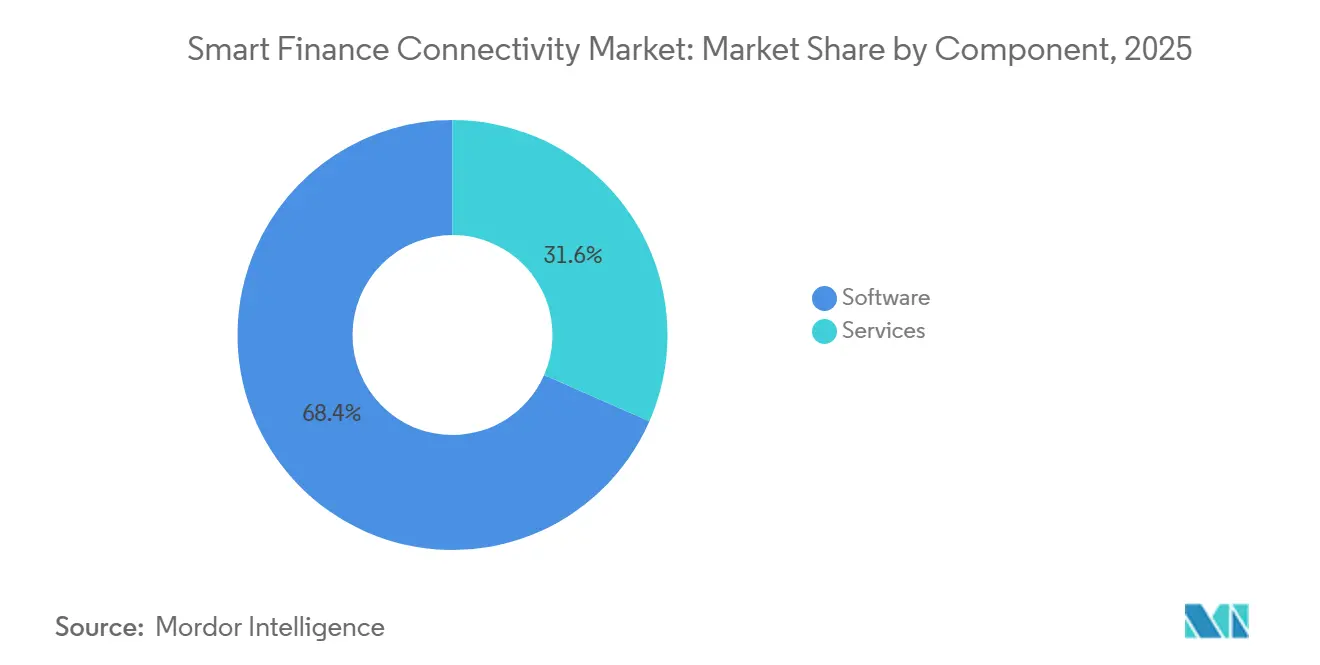
- By component, software dominated with 68.43% of the smart finance connectivity market share in 2025. However, services represented the fastest-growing component, registering an 18.54% CAGR during 2026-2031.
- By end user, banks held 38.43% of the smart finance connectivity market share in 2025, whereas, merchants and digital platforms were the quickest adopters, expanding at a 19.09% CAGR to 2031.
- By geography, North America led with 40.32% of the smart finance connectivity market share in 2025.However, Asia-Pacific is the fastest-growing region, projected to advance at a 19.18% CAGR through 2031.
Note: Market size and forecast figures in this report are generated using Mordor Intelligence’s proprietary estimation framework, updated with the latest available data and insights as of January 2026.
Global Smart Finance Connectivity Market Trends and Insights
Drivers Impact Analysis*
| Driver | (~) % Impact on CAGR Forecast | Geographic Relevance | Impact Timeline |
|---|---|---|---|
| Proliferation of Open Banking Regulations | +4.2% | Global (EU, UK, Brazil, UAE, India leading) | Medium term (2-4 years) |
| Rapid Rollout of 5G Networks Enabling Real-Time Financial Data | +2.8% | APAC core, North America, GCC | Short term (≤ 2 years) |
| Integration of AI-Powered APIs for Hyper-Personalized Banking | +3.5% | North America, Western Europe, China | Medium term (2-4 years) |
| Accelerated Digital Payments Adoption Among SMEs | +3.1% | Global, strongest in South America, South Africa, India, Southeast Asia | Short term (≤ 2 years) |
| Demand for Embedded Finance in Non-Financial Apps | +4.0% | North America, Europe, APAC | Medium term (2-4 years) |
| Rise of Decentralized Identity Standards in Financial Services | +2.3% | EU, North America, Singapore, UAE | Long term (≥ 4 years) |
| Source: Mordor Intelligence | |||
Proliferation of Open Banking Regulations
Mandatory data-sharing frameworks are synchronizing banking, payments, and wealth information through standardized APIs, but execution remains uneven across jurisdictions. The revised Payment Services Directive 3 in the European Union expands coverage to insurance and investment accounts, forcing incumbent banks to expose multi-asset data sets by 2027.[1]European Parliament, “Digital Operational Resilience Act,” europarl.europa.eu In the United States, the Consumer Financial Protection Bureau finalized Section 1033 in 2024, granting consumers the right to portable financial data yet delegating technical standards to private consortia, thereby extending negotiations over API schemas. Brazil’s PIX Automático, launched in 2025, proved that regulatory clarity drives merchant adoption, settling 5.71 billion transactions in one month.[2]Central Bank of Brazil, “PIX Instant Payment System Statistics,” bcb.gov.br The United Arab Emirates reinforced the trend when Abu Dhabi Islamic Bank became the first Sharia-compliant institution to roll out certified open-finance APIs in 2026.[3]Abu Dhabi Islamic Bank, “ADIB Implements Open Finance Under AlTareq,” adib.ae Collectively, these mandates compress innovation cycles and expand the addressable smart finance connectivity market.
Rapid Rollout of 5G Networks Enabling Real-Time Financial Data
Ultra-low-latency 5G coverage permits fraud-detection engines and biometric authenticators to run at the network edge, unlocking sub-second authorization for high-value purchases. South Korea and China already cover more than 90% of urban populations, enabling financial-services firms to embed risk scoring directly in point-of-sale hardware. However, rural and tier-2 cities in emerging markets still rely on legacy networks, obliging platforms to maintain dual-mode APIs that switch between real-time and asynchronous settlement. The resulting architectural complexity favors providers with flexible orchestration layers and accelerates demand for the smart finance connectivity market.
Integration of AI-Powered APIs for Hyper-Personalized Banking
Artificial intelligence has shifted from back-office automation to real-time decisions delivered in the API layer, with 98% of banks running active AI projects according to a 2024 Finastra survey. BNY Mellon embedded generative models into its digital-asset custody service, dynamically adjusting risk parameters on client instructions. Stripe trained a Payments Foundation Model on tens of billions of transactions, immediately lifting card-testing attack detection by 64% in 2025. The competitive moat now rests on proprietary datasets and model-governance rigor, making AI orchestration an integral growth lever for the smart finance connectivity market.
Demand for Embedded Finance in Non-Financial Apps
Platforms with large transaction flows are embedding accounts, payments, and credit without pursuing full banking licenses, recasting finance as a feature rather than a standalone destination. Stripe’s Agentic Commerce Suite lets merchants sell through multiple AI agents via one integration, abstracting the complexity of agent-specific APIs. Adyen’s Capital product ties loan servicing to real-time payment inflows, lowering default probabilities and reshaping risk models. As non-financial brands monetize payments and lending, the smart finance connectivity market deepens, and incumbents must defend transactional relevance.
Restraints Impact Analysis*
| Restraint | (~) % Impact on CAGR Forecast | Geographic Relevance | Impact Timeline |
|---|---|---|---|
| Fragmented Legacy Core Banking Systems | -3.8% | Global, acute in mature markets | Long term (≥ 4 years) |
| Growing Cybersecurity and Data Privacy Concerns | -2.9% | Global, heightened in EU, North America, China | Short term (≤ 2 years) |
| High Compliance Costs in Multi-Jurisdictional Deployments | -2.2% | Cross-border platforms in EU, UK, US, APAC | Medium term (2-4 years) |
| Limited Interoperability Between Proprietary Fintech Platforms | -1.7% | Highest in APAC, Middle East and Africa, South America | Medium term (2-4 years) |
| Source: Mordor Intelligence | |||
Fragmented Legacy Core Banking Systems
Core modernization remains a multi-year, high-risk endeavor. An October 2025 EY study showed that 92% of banks had launched transformation programs, yet half opted for “hollow-the-core” hybrids that retain mainframes for records while exposing cloud APIs for customers. This dual mode introduces latency and data-synchronization errors that can negate cloud savings when real-time settlement is required. Full replacement projects, such as Egypt’s MIDBANK “big-bang” migration completed in 2025, are exceptions rather than the norm and highlight execution risk. The drag on agility curbs the adoption velocity of the smart finance connectivity market.
Growing Cybersecurity and Data Privacy Concerns
Expanding API perimeters enlarge the attack surface faster than security teams can deploy zero-trust controls. The January 2026 Betterment breach exposed 1.4 million accounts through a third-party SaaS flaw, emphasizing supplier-chain vulnerabilities. Verizon’s 2025 Data Breach Investigations Report noted that 88% of web-app compromises involved stolen credentials, not zero-day exploits. Penalties under GDPR can reach 4% of global revenue, and Europe’s Digital Operational Resilience Act now extends oversight to critical third-party tech providers. Elevated compliance and remediation costs temper the smart finance connectivity market’s near-term growth.
*Our forecasts treat driver/restraint impacts as directional, not additive. The impact forecasts reflect baseline growth, mix effects, and variable interactions.
Segment Analysis
By Component: Services Close The Gap On Software Adoption
Services captured momentum with an 18.54% CAGR between 2026 and 2031 while software retained a 68.43% share of the smart finance connectivity market size in 2025. Mid-tier banks, credit unions, and digitally curious merchants lack in-house engineering capacity, so they outsource multi-jurisdictional regulatory updates, partner onboarding, and continuous API orchestration to managed-service providers. This need for operational muscle has reshaped vendor revenue mixes, tilting toward consumption-based models that scale with transaction volumes. Software, although dominant, is migrating from monolithic licenses to composable, API-first modules refreshed every three to five years. Low-code orchestration tools are lowering entry barriers for business users, yet they commoditize baseline platform layers, pushing vendors to differentiate through embedded analytics and pre-certified compliance bundles.
The services surge emphasizes the strategic value of operational resilience in the smart finance connectivity market. As enterprise clients demand guaranteed uptime, sub-second latency, and always-current regulatory mappings, providers offering round-the-clock monitoring and automated DevSecOps pipelines gain share. Conversely, legacy license vendors risk margin compression unless they pivot to recurring, outcome-based service agreements. This shift underscores why investors evaluate gross-profit retention, not bookings, when benchmarking smart finance connectivity industry valuations.


By Connectivity Technology: Account-To-Account Rails Gain Traction
Account-to-account infrastructure is expanding at 18.79% CAGR, challenging longstanding card-rail dominance. Visa’s February 2026 acquisition of Prisma and Newpay signals a strategic hedge, combining real-time payments and ATM networks with tokenization engines to preserve relevance as merchants pursue interchange-free transfers. Brazil’s PIX processed 5.71 billion December 2024 transactions with 99.96% availability, proving that large-scale A2A systems can rival card reliability at lower cost. Data-aggregation APIs, identity layers, and consent frameworks still represent smaller revenue pools, yet rising decentralized-identity adoption positions them for future growth. Vendors capable of orchestrating ISO 20022 messages, W3C decentralized identifiers, and proprietary bank formats within one dashboard will control critical choke points in the smart finance connectivity market.
Open-banking and financial APIs held a 34.75% share in 2025 and remain foundational, but merchants and fintechs increasingly demand bundled multi-rail connectors that abstract underlying schemes. Competitive intensity is sharpening as cloud hyperscalers bundle payment gateways with analytics, and card networks inject risk-scoring and credential-on-file token services into A2A propositions. The resulting convergence blurs lines between data aggregation, payments, and identity, reaffirming the programmable nature of the smart finance connectivity market.
By Deployment Mode: Cloud First, Yet Hybrid Holds Ground
Cloud deployments commanded 58.94% of the smart finance connectivity market in 2025 and is scaling at 18.63% CAGR. Greenfield fintechs, neobanks, and platform businesses launch on AWS, Google Cloud, or Microsoft Azure to exploit pre-certified compliance zones and modular microservices. Large incumbents, however, carry heavy technical debt, so half adopt a “hollow-the-core” strategy that overlays cloud-native APIs atop on-prem mainframes, trading full migration risk for incremental agility. Data-residency mandates in China, Russia, and parts of the Middle East and Africa perpetuate on-prem deployments, anchoring hybrid models for the foreseeable future.
Hybrid complexity opens services revenue opportunities for observability tooling, latency optimization, and automated data-synchronization engines. Vendors promising single-pane-of-glass visibility across cloud and on-prem stacks enjoy pricing leverage. At the same time, sovereign-cloud initiatives in Europe and Asia encourage regional providers to differentiate on jurisdictional compliance, fragmenting the supply side of the smart finance connectivity market.
By Application: Embedded Finance Leads Growth Metrics
Embedded finance and banking-as-a-service applications lead with a 19.12% CAGR through 2031, elevating the smart finance connectivity market size captured by non-bank platforms that monetize programmable money. Stripe’s Open Issuance enables any enterprise to issue bespoke stablecoins backed by tier-one custodians, allowing treasurers to manage liquidity programmatically and settle cross-border obligations in minutes. Adyen extends revenue streams by underwriting working-capital advances, recovering repayments from incoming payments to curb default risk.
Traditional payments and digital wallets remain the largest application and accounted for 30.75% of the market share in 2025, but face slower growth as saturation in mature markets caps incremental transaction volumes. Lending, credit, wealth, and insurance connectivity lines are each leveraging aggregated transaction data to launch context-aware offers at the point of need. Regulatory risk and compliance management tools continue to sell as cross-border deployments multiply and reporting obligations increase. Overall, application diversification cements the centrality of the smart finance connectivity market to every digital customer journey.

By End User: Merchants And Digital Platforms Accelerate Adoption
Merchants and digital platforms are expanding at a 19.09% CAGR, integrating payment acceptance, settlement, and credit into e-commerce, ride-hailing, and software marketplaces. Fiserv’s partnership with Sumitomo Mitsui introduces Clover solutions to millions of Japanese small businesses and supports Tokyo’s target to hit 65% cashless usage by 2030. Mastercard and PayPal co-developed One Credential to tailor consumer payment preferences, illustrating collaboration between card networks and super-apps.
Banks still hold 38.43% share as the largest end-user cohort, but lag in growth because core-system inertia slows product rollouts. Fintechs, insurance carriers, asset managers, and marketplaces adopt connectivity platforms to streamline settlements, enable real-time risk scoring, and unlock ancillary revenue. This democratization underlines the thesis that every enterprise can become a financial-services distributor, reinforcing long-run demand for the smart finance connectivity market.
Geography Analysis
North America led with 40.32% smart finance connectivity market share in 2025. The U.S. ride is powered by FedNow instant settlement and the CFPB Section 1033 data-portability rule, which forces data holders to expose consumer-permissioned interfaces. Market dynamics divide along bank-built proprietary networks and fintech aggregators such as Plaid that normalize data across institutions. Canada and Mexico experience adjacent growth via remittance flows and corridor-based innovations, yet regulatory alignment with the United States remains partial.
Asia-Pacific is the fastest-rising territory, advancing at 19.18% CAGR through 2031 as India’s UPI scales internationally and China’s digital yuan surpasses CNY 16.7 trillion (USD 2.3 trillion) in cumulative throughput by November 2025. Regional regulators synchronize QR standards and explore multilateral clearing, exemplified by Project Nexus and Alipay+ trials. Japan, South Korea, and Australia progress open-banking frameworks, while Southeast Asian economies prioritize instant cross-border payments to support tourism and gig-economy wages. These initiatives broaden the revenue pool for the smart finance connectivity market.
Europe sustains steady adoption, propelled by PSD3 drafts tightening liability and broadening scope to wealth accounts. The Berlin Group’s NextGenPSD2 standard reduces cross-border integration costs, and EU-wide EUDI digital-identity wallets promise seamless know-your-customer workflows. South America’s growth centers on Brazil’s PIX system and Argentina’s modernization after Visa’s Prisma acquisition. The Middle East and Africa show emerging potential; Abu Dhabi Islamic Bank’s open-finance roll-out under AlTareq and South Africa’s interoperability mandate illustrate regulatory momentum. Collectively, geographic divergence in policy and infrastructure drives nuanced go-to-market strategies within the smart finance connectivity market.

Competitive Landscape
The smart finance connectivity market is moderately fragmented, with horizontal multi-rail providers such as Stripe, Adyen, and Fiserv competing against vertical specialists that embed finance into niche workflows. Visa’s takeover of Prisma and Newpay folds real-time rails and ATM networks into the card giant’s stack, a defensive move as merchants migrate to account-to-account transfers. Mastercard’s USD 300 million minority stake in Corpay integrates currency-risk and large-ticket payments into its clearing network, signaling convergence between treasury functions and payment acceptance.
Strategic alliances increasingly center on agentic commerce and tokenization frameworks. Fiserv and Visa are rolling out Trusted Agent Protocol to authenticate AI agents executing transactions, reflecting a pivot toward machine-initiated commerce. Stripe’s Open Issuance reinforces the firm’s ambition to own programmable liquidity layers, riding stablecoin issuance to diversify revenue beyond traditional payment processing. Smaller aggregators such as Plaid leverage open-banking APIs to stitch together long-tail banks for thousands of fintech apps, though Europe’s Digital Operational Resilience Act could raise compliance thresholds that favor well-capitalized incumbents.
White-space opportunities persist in cross-border stablecoin settlement, decentralized-identity verification, and AI-centric discovery engines. Providers that master multi-jurisdiction compliance and latency-optimized orchestration will shape market structure. Overall, top players command meaningful share, but rapid innovation and regulatory flux prevent concentration from exceeding oligopolistic levels, sustaining healthy rivalry across the smart finance connectivity market.
Smart Finance Connectivity Industry Leaders
Visa Inc.
Mastercard Inc.
PayPal Holdings Inc.
Ripple Labs Inc.
Fidelity National Information Services Inc.
- *Disclaimer: Major Players sorted in no particular order

Recent Industry Developments
- February 2026: Visa completed the acquisition of Prisma Medios de Pago and Newpay, strengthening multi-rail capabilities in Argentina.
- January 2026: Fiserv and Affirm formed an exclusive partnership to add pay-over-time capabilities to thousands of debit programs.
- January 2026: Fiserv and Sumitomo Mitsui announced the upcoming launch of Clover in Japan, targeting small-business merchants.
- January 2026: Abu Dhabi Islamic Bank implemented open-finance APIs under the UAE AlTareq scheme, becoming the first Islamic bank to comply.


Global Smart Finance Connectivity Market Report Scope
Smart finance connectivity refers to the software, APIs, and cloud services that allow banks, fintechs, and software platforms to share data, move money in real time, and embed payment or lending functions directly inside non-financial applications.The growing use of Personal Finance Tools for budgeting, digital payments, expense tracking, and financial planning is further supporting demand for smart finance connectivity solutions.
The Smart Finance Connectivity Market Report is Segmented by Component (Software, and Services), Connectivity Technology (Open Banking APIs, A2A Connectivity, Payment Rails Integration, Financial Data Exchange and Aggregation, and Identity, Authentication and Consent Connectivity), Deployment (On-Premises, Cloud, and Hybrid), Application (Payments and Digital Wallets, Lending and Credit Services, Embedded Finance/Banking -as-a-service (BaaS), Wealth and Asset Management, Insurance Connectivity, Regulatory, Risk, and Compliance Management, and Personal and Business Financial Management Tools), End User (Banks, FinTechs, Insurance Companies, NBFIs, Merchants and Digital Platforms, and Enterprises and Marketplaces), and Geography (North America, South America, Europe, Asia-Pacific, and Middle East and Africa). The Market Forecasts are in Value (USD).
| Software |
| Services |
| Open Banking and Financial APIs |
| Account-to-Account (A2A) Connectivity |
| Payment Rails Integration |
| Financial Data Exchange and Aggregation |
| Identity, Authentication and Consent Connectivity |
| On-Premises |
| Cloud |
| Hybrid |
| Payments and Digital Wallets |
| Lending and Credit Services |
| Embedded Finance/Banking -as-a-service (BaaS) |
| Wealth and Asset Management |
| Insurance Connectivity |
| Regulatory, Risk, and Compliance Management |
| Personal and Business Financial Management Tools |
| Banks |
| FinTech Companies |
| Insurance Companies |
| Non-Banking Financial Institutions |
| Merchants and Digital Platforms |
| Enterprises and Marketplaces |
| North America | United States | |
| Canada | ||
| Mexico | ||
| South America | Brazil | |
| Argentina | ||
| Rest of South America | ||
| Europe | Germany | |
| United Kingdom | ||
| France | ||
| Italy | ||
| Spain | ||
| Rest of Europe | ||
| Asia-Pacific | China | |
| Japan | ||
| India | ||
| South Korea | ||
| Australia | ||
| Rest of Asia-Pacific | ||
| Middle East and Africa | Middle East | Saudi Arabia |
| United Arab Emirates | ||
| Turkey | ||
| Rest of Middle East | ||
| Africa | South Africa | |
| Egypt | ||
| Nigeria | ||
| Rest of Africa | ||
| By Component | Software | ||
| Services | |||
| By Connectivity Technology | Open Banking and Financial APIs | ||
| Account-to-Account (A2A) Connectivity | |||
| Payment Rails Integration | |||
| Financial Data Exchange and Aggregation | |||
| Identity, Authentication and Consent Connectivity | |||
| By Deployment Mode | On-Premises | ||
| Cloud | |||
| Hybrid | |||
| By Application | Payments and Digital Wallets | ||
| Lending and Credit Services | |||
| Embedded Finance/Banking -as-a-service (BaaS) | |||
| Wealth and Asset Management | |||
| Insurance Connectivity | |||
| Regulatory, Risk, and Compliance Management | |||
| Personal and Business Financial Management Tools | |||
| By End User | Banks | ||
| FinTech Companies | |||
| Insurance Companies | |||
| Non-Banking Financial Institutions | |||
| Merchants and Digital Platforms | |||
| Enterprises and Marketplaces | |||
| By Geography | North America | United States | |
| Canada | |||
| Mexico | |||
| South America | Brazil | ||
| Argentina | |||
| Rest of South America | |||
| Europe | Germany | ||
| United Kingdom | |||
| France | |||
| Italy | |||
| Spain | |||
| Rest of Europe | |||
| Asia-Pacific | China | ||
| Japan | |||
| India | |||
| South Korea | |||
| Australia | |||
| Rest of Asia-Pacific | |||
| Middle East and Africa | Middle East | Saudi Arabia | |
| United Arab Emirates | |||
| Turkey | |||
| Rest of Middle East | |||
| Africa | South Africa | ||
| Egypt | |||
| Nigeria | |||
| Rest of Africa | |||


Key Questions Answered in the Report
How big is the smart finance connectivity market size in 2026?
The market is valued at USD 14.21 billion in 2026 and is forecast to reach USD 32.43 billion by 2031 at a 17.94% CAGR.
Which connectivity technology is growing fastest?
Account-to-account payment rails are advancing at an 18.79% CAGR as merchants bypass card interchange fees and gain instant settlement.
Why is Asia-Pacific the fastest-growing region?
The region benefits from India’s UPI international rollout, China’s digital yuan scale-up, and widespread QR code standardization, driving a 19.18% CAGR through 2031.
What role does embedded finance play?
Embedded finance and banking-as-a-service applications are the leading use case, expanding at 19.12% CAGR as e-commerce, mobility, and SaaS firms integrate payments and credit natively.
How are banks addressing legacy-system constraints?
Roughly half are adopting a “hollow-the-core” model that keeps mainframes for records while exposing cloud-native APIs for customer-facing services, balancing modernization speed with operational risk.
Page last updated on:


