
Singapore Plastic Waste Management Services Market Size and Share
Market Overview
| Study Period | 2020 - 2031 |
|---|---|
| Forecast Data Period | 2026 - 2031 |
| Base Year Market Size (2025) | USD 0.26 Billion |
| Market Size (2026) | USD 0.27 Billion |
| Market Size (2031) | USD 0.36 Billion |
| Growth Rate (2026 - 2031) | 5.92 % |
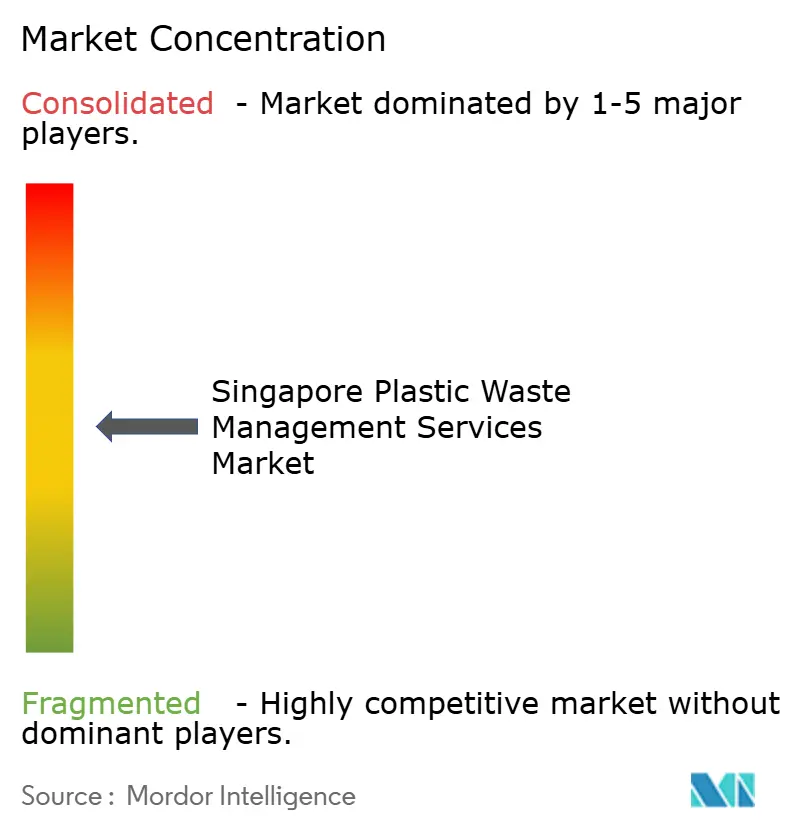
| Market Concentration | Medium |
Major Players *Disclaimer: Major Players sorted in no particular order Image © Mordor Intelligence. Reuse requires attribution under CC BY 4.0. | |
Singapore Plastic Waste Management Services Market Analysis by Mordor Intelligence
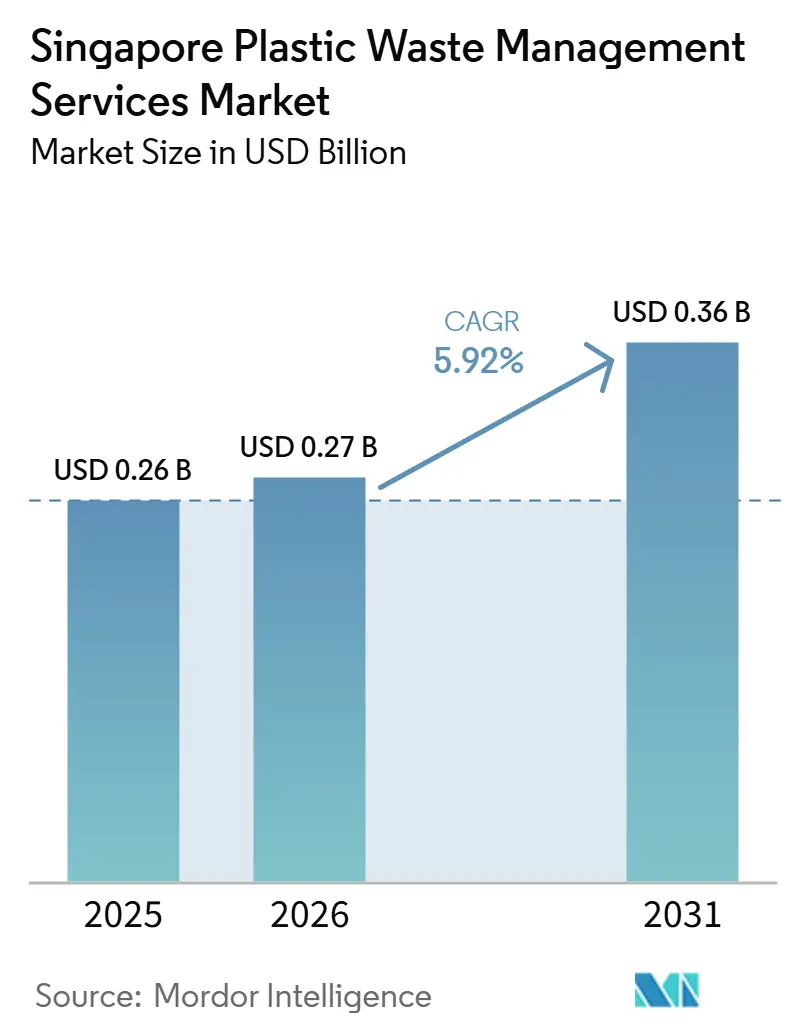
The Singapore Plastic Waste Management Services Market size is projected to expand from USD 0.26 billion in 2025 and USD 0.27 billion in 2026 to USD 0.36 billion by 2031, registering a CAGR of 5.92% between 2026 to 2031.
The Singapore plastic waste management services market is moving toward a more formal recovery model, with the Beverage Container Return Scheme starting on 1 April 2026 and introducing a dedicated collection system for plastic beverage containers, along with producer funding obligations that did not previously exist at this scale. The Singapore plastic waste management services market also remains under pressure, as plastic recycling was only 4% in 2025, while most plastic still moved through incineration or export-linked channels rather than domestic recovery pathways. The launch of the SGD 35 million (USD 26.8 million) TREASURES center and the broader grant support available through NEA (National Environment Agency) are widening the opportunities for advanced sorting, treatment, and resource recovery services within the Singapore plastic waste management services market. Competitive activity is also strengthening as infrastructure investors and strategic operators commit capital to licensed collection businesses and technology-led service platforms, which supports longer revenue visibility in the Singapore plastic waste management services market. At the same time, Semakau Landfill’s projected capacity limit around 2035 and the ongoing Zero Waste Masterplan review keep regulatory urgency high, which should continue to favor service providers that can help move plastic away from disposal and toward traceable recovery channels.
Key Report Takeaways
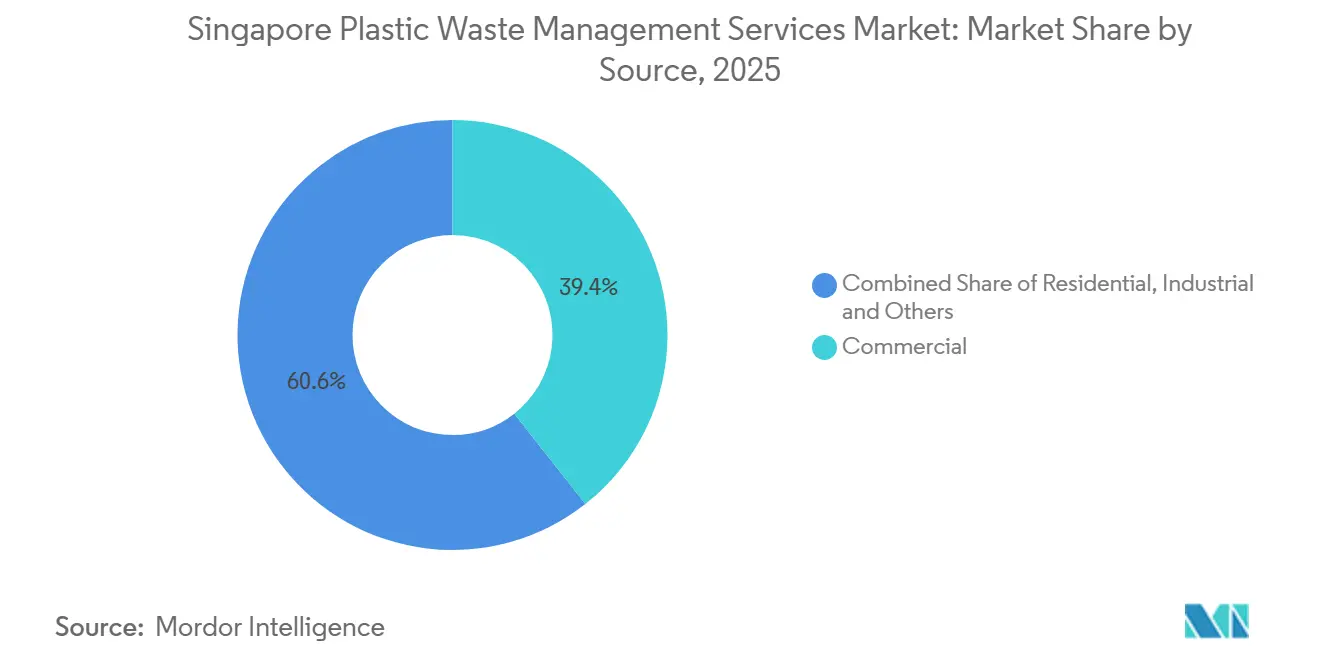
- By source, commercial accounted for 39.40% of revenue in 2025 and is also forecast to expand at a 6.60% CAGR through 2031.
- By service provider, public or municipal held 49.42% of the Singapore plastic waste management services market share in 2025, while private waste management companies recorded the highest projected 7.10% CAGR through 2031.
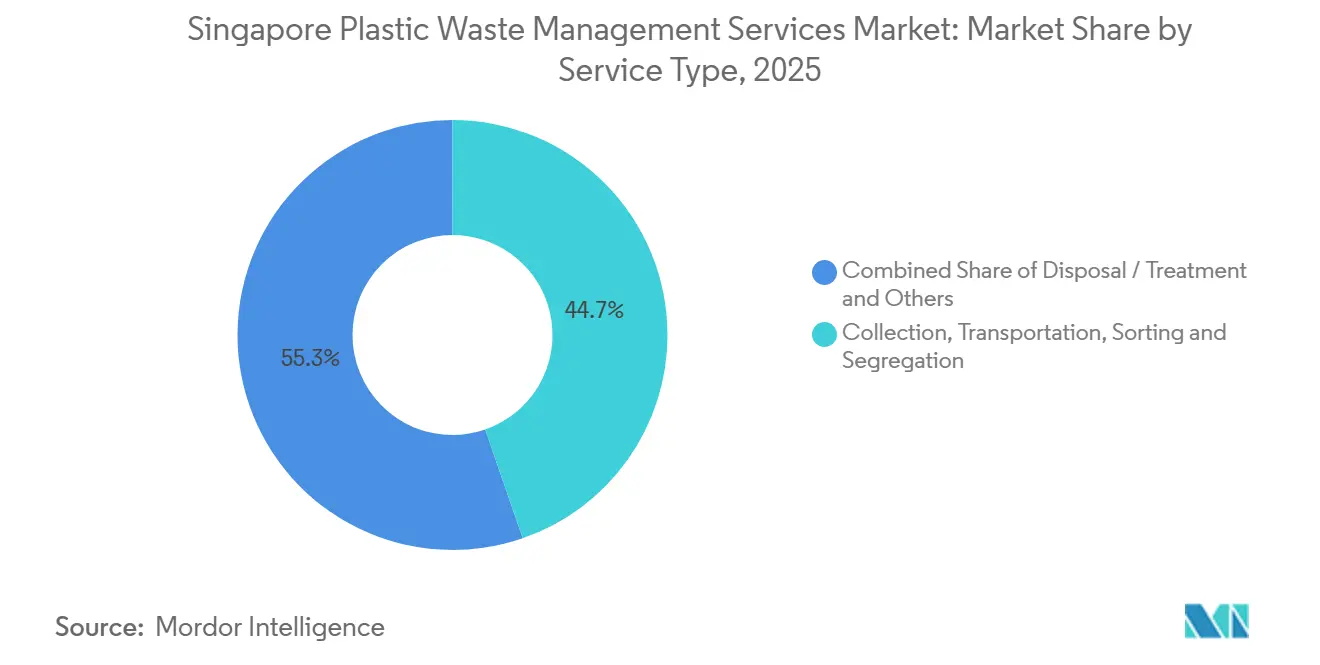
- By service type, collection, transportation, sorting and segregation accounted for 44.70% share of the Singapore plastic waste management services market size in 2025, while disposal and treatment is projected to expand at a 7.60% CAGR through 2031.
Note: Market size and forecast figures in this report are generated using Mordor Intelligence’s proprietary estimation framework, updated with the latest available data and insights as of January 2026.
Singapore Plastic Waste Management Services Market Trends and Insights
Drivers Impact Analysis*
| Driver | (~) % Impact on CAGR Forecast | Geographic Relevance | Impact Timeline |
|---|---|---|---|
| Beverage Container Return Scheme Implementation | +1.2% | National, concentrated in high-density HDB residential zones and commercial corridors. | Short term (≤ 2 years) |
| Government Funding for Circular Economy and Recycling Innovation | +1.0% | National, with early gains in research clusters at Tuas Nexus, NTU, and NUS campuses | Medium term (2-4 years) |
| Reverse Vending Machine Network Expansion | +0.9% | National, prioritized HDB estates, hawker centers, and mandated supermarket locations. | Short term (≤ 2 years) |
| Mandatory Packaging Reporting for Producers | +0.8% | National, covering all companies with an annual turnover above SGD 10 million (USD 7.7 million) and annual packaging use above 10 tonnes | Medium term (2-4 years) |
| Circular Packaging Initiatives by FMCG Companies | +0.7% | National, concentrated among multinationals in industrial and retail clusters. | Medium term (2-4 years) |
| Rising Plastic Waste from Food Delivery and Convenience Retail | +0.5% | National, concentrated in the Central Business District, suburban commercial nodes, and hawker center clusters. | Short term (≤ 2 years) |
| Source: Mordor Intelligence | |||
Implementation of the Beverage Container Return Scheme (BCRS)
The Singapore plastic waste management services market is seeing its clearest operational shift through the Beverage Container Return Scheme, which began on 1 April 2026 under regulations issued under the Resource Sustainability Act 2019.[1]Singapore Statutes Online, “Resource Sustainability (Beverage Container Return Scheme) Regulations 2026,” Singapore Statutes Online, sso.agc.gov.sg The scheme applies a SGD 0.1 deposit (USD 0.08), on plastic and metal beverage containers ranging from 150 ml to 3,000 ml, providing the system with a direct financial mechanism to improve returns and material traceability. BCRS Ltd., the licensed not-for-profit operator, is responsible for collection, sorting, and recycling on behalf of producers, and around 800 companies representing more than 95% of market volume were registered or in the process of registration as of March 2026. This matters for the Singapore plastic waste management services market because it creates a cleaner PET stream outside the mixed blue-bin system, thereby improving feedstock quality and supporting dedicated transport and aggregation work for service providers. NEA targets a 60% return rate in 2026 and 80% by 2029, which means the scheme can quickly lift formal plastic collection volumes and also shape the design of future producer responsibility rules beyond beverage packaging.[2]National Environment Agency, “Solid Waste Management Infrastructure,” National Environment Agency, nea.gov.sg
Government Funding for Circular Economy and Recycling Innovation
The Singapore plastic waste management market is also gaining support from direct public funding aimed at building circular-economy capacity and advancing treatment innovation. NEA and NTU launched the TREASURES Centre in June 2026 with SGD 35 million (USD 26.8 million) under the Closing the Resource Loop Funding Initiative, and the centre runs from January 2026 to March 2030. The centre brings together NTU, NUS, and other higher education institutions, providing the country with a formal platform to advance waste research toward operational use in treatment systems. In parallel, NEA’s 3R Fund can co-fund up to 80% of qualifying waste reduction and recycling projects, with support capped at SGD 1 million (USD 0.8 million) per project, which lowers the entry barrier for pilots and mid-scale process upgrades. This funding mix helps the Singapore plastic waste management services market move beyond collection alone and toward sorting improvement, treatment design, and higher-value resource recovery. It also supports a gradual shift away from an export-heavy model toward greater domestic processing capacity, which is important because current recycling flows still rely heavily on overseas markets.[3]Ministry of Sustainability and the Environment, “Oral Reply to Parliamentary Question on Beverage Container Return Scheme,” Ministry of Sustainability and the Environment, mse.gov.sg
Expansion of Reverse Vending Machine (RVM) Network
The rollout of reverse vending machines is creating a visible collection network that did not previously exist at a national scale in the Singapore plastic waste management services market. More than 1,070 RVMs were deployed by 1 April 2026 across supermarkets, HDB void decks, and hawker centers, and the system covered more than 90% of HDB households within a five-minute walk at launch. NEA’s factsheet states that the network is set to expand to 2,000 return points within the first year, based on return patterns and community feedback, which means collection infrastructure is likely to deepen quickly in the highest-density zones. That physical network matters because it separates beverage container flows from the mixed blue-bin stream, where contamination has remained near 40%, making recycling outcomes more commercially viable. Refund options through SimplyGo EZ-Link cards, DBS PayLah, and concession cards also widen participation and improve usability for different user groups. For operators, the RVM system creates new work in machine servicing, route planning, container consolidation, and data-led deployment decisions, all of which add depth to the Singapore plastic waste management services market.
Mandatory Packaging Reporting for Producers
Mandatory Packaging Reporting is a quieter but important demand driver in the Singapore plastic waste management services market. Under the Resource Sustainability Act 2019, companies with annual turnover above SGD 10 million(USD 7.7 million) and annual packaging use above 10 tonnes must submit annual packaging reports and 3R plans to NEA. The amended packaging reporting regulations took effect on 1 July 2025, and calendar year 2025 data was due by 31 March 2026, which means the compliance base is already active and current. The reporting framework matters because it builds the packaging dataset needed for a broader, extended producer responsibility structure beyond beverage containers. Once general plastic packaging enters a broader EPR regime, producers are likely to rely more on external firms for collection, audit, recycling verification, and reporting support. That would widen the revenue base for certified private operators and strengthen the compliance-linked side of the Singapore plastic waste management services market.
Restraints Impact Analysis*
| Restraint | (~) % Impact on CAGR Forecast | Geographic Relevance | Impact Timeline |
|---|---|---|---|
| Heavy Dependence on Waste-To-Energy Incineration | -0.7% | National, affecting all waste zones served by four active WTE plants across Tuas and Senoko | Long term (≥ 4 years) |
| Limited Land Availability for Recycling Infrastructure | -0.5% | National, acutely felt in high-density residential zones and the Jurong industrial corridor. | Long term (≥ 4 years) |
| High Contamination in Household Plastic Waste | -0.4% | National, predominantly in HDB zones, dependent on commingled blue-bin collection | Medium term (2-4 years) |
| Dependence on Export or Specialized Processing for Certain Plastic Streams | -0.3% | National, with particular exposure in mixed-film, multilayer packaging, and post-consumer flexible plastics | Medium term (2-4 years) |
| Source: Mordor Intelligence | |||
Heavy Dependence on Waste-to-Energy Incineration
The Singapore plastic waste management services market still operates within a system in which incineration is the default treatment for a large share of waste. Singapore’s four active waste-to-energy plants process a combined 9,710 tonnes per day, and plastics remain useful to those plants because of their calorific value. That operating logic makes it harder to expand recycling because diverting plastic away from WTE does not always yield a stronger short-term economic outcome under the current system. The gap is evident in the data: plastic recycling was 4% in 2025, while the overall recycling rate was 52%. The first phase of the Integrated Waste Management Facility is planned to be progressively completed from 2027, adding further treatment capacity unless recycling and EPR measures grow in parallel. This keeps the Singapore plastic waste management services market more supportive of collection and WTE-adjacent services than of broad recycling growth in the near term.
Limited Land Availability for Recycling Infrastructure
Land scarcity remains a direct physical limit on how quickly the Singapore plastic waste management services market can expand recycling capacity. Singapore covers only 719 square kilometers, which restricts both the size and the number of sorting and treatment facilities that can be developed domestically. The Tuas integrated infrastructure model shows how tightly land use is managed, with waste and water assets co-located to improve space efficiency in one of the country’s main utility corridors. Land pressure also affects competition because firms with existing licensed sites have an advantage over new entrants, who face long approval timelines and high upfront capital requirements. Semakau Landfill covers 350 hectares and is projected to reach a capacity ceiling around 2035, adding urgency to upstream diversion without removing the land bottleneck for new recycling infrastructure. This means the Singapore plastic waste management services market is likely to reward operators that can extract more value from existing footprints rather than those that rely on large-scale new-site expansion.
*Our forecasts treat driver/restraint impacts as directional, not additive. The impact forecasts reflect baseline growth, mix effects, and variable interactions.
Segment Analysis
By Source: Commercial Sector Anchors Demand Amid F&B Packaging Growth
The commercial segment held 39.4% of the Singapore plastic waste management services market in 2025, making it the largest source category by value. This segment includes retail outlets, food and beverage establishments, hotels, shopping malls, and offices, where packaging use is concentrated, and waste generation is easier to document through formal contracts. Singapore’s dense food service and retail environment supports recurring volumes of single-use beverage containers, food packaging films, and retail plastics that are suitable for specialized collection programs. The Singapore plastic waste management services market, therefore, sees commercial locations as the most serviceable source base for formal contracts and traceable recovery routes.
That position is also supported by regulation and operating patterns. Since March 2024, large commercial and industrial food waste generators in new buildings have had to segregate, treat, and report food waste, which has improved waste stream documentation and strengthened collection visibility in mixed commercial settings. The industrial segment still contributes important volumes from Jurong Island and Tuas, especially industrial film and PP and PE materials that need specialized sorting. Residential plastic waste remains large in tonnage because around 80% of the population lives in HDB estates. Still, mixed household streams are lower in value and harder to recover because contamination stays high in blue-bin collection. In the Singapore plastic waste management services market, that mix leaves commercial waste as the clearest anchor for near-term service demand.



By Service Provider: Private Operators Gain Share as Regulatory Complexity Deepens
The Public or Municipal segment accounted for 49.4% of revenue in 2025, making it the largest among service provider categories in the Singapore plastic waste management services market. That lead reflects the mandatory structure of public waste collection licenses rather than the strongest long-term growth path. Private waste management companies are forecast to grow at a 7.1% CAGR through 2031, which makes them the fastest-expanding provider group. As compliance rules widen and waste handling becomes more specialized, more growth is shifting toward firms that can offer tailored treatment, reporting, and recovery solutions.
Private operators are already differentiating through technology, data tools, and service design. SembWaste, now Cora Environment, launched the Closed-Loop Partners Network in June 2024 and added MONA and LISA tools for waste baseline analysis and diversion planning, which moved the offer beyond basic hauling. Actis completed its 90% acquisition of 800 Super in March 2026, showing that institutional investors view licensed environmental services as durable infrastructure-backed businesses. The Others category also has a new role through producer responsibility organizations such as BCRS Ltd., and that role may widen further if broader packaging EPR rules are introduced. Within the Singapore plastic waste management services market, this keeps private and compliance-linked operators on a stronger forward path than the public tier’s current share leadership.
By Service Type: Disposal / Treatment Leads Growth as Resource Recovery Scales
Collection, transportation, sorting, and segregation accounted for 44.7% of the Singapore plastic waste management services market in 2025, making it the largest service type by current revenue. This reflects the basic operating reality of a dense city-state where collection frequency, routing efficiency, and segregation quality strongly affect downstream economics. Disposal and treatment are projected to grow at a 7.6% CAGR through 2031, which makes it the fastest-growing service type as recovery activity expands. The shift is closely linked to PET and aluminum flows from the BCRS (Beverage Container Return Scheme) network, as well as to the policy push to divert more plastic away from disposal channels.
Incineration remains the dominant treatment pathway by volume because of the existing WTE network, so the new growth sits on top of a disposal-heavy system rather than replacing it immediately. Landfill treatment remains limited because only incineration residue goes to Semakau, while chemical and other advanced plastic processing methods are still at an early stage in Singapore. The BCRS (Beverage Container Return Scheme) rollout also creates a new collection and transport substream for beverage container aggregation, with ALBA Circular Solutions already active for eastern Singapore return points. The Others category, which covers consulting, audit, and training, is also gaining relevance as Mandatory Packaging Reporting and future EPR rules create more demand for compliance support. In the Singapore plastic waste management services market, this means logistics still accounts for the bulk of current revenue, while treatment and compliance services are taking a larger share of incremental growth.
Geography Analysis
The Singapore plastic waste management services market served a USD 0.27 billion domestic opportunity in 2026 within a single city-state with one national regulator and one tightly bounded operating geography. Singapore generated 918,000 tonnes of plastic waste in 2024, and plastics accounted for a significant share of the national waste stream, even as total plastic volumes declined from 1,001,000 tonnes in 2022. Because the whole country is under one policy framework led by NEA and MSE, any change in recovery rules has direct island-wide revenue effects on the Singapore plastic waste management services market. That makes the market more sensitive to regulation than to regional differences in demand. It also means infrastructure rollouts, such as the BCRS network, scale nationally from day 1 instead of moving across separate provincial systems.
Within Singapore, waste generation still follows settlement density and industrial zoning. HDB estates house around 80% of the population and generate large flows of mixed residential plastics, which keep collection density high but recovery quality uneven, as commingled household streams remain contamination-prone. The Central Business District, Orchard Road, and Marina Bay concentrate commercial plastics from food service, retail, and hospitality, making them attractive zones for higher-purity capture and specialized contracts. Jurong Island and the Tuas corridor remain the main industrial anchors for packaging waste, supporting dedicated hauling and processing arrangements. The Singapore plastic waste management services market, therefore, has a clear spatial split between dense residential collection, concentrated commercial packaging flows, and industrial stream specialization.
Western Singapore also carries strategic weight because Tuas Nexus and the future Integrated Waste Management Facility will concentrate long-term treatment infrastructure in that corridor. Semakau Landfill’s projected limit around 2035 sets a hard time horizon for the whole system, strengthening the case for diversion and recovery across the Singapore plastic waste management services market. Export controls also matter because around 90% of recyclables are sent abroad for processing, so domestic recyclers remain exposed to overseas demand and import rules in receiving markets. This keeps geography in the Singapore plastic waste management services market centered on a single local jurisdiction, but one that remains closely linked to regional processing economics.
Competitive Landscape
The Singapore plastic waste management services market is moderately consolidated in collection, especially at the public waste collector tier, where 3 NEA-licensed operators hold sector-specific domestic mandates. That arrangement gives the licensed collection layer a stable foundation, while private firms compete more actively in commercial, industrial, and specialty treatment work. The Singapore plastic waste management services market is also attracting more institutional capital, as contracted environmental services are increasingly viewed as infrastructure-like assets with defensible cash flows. Actis completed its 90% acquisition of 800 Super in March 2026, reinforcing that view and tying ownership change directly to long-duration, government-backed revenues. In the same market, TBS Energi Utama had already completed the acquisition of SembWaste and Sembcorp Environment for SGD 405 million (USD 309.9 million) in March 2025, marking one of the largest private transactions in the sector.
Leading companies are increasingly competing on service depth rather than only on hauling scale. Cora Environment committed SGD 200 million (USD 153 million) over 5 years to facility upgrades, digital sustainability tools, and the expansion of circular-economy services after its rebrand in September 2025. Veolia Singapore launched the country’s first NEA-licensed PFAS treatment solution in January 2026, showing how regulation can open high-value niches that are harder for smaller operators to replicate. SembWaste’s earlier Closed-Loop Partners Network also demonstrated a shift toward platform-based matching, analytics, and diversion planning rather than just basic waste pickup. These moves show that the Singapore plastic waste management services market is rewarding technical capability, data visibility, and compliance support.
Opportunities remain in areas with limited local capacity. Mixed plastic recycling, treatment of more challenging plastic waste streams, and producer responsibility support services have not yet scaled broadly in the Singapore plastic waste management services market. At the same time, the market does not appear fully concentrated, as public mandates, private contracts, and new producer responsibility structures distribute revenue opportunities across different operating models. This balance gives the Singapore plastic waste management services market a stable licensed core and a more competitive outer layer, where specialized firms can still gain market share.
Singapore Plastic Waste Management Services Industry Leaders
Veolia Singapore
SembWaste Pte Ltd
ALBA Group Asia
800 Super Waste Management
Colex Holdings Limited
- *Disclaimer: Major Players sorted in no particular order

Recent Industry Developments
- June 2026: NEA and NTU jointly launched the TREASURES national research center, Singapore’s first facility for residue and toxic industrial waste, backed by SGD 35 million, USD 26.8 million, under the Closing the Resource Loop Funding Initiative, with NUS and other IHLs as key partners.
- June 2026: MSE announced a review of Singapore’s 2019 Zero Waste Masterplan, citing the overall recycling rate stabilizing at 52% in 2025 and the declining domestic recycling rate, with the review targeted for completion by 2027 and set to reassess recycling targets and strategies for extending Semakau Landfill’s lifespan beyond 2035.
- April 2026: Singapore’s BCRS commenced on 1 April 2026 with 1,070 RVMs deployed across HDB estates, hawker centers, and mandated supermarkets, targeting recovery of more than 16,000 tonnes of material annually from more than 1 billion beverage containers.
- April 2026: Income Insurance and WWF Singapore launched Eco Dabao, Singapore’s first multi-location return-and-reuse program for takeaway food and beverage containers in the Central Business District, running a 5-month pilot through September 2026 in partnership with Muuse.


Singapore Plastic Waste Management Services Market Report Scope
The Singapore Plastic Waste Management Services Market Report is Segmented by Source (Residential, Commercial, Industrial, and Others), by Service Provider (Public/Municipal, Private Waste Management Companies, and Others), by Service Type (Collection, Transportation, Sorting & Segregation, Disposal / Treatment, and Others). The Market Forecasts are Provided in Terms of Value (USD).
| Residential |
| Commercial (Retail, Office, etc.) |
| Industrial |
| Others (Institutional, Agricultural, etc) |
| Public/Municipal |
| Private Waste Management Companies |
| Others - Producer Responsibility Organizations (PROs), etc. |
| Collection, Transportation, Sorting & Segregation | |
| Disposal / Treatment | Landfill |
| Recycling & Resource Recovery | |
| Incineration & Waste-to-Energy | |
| Others (Chemical Treatment, etc.) | |
| Others (Consulting, Audit & Training, etc.) |
| By Source | Residential | |
| Commercial (Retail, Office, etc.) | ||
| Industrial | ||
| Others (Institutional, Agricultural, etc) | ||
| By Service Provider | Public/Municipal | |
| Private Waste Management Companies | ||
| Others - Producer Responsibility Organizations (PROs), etc. | ||
| By Service Type | Collection, Transportation, Sorting & Segregation | |
| Disposal / Treatment | Landfill | |
| Recycling & Resource Recovery | ||
| Incineration & Waste-to-Energy | ||
| Others (Chemical Treatment, etc.) | ||
| Others (Consulting, Audit & Training, etc.) | ||


Key Questions Answered in the Report
What is the 2031 value outlook for plastic waste services in Singapore?
The sector is forecast to reach USD 0.36 billion by 2031, up from USD 0.27 billion in 2026, reflecting a 5.92% CAGR over 2026-2031.
What is changing collection economics the most in 2026?
The BCRS launch is the main change because it introduced deposit-backed returns, more than 1,070 reverse vending machines, and a dedicated stream for plastic beverage containers.
Why is recycling still difficult despite strong policy support?
Plastic recycling was only 4% in 2025, while the system still relies heavily on incineration and export-linked processing of recyclables.
Which customer group creates the largest revenue base for service providers?
Commercial sources led in 2025 with 39.4% of revenue, supported by dense food service, retail, hospitality, and office packaging waste streams.
Which provider type is growing the fastest?
Private waste management companies are projected to grow the fastest at a 7.1% CAGR through 2031 as compliance and treatment requirements become more specialized.
Which service line is expanding the fastest?
Disposal and treatment are forecast to grow at a 7.6% CAGR through 2031, helped by resource recovery activity linked to BCRS and broader diversion goals.
Page last updated on:





