Singapore Global Capability Centers Market Size and Share
Market Overview
| Study Period | 2020 - 2031 |
|---|---|
| Forecast Data Period | 2026 - 2031 |
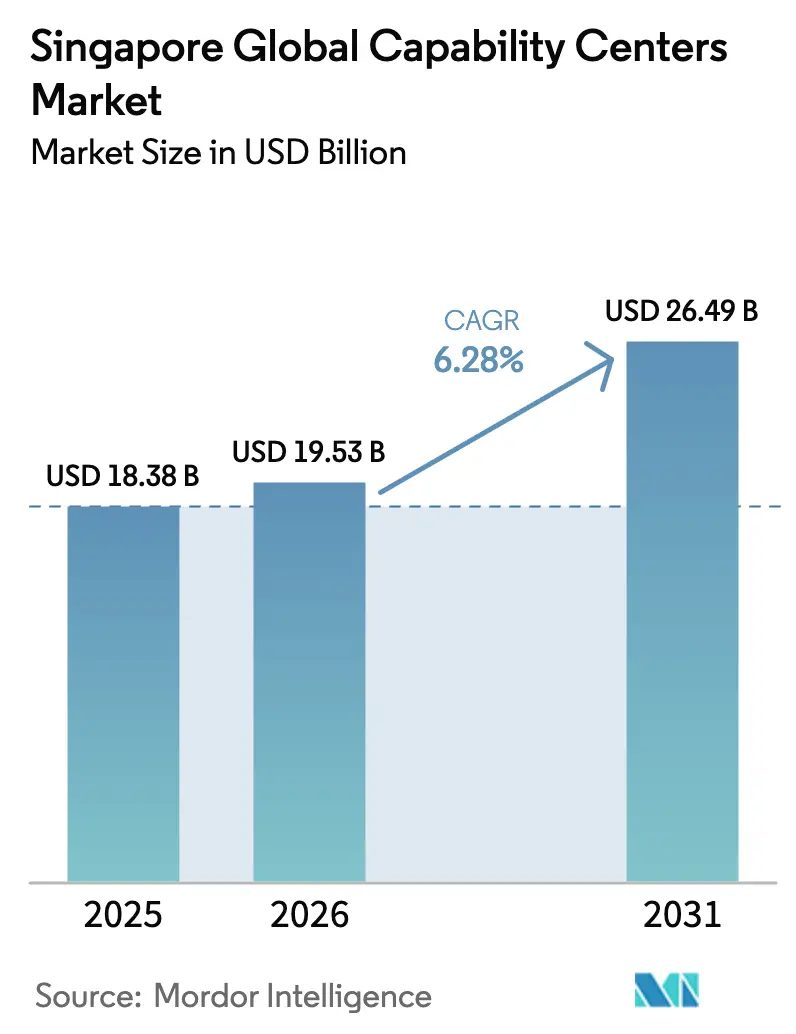
| Base Year Market Size (2025) | USD 18.38 Billion |
| Market Size (2026) | USD 19.53 Billion |
| Market Size (2031) | USD 26.49 Billion |
| Growth Rate (2026 - 2031) | 6.28% CAGR |
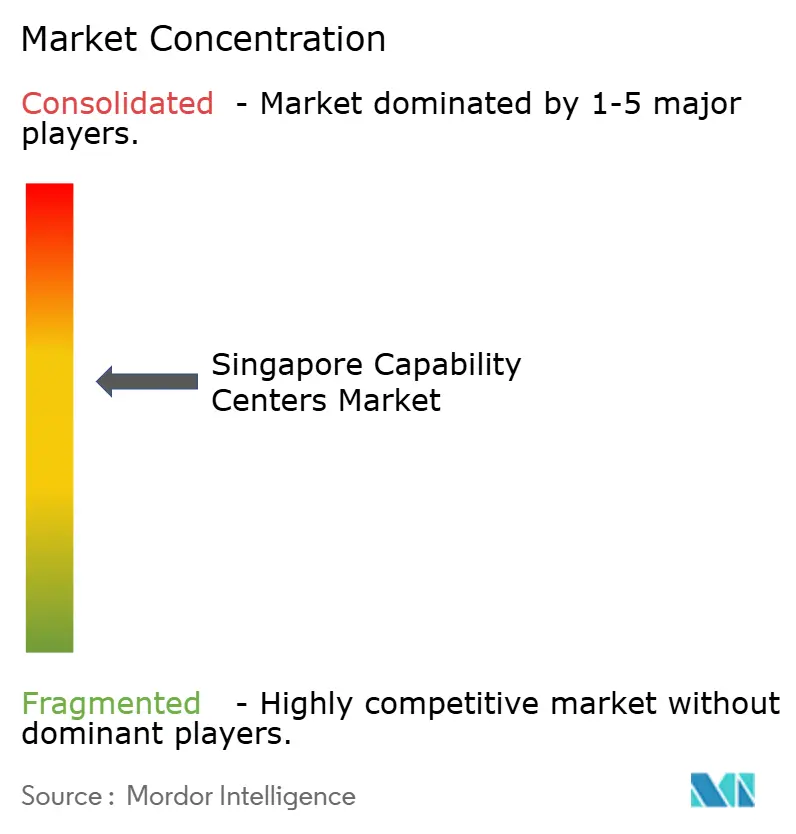
| Market Concentration | Medium |
Major Players *Disclaimer: Major Players sorted in no particular order Image © Mordor Intelligence. Reuse requires attribution under CC BY 4.0. | |
Singapore Global Capability Centers Market Analysis by Mordor Intelligence
Singapore Global Capability Centers market size in 2026 is estimated at USD 19.53 billion, growing from 2025 value of USD 18.38 billion with 2031 projections showing USD 26.49 billion, growing at 6.28% CAGR over 2026-2031. This growth is based on Singapore’s role as a strategic location for regional command centers, advanced analytics hubs, and digital innovation labs, which enable multinational corporations to manage their Asia Pacific operations in real-time. Robust government incentives, world-class digital infrastructure, and a strong intellectual property framework continue to propel the Singapore Global Capability Centers market on an upward trajectory, even as cost competition intensifies from neighboring ASEAN cities. High-value functions, such as artificial intelligence engineering, quantum computing, and sustainability analytics, drive premium engagement fees that offset rising labor and real estate costs. The market also benefits from the city-state’s extensive network of trade agreements and its neutral geopolitical stance, which together facilitate seamless cross-border data flows and compliance across multiple jurisdictions.
Key Report Takeaways
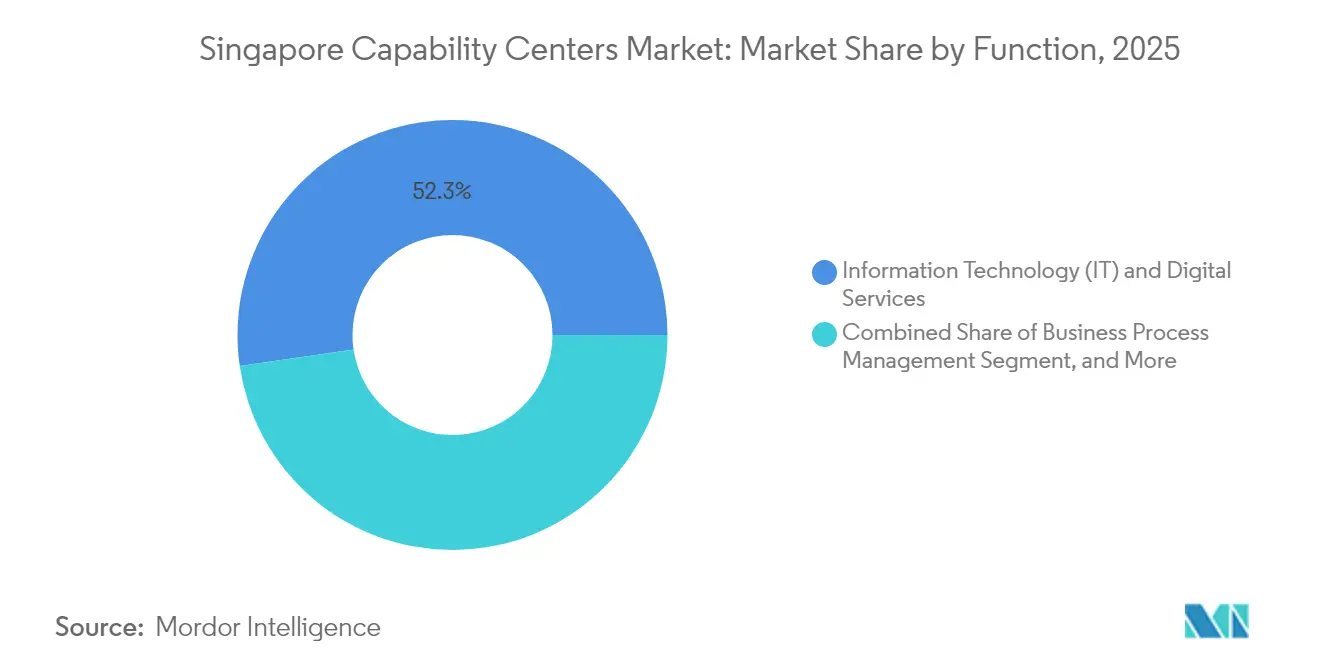
- By function, information technology and digital services led the Singapore Global Capability Centers market, accounting for a 52.31% share in 2025. Knowledge process outsourcing is projected to post the fastest growth, with a 6.61% CAGR through 2031.
- By engagement model, captive operations retained 59.12% of the Singapore Global Capability Centers market size in 2025, while hybrid build-operate-transfer structures are set to register the strongest 7.18% CAGR during the forecast window.
- By organization size, large enterprises controlled 87.95% of the Singapore Global Capability Centers market in 2025, whereas small and medium enterprises are projected to have the fastest growth at a 6.48% CAGR.
- By industry vertical, banking, financial services, and insurance held a commanding 38.55% revenue share in 2025; healthcare and life sciences are forecast to accelerate at a 6.52% CAGR through 2031.
Note: Market size and forecast figures in this report are generated using Mordor Intelligence’s proprietary estimation framework, updated with the latest available data and insights as of 2026.
Singapore Global Capability Centers Market Trends and Insights
Drivers Impact Analysis*
| Driver | (~) % Impact on CAGR Forecast | Geographic Relevance | Impact Timeline |
|---|---|---|---|
| Scarcity of tech talent in Western markets is driving nearshoring to Singapore | +1.8% | Global, primarily North America and Europe | Medium term (2-4 years) |
| Robust digital infrastructure and 5G rollout | +1.2% | National with regional spillovers | Short term (≤ 2 years) |
| Strong government grants for advanced analytics and AI centers | +1.5% | National | Medium term (2-4 years) |
| Favorable IP protection laws reassure multinational captives | +0.9% | Global, especially the tech and pharma sectors | Long term (≥ 4 years) |
| Rise of sustainability-linked GCC charters | +0.7% | Global | Long term (≥ 4 years) |
| Integration with Singapore’s deep-tech start-up sandbox | +0.6% | National | Medium term (2-4 years) |
| Source: Mordor Intelligence | |||
Scarcity of Tech Talent in Western Markets Driving Nearshoring to Singapore
Acute developer and data science shortages in North America and Europe have prompted corporations to establish regional hubs in Singapore, where 15,000 STEM graduates enter the workforce every year. Amazon’s USD 9 billion multiyear expansion underpins a broader movement that funnels cloud-engineering, quantum-computing, and cybersecurity roles into the city-state. The Employment Pass framework remains sufficiently flexible for high-value hiring, allowing firms to bridge advanced-skill gaps without breaching local headcount quotas. Singapore’s English-speaking environment, cultural affinity with Western business practices, and overlapping time zone coverage across Asian markets solidify the nation’s appeal. As a result, the Singapore Global Capability Centers market captures functions that would conventionally reside in Silicon Valley or London, safeguarding continuity and accelerating innovation.[1]Channel NewsAsia, “Amazon Web Services to invest USD 9 billion in Singapore by 2028,” channelnewsasia.com
Robust Digital Infrastructure and 5G Rollout
Singapore houses 87 data centers, accounting for over 60% of Southeast Asia’s combined capacity, which provides the low-latency backbone necessary for AI inference, high-frequency trading, and Industry 4.0 analytics. The government’s Green Data Centre Roadmap aims to add a further 300 MW of sustainable capacity, thereby enhancing energy resilience for new GCC tenants. Full 5G coverage supports edge computing and IoT ecosystems, enabling capability centers to orchestrate regional manufacturing plants, logistics corridors, and smart city pilots from a single control tower. This infrastructure heft anchors premium colocation rates yet justifies Singapore’s cost delta versus Malaysia or Vietnam because mission-critical workloads cannot tolerate network instability. Consequently, the Singapore Global Capability Centers market continues to secure latency-sensitive mandates from banking, aerospace, and med-tech multinationals.[2]Singapore Economic Development Board, “Consumer Businesses in Singapore: Gateway to Asian Markets,” edb.gov.sg
Strong Government Grants for Advanced Analytics and AI Centers
The Economic Development Board’s Research, Innovation and Enterprise scheme reimburses up to 70% of qualified R&D outlays, while Infocomm Media Development Authority offsets expenses for AI tooling, model training, and pilot deployment. Google’s USD 5 billion regional campus exemplifies how grants can narrow the cost gap compared to lower-cost hubs without compromising Singapore’s fiscal prudence. Incentives extend into talent development through partnerships with the National University of Singapore and A*STAR, creating a virtuous pipeline for data scientists and quantum engineers. These programs ensure that the Singapore Global Capability Centers market retains leadership in next-generation algorithm development, high-performance computing, and privacy-enhancing technologies.
Favorable IP Protection Laws Reassuring Multinational Captives
Singapore’s IP Strategy 2030 and alignment with the APEC Cross-Border Privacy Rules regime give multinational captives unparalleled certainty when centralizing proprietary algorithms, trade secrets, and clinical data. The Intellectual Property Office issues patents in an average of eight months, among the fastest timelines worldwide, while specialized IP courts expedite dispute resolution. Pharmaceutical giants such as AstraZeneca and AbbVie cite the robust legal shield as a decisive factor for multi-hundred-million-dollar biologics investments. This regulatory reliability strengthens the long-term trajectory of the Singapore Global Capability Centers market by locking in R&D and high-margin innovation charters.
Restraints Impact Analysis*
| Restraint | (~) % Impact on CAGR Forecast | Geographic Relevance | Impact Timeline |
|---|---|---|---|
| Escalating real estate and labor costs in core business districts | −1.4% | National, the highest in the Central Business District | Short term (≤ 2 years) |
| Intensifying competition from tier-2 ASEAN cities offering lower cost bases | −1.1% | Regional ASEAN, notably Malaysia, Thailand, and Vietnam | Medium term (2-4 years) |
| Limited domestic talent pipeline for niche ER&D skills | −0.8% | National | Long term (≥ 4 years) |
| Stringent Employment Pass regulations post-pandemic | −0.6% | National | Medium term (2-4 years) |
| Source: Mordor Intelligence | |||
Escalating Real-Estate and Labor Costs in Core Business Districts
Grade A office rents in the Central Business District rose 40% above those in Kuala Lumpur and Bangkok in 2024, squeezing margins for functions that do not require a downtown address. Salaries for senior cloud engineers run 25-35% higher than regional averages, amplifying cost headwinds. Multinationals respond by relocating back-office analytics teams to suburban campuses, such as the Punggol Digital District, where OCBC is investing SGD 500 million (USD 385 million) in a 430,000-square-foot hub scheduled for completion in 2027. Firms also deploy hybrid seating, hot-desk policies, and nearshore pods in Johor Bahru to control occupancy costs. If rents remain elevated, some low-complexity workloads could exit the Singapore Global Capability Centers market in favor of tier-2 ASEAN locations.[3]The Straits Times, “OCBC develops new Punggol Digital District hub, to base up to 4,000 staff there,” straitstimes.com
Intensifying Competition from Tier-2 ASEAN Cities Offering Lower Cost Bases
Malaysia’s digital investment packages, Thailand’s Eastern Economic Corridor incentives, and Vietnam’s tax-holiday regimes lure GCC mandates with 30-40% cost savings compared to Singapore. Philippine Economic Zone Authority data show USD 2 billion of Singaporean equity already operating in Philippine industrial parks, reflecting a counter-magnet effect. To sustain its edge, Singapore doubles down on high-value charters, such as quantum cryptography pilots, ESG advisory hubs, and life-science translational research, that depend less on wage arbitrage. This repositioning helps protect the premium tier of the Singapore Global Capability Centers market but still exposes commoditized back-office work to relocation risks.[4]Philippine News Agency, “PEZA eyes more Singaporean investments in ecozones,” pna.gov.ph
*Our forecasts treat driver/restraint impacts as directional, not additive. The impact forecasts reflect baseline growth, mix effects, and variable interactions.
Segment Analysis
By Function / Capability: IT Services Dominance Faces KPO Disruption
Information technology and digital services accounted for 52.31% of the Singapore Global Capability Centers market in 2025, underscoring the nation’s status as a cloud-computing and cybersecurity stronghold. The segment combines application modernization, AI model engineering, and platform-as-a-service management, enabling global firms to run Asia Pacific workloads with speed and compliance. Over the forecast horizon, demand for zero-trust architectures and quantum-safe encryption is expected to solidify spending levels, even as automation reduces the need for ticket-handling headcounts. Knowledge process outsourcing, although smaller, is accelerating at a 6.61% CAGR as investment banks, pharmaceutical majors, and consumer-goods giants re-centralize research analytics after the pandemic-era decentralization. These specialized cells, often staffed by PhD economists and domain scientists, offer bill rates that tolerate Singapore’s premium cost structure.
The expansion of engineering and ER&D sub-segments reflects the government's efforts to make the city-state a leading node in advanced manufacturing. Siemens’s EUR 200 million (USD 252 million) factory leverages digital twins and additive manufacturing to collapse prototyping cycles. Business process management remains mature yet steady; automation and low-code workbenches free teams to tackle judgment-intensive exceptions, preserving relevance even as routine claims processing migrates to locations such as Manila and Ho Chi Minh City. Consequently, the Singapore Global Capability Centers market maintains equilibrium by pairing scale-efficiency cores with high-margin analytical satellites that thrive on the island’s talent and infrastructure edge.


By Engagement Model: Captive Operations Lead Hybrid Innovation
Captive centers represented 59.12% of the Singapore Global Capability Centers market size in 2025, reflecting multinationals’ desire to guard algorithms, data lakes, and brand equity within wholly owned entities. These centers typically house executive decision rooms, strategic design studios, and security operations centers that cannot be easily outsourced. Yet the fastest growth emerges from hybrid build-operate-transfer arrangements, expanding at a 7.18% clip. Under this structure, a local partner stands up infrastructure, secures regulatory clearances, and onboards talent before gradually handing governance back to the client after capability stabilization. The model allows capital-light entry for firms testing Asia Pacific demand while mitigating fixed-cost exposure.
Traditional BOT contracts remain relevant in the life sciences and regulated banking domains, where the depth of local compliance expertise is critical. Citigroup’s 2024 restructuring highlights how firms can pivot from third-party processing toward captive, high-margin wealth-management desks without losing operational continuity. In summary, engagement-model variety ensures the Singapore Global Capability Centers market addresses diverse risk appetites and maturity curves while keeping the city-state’s legal framework at the core of value creation.
By Organization Size: Enterprise Dominance Challenged by SME Innovation
Large enterprises controlled 87.95% of revenue in 2025, propelled by banking behemoths, cloud hyperscalers, and top-10 pharma companies that require complex regional orchestration. Their scale unlocks volume discounts on network transit, colocation, and power, maintaining a structural edge. However, small and medium-sized enterprises are projected to grow at a rate of 6.48% annually, aided by cloud subscriptions, pay-as-you-go AI services, and modular regulatory-as-a-service platforms. SME adoption is further catalyzed by the SME Go Digital initiative, which subsidizes cybersecurity upgrades and cross-border e-invoicing connectors.
Shared innovation campuses, such as LaunchPad and Punggol Digital District, offer start-ups the benefits of Tier III data center adjacency, test-bed sandboxes, and university collaborations, all without incurring the hefty capital expenditures typically associated with these initiatives. This environment enables niche fintechs and med-techs to co-locate with anchor tenants, shortening partnership cycles. While large firms will continue to dominate absolute spend, the burgeoning SME layer injects agility and innovative ideas into the Singapore Global Capability Centers market, challenging incumbents to accelerate their renewal cycles.

By Industry Vertical: BFSI Leadership Meets Healthcare Innovation
Banking, financial services, and insurance accounted for 38.55% of the Singapore Global Capability Centers market in 2025, driven by the regional headquarters of global banks and payment networks. These centers encompass wealth analytics, anti-money laundering orchestration, and real-time settlement engines that necessitate close regulatory coordination with the Monetary Authority of Singapore. Financiers were early adopters of quantum-risk assessment trials, a shift mirrored by OCBC quadrupling its quantum-proficient talent pool by 2026.
Healthcare and life sciences posts the swiftest 6.52% CAGR, benefiting from Pfizer’s USD 1 billion sterile-injectables plant and AbbVie’s USD 223 million biologics expansion. Pharmaceutical GCCs integrate clinical trial data analytics with advanced manufacturing execution systems, leveraging Singapore’s stringent yet predictable regulatory framework to expedite product registration across ASEAN. Telecom and IT coexist as steady growth sectors, buoyed by 5G densification and low-orbit satellite gateways. Manufacturing, automotive, and industrial applications lean on the city-state’s Industry 4.0 test beds to validate robotics and digital-twin concepts before wider ASEAN rollouts. As vertical diversification deepens, the Singapore Global Capability Centers market reinforces its image as a multi-industry innovation crucible.
Geography Analysis
The Singapore Global Capability Centers market size is expected to reach USD 19.53 billion by 2026, resulting in the island nation having the highest single-country concentration of capability-center spending in the Asia Pacific. Located at a midpoint between Tokyo and Mumbai, Singapore enables companies to manage multi-time-zone support desks and real-time analytics without opening multiple regional offices. Air-cargo links through Changi Airport enable the rapid delivery of prototypes or parts, which is essential for pharmaceutical and advanced manufacturing companies in the Global Capability Centers market. A dense cluster of 87 data centers forms the digital backbone, ensuring that latency-sensitive financial-trading and telemedicine workloads remain within regulatory thresholds. Tight integration of airport, seaport, and fiber networks positions the city-state as a resilient command node for global operations.
Policy architecture further reinforces geographic appeal. Singapore is a founding signatory of the Regional Comprehensive Economic Partnership, enabling Global Capability Centers to route services and data across 14 partner economies with minimal tariff or compliance friction. Bilateral digital-economy pacts with Australia, the United Kingdom, and South Korea simplify cross-border data transfers that underpin cloud-native GCC workflows. The government’s Smart Nation program integrates nationwide IoT sensors into transport and energy grids, providing capability centers with easy access to anonymized datasets for machine-learning pilots. Submarine-cable investments, such as the Echo system, will reduce round-trip latency to the United States to under 130 milliseconds, supporting synchronous DevOps between Singapore and West Coast engineering teams. These infrastructure moves help protect the Singapore Global Capability Centers' market share, even as rival hubs tout lower rents.
Physical space constraints and premium downtown rents prompt a measured push toward decentralization. New precincts, such as Punggol Digital District and Jurong Innovation District, offer lower occupancy costs and direct fiber spurs into regional cable landing stations. Companies are clustering R&D labs, quantum-computing pods, and sustainability war rooms in these zones to tap into university partnerships while maintaining a 30-minute commute to Changi and the central business district. Such micro-geographic flexibility allows firms to segment their operations: core governance teams remain in Grade A offices, whereas high-throughput testing lines are located in suburban smart factories. Combined, these dynamics keep the Singapore Global Capability Centers market on course for steady geographic diversification without diluting its premium positioning.
Competitive Landscape
Market leadership remains moderately concentrated, a structure that confers both scale efficiencies and innovation pressure. Cloud hyperscalers, such as Amazon Web Services, utilize nine-figure capital programs to expand their green data center capacity, locking in enterprise contracts that might otherwise be lost to Kuala Lumpur or Bangkok. Global banks, including HSBC and Citigroup, maintain multifunctional campuses that blend wealth advisory analytics with real-time treasury operations, leveraging Singapore’s robust financial regulation regime to secure client trust.
Strategic moves over the last 18 months underscore a pivot toward deep-tech and ESG differentiation. OCBC has earmarked SGD 500 million (USD 385 million) for a 430,000-square-foot Punggol hub that will quadruple its quantum-proficient talent pool by 2026, signaling an arms race in post-quantum security. Pfizer’s USD 1 billion expansion brings sterile-injectable manufacturing and related data science teams under one roof, fortifying its life sciences specialization that smaller rivals struggle to replicate. At the same time, Google collaborates with local universities under EDB grant frameworks to co-develop large language model safety protocols, cementing a thought leadership position in responsible AI.
A fast-growing tail of specialized providers heightens competitive tension. Niche ESG consultancies embed carbon-accounting engines that interface with the national Emission Factors Registry, winning mandates from firms racing toward ISSB compliance. Fintech analytics start-ups plug AI-driven wealth-planning modules into incumbent banking GCCs, shortening product cycles and raising client-experience benchmarks. These new entrants force incumbents to refresh service catalogs, invest in automation, and explore hub-and-spoke staffing models with Johor Bahru or Ho Chi Minh City satellites. The result is a dynamic Singapore Global Capability Centers market that strikes a balance between scale and stability, with a constant influx of next-generation capabilities.
Singapore Global Capability Centers Industry Leaders
JPMorgan Chase and Co.
Citigroup Inc.
HSBC Holdings PLC
Microsoft Corporation
Accenture plc
- *Disclaimer: Major Players sorted in no particular order

Recent Industry Developments
- October 2025: DBS Bank’s “Singapore 2040” study forecasts a sharp shift toward tech-heavy jobs, underscoring the lender’s rising investments in artificial-intelligence tools to stay ahead in regional banking.
- September 2025: IMDA expanded its Digital Leaders Programme to 2,000 firms, providing comprehensive support for end-to-end generative AI rollouts, data analytics, and Smart Nation-aligned digital upgrades.
- August 2025: IMDA released the Green Data Centre Roadmap (SS 715:2025), setting new energy-efficiency rules that enable data centers to meet challenging ESG targets without compromising performance.
- July 2025: A*STAR and Siemens kicked off the Smart and Sustainable Advanced Manufacturing Catalyst to co-develop Industry 4.0 tech and greener factory methods, bolstering Singapore’s manufacturing-innovation edge.


Singapore Global Capability Centers Market Report Scope
The scope of the global capability center study for the market segmentation by the Function/Capability for (i) Information Technology (IT) and Digital Services segment is limited to Software Development, Cloud and Infrastructure Management, Cybersecurity, Data Analytics and AI/ML; (ii) Engineering / ER&D segment is limited to Product Design and Testing, Embedded Systems, Digital Twin / Simulation; (iii) Business Process Management (BPM) segment is limited to Finance and Accounting, HR, Payroll and Talent Management, Procurement, Customer Service; and (iv)Knowledge Process Outsourcing (KPO) segment is limited to Market Research and Insights, Risk and Compliance, Legal and Regulatory Support, Strategy and Consulting Support. Similarly, for segmentation by the Engagement Model, scope for (i) Hybrid Build-Operate-Transfer (BOT) is limited to Joint Venture / Strategic Partnership and Virtual Captive Model. The rest of the segment scope is as specified for the listed segment.
| Information Technology and Digital Services |
| Engineering / ER&D |
| Business Process Management |
| Knowledge Process Outsourcing |
| Captive (Self-Build)/ In-house |
| Build-Operate-Transfer (BOT) |
| Hybrid Build-Operate-Transfer (BOT) |
| Large Enterprises |
| Small and Medium Enterprises (SMEs) |
| Banking, Financial Services, and Insurance (BFSI) |
| Telecom and IT |
| Healthcare and Life Sciences |
| Manufacturing, Automotive and Industrial |
| Retail and Consumer Goods |
| Other Industry Verticals |
| By Function / Capability | Information Technology and Digital Services |
| Engineering / ER&D | |
| Business Process Management | |
| Knowledge Process Outsourcing | |
| By Engagement Model | Captive (Self-Build)/ In-house |
| Build-Operate-Transfer (BOT) | |
| Hybrid Build-Operate-Transfer (BOT) | |
| By Organization Size | Large Enterprises |
| Small and Medium Enterprises (SMEs) | |
| By Industry Vertical | Banking, Financial Services, and Insurance (BFSI) |
| Telecom and IT | |
| Healthcare and Life Sciences | |
| Manufacturing, Automotive and Industrial | |
| Retail and Consumer Goods | |
| Other Industry Verticals |


Key Questions Answered in the Report
What is the projected value of the Singapore Global Capability Centers market by 2031?
The market is expected to reach USD 26.49 billion by 2031 based on a 6.28% CAGR forecast.
Which function segment shows the highest growth rate?
Knowledge process outsourcing is expected to lead with a 6.61% CAGR through 2031.
Why do multinationals prefer Singapore for high-value Global Capability Centers?
Strong IP protection, robust digital infrastructure, and generous government grants outweigh cost disadvantages relative to neighboring ASEAN cities.
How does the 5G rollout support the capabilities of capability centers?
National 5G coverage enables low-latency edge applications, boosting performance for AI analytics, fintech platforms, and IoT command centers.
Which industry vertical is expanding the fastest?
The healthcare and life sciences sector is forecasted to record the highest growth at 6.52% CAGR, fueled by major pharmaceutical investments.
What engagement model is gaining popularity besides captive centers?
Hybrid build-operate-transfer structures are rising swiftly, offering operational flexibility while maintaining strategic oversight.
Page last updated on:


