Service Provider Router Market Size and Share
Market Overview
| Study Period | 2020 - 2031 |
|---|---|
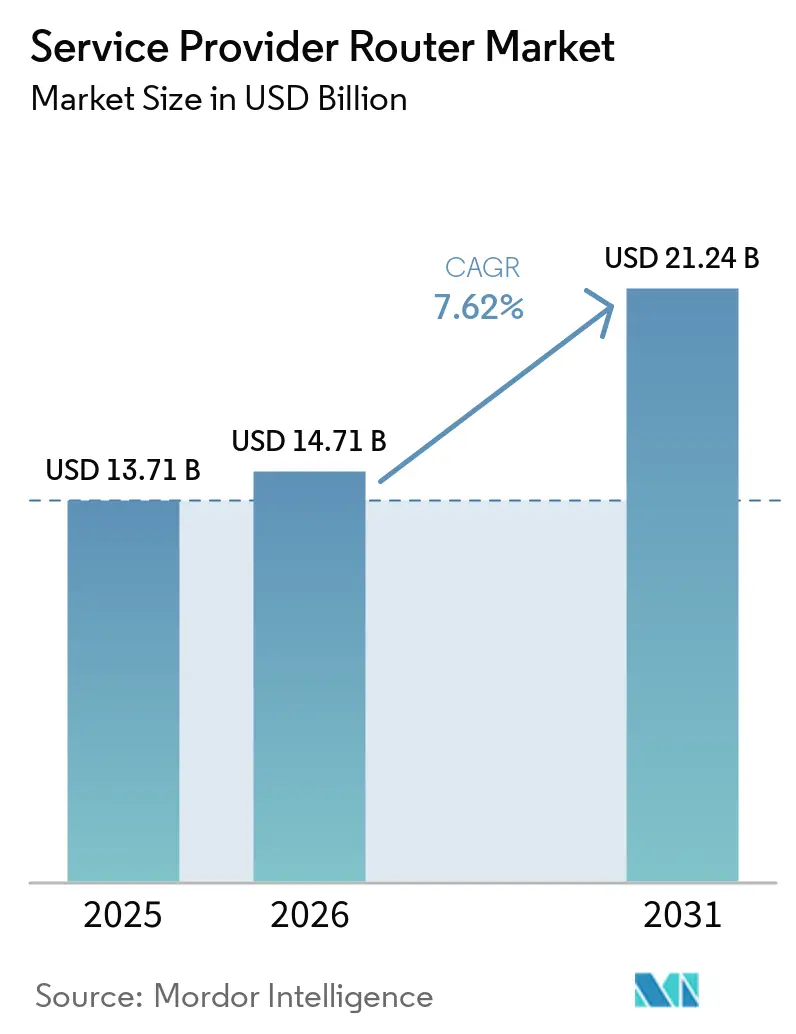
| Market Size (2026) | USD 14.71 Billion |
| Market Size (2031) | USD 21.24 Billion |
| Growth Rate (2026 - 2031) | 7.62% CAGR |
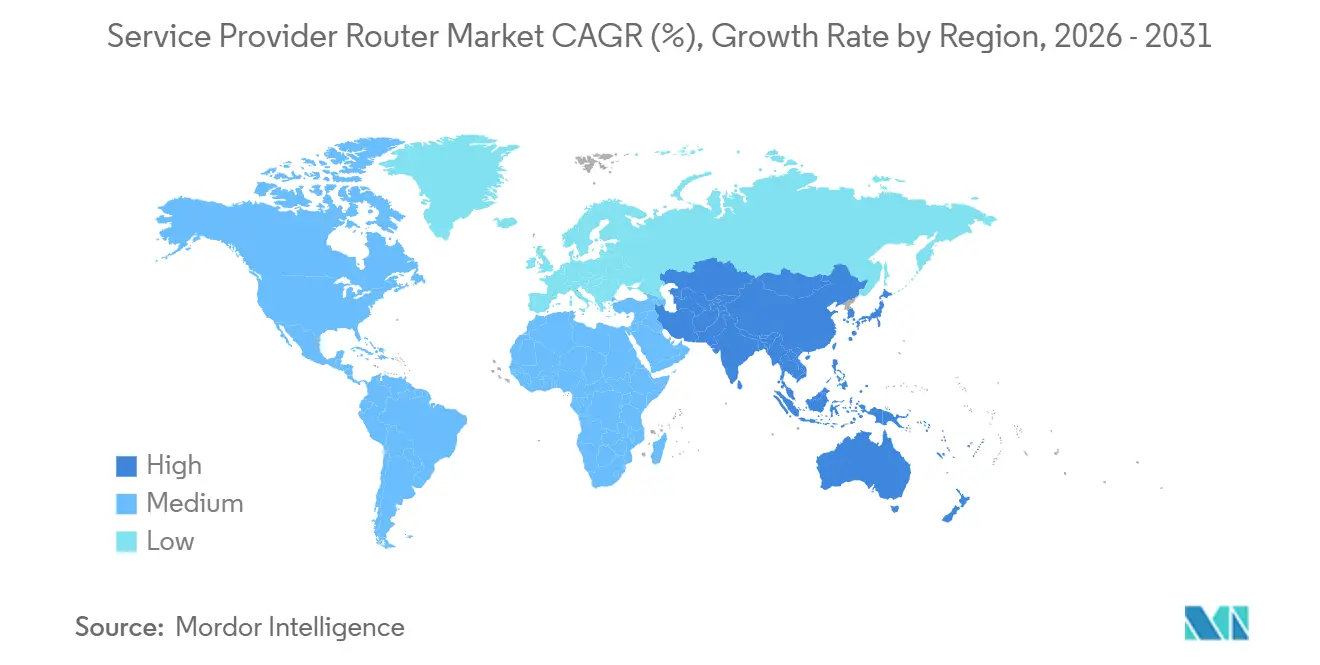
| Fastest Growing Market | Asia-Pacific |
| Largest Market | North America |
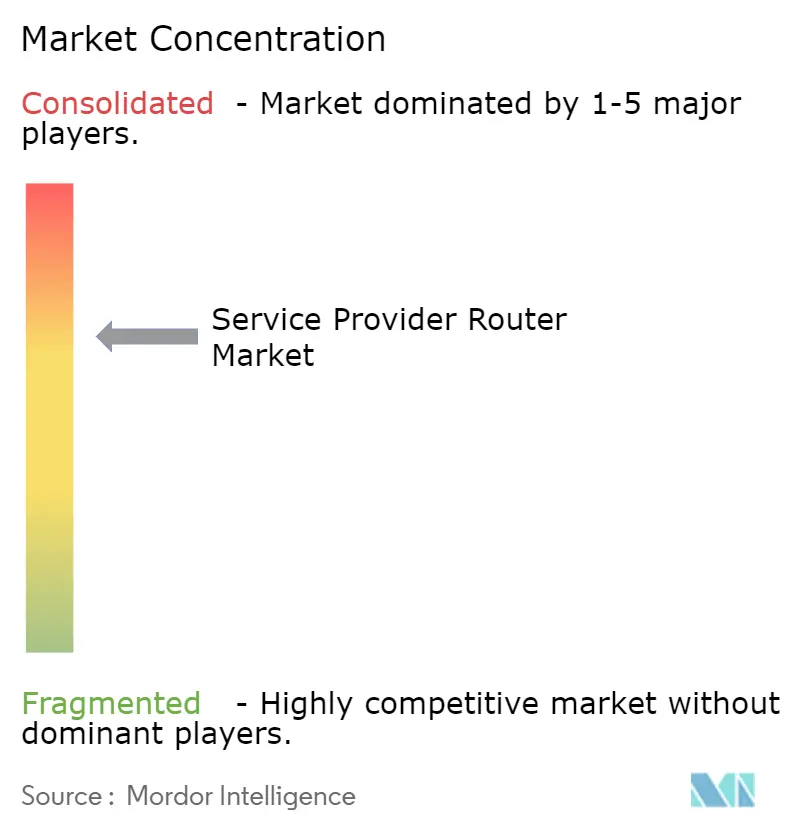
| Market Concentration | Medium |
Major Players *Disclaimer: Major Players sorted in no particular order Image © Mordor Intelligence. Reuse requires attribution under CC BY 4.0. | |
Service Provider Router Market Analysis by Mordor Intelligence
The service provider router market size was valued at USD 13.7 billion in 2025 and is estimated to grow from USD 14.7 billion in 2026 to reach USD 21.2 billion by 2031, at a CAGR of 7.6% during the forecast period (2026-2031). Ongoing 5G-Advanced backhaul rollouts, hyperscaler data-center interconnect (DCI) expansion, and the migration to 400 G/800 G coherent optics are shortening hardware refresh cycles and lifting average port densities. Operators are shifting capital toward edge intelligence to support ultra-reliable, low-latency communication, while cloud providers are internalizing backbone routing to manage east-west traffic at petabit scale. Supply-chain volatility for advanced ASICs and tightening energy-efficiency mandates are elevating the total cost of ownership, which, in turn, favors vendors with vertically integrated hardware, optics, and software roadmaps. At the same time, open networking stacks and white-box platforms are eroding incumbent price premiums and encouraging multi-vendor procurement strategies that reduce lock-in risk.
Key Report Takeaways
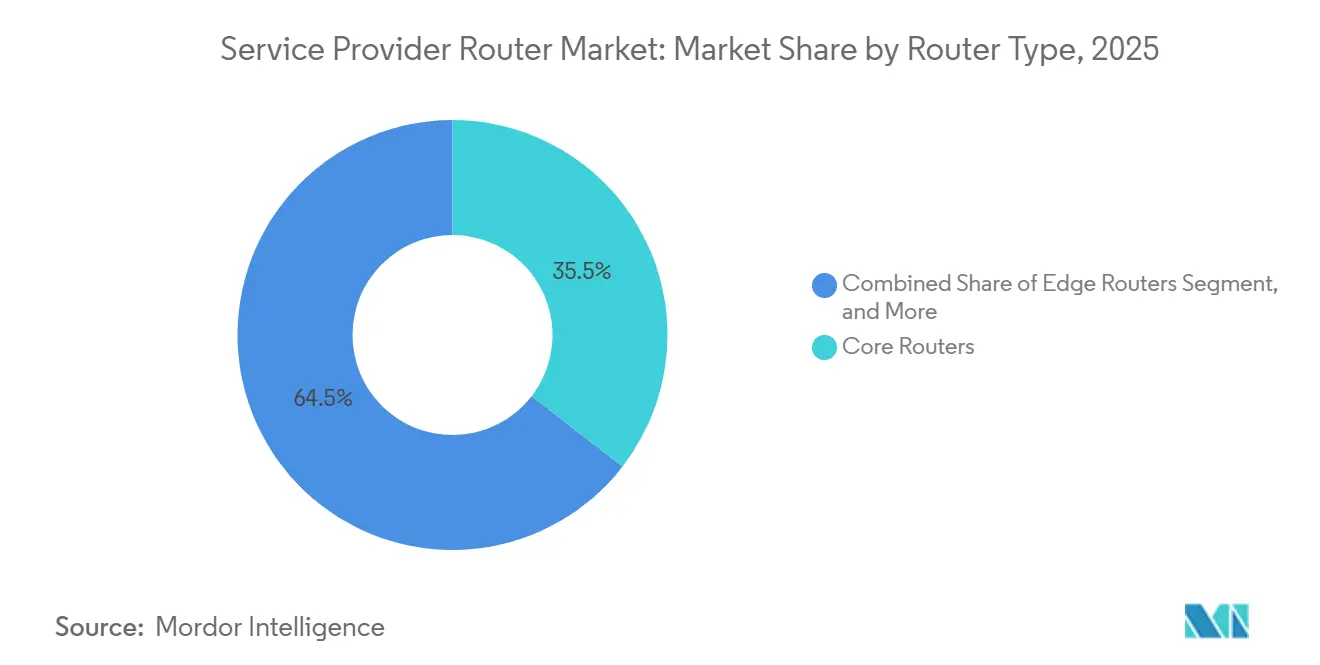
- By router type, core platforms led with 35.4% of service provider router market share in 2025, while edge routers are projected to expand at an 8.94% CAGR through 2031.
- By port speed, 100 G interfaces held 34.82% of the service provider router market size in 2025, whereas ports above 400 G are advancing at a 12.42% CAGR during 2026-2031.
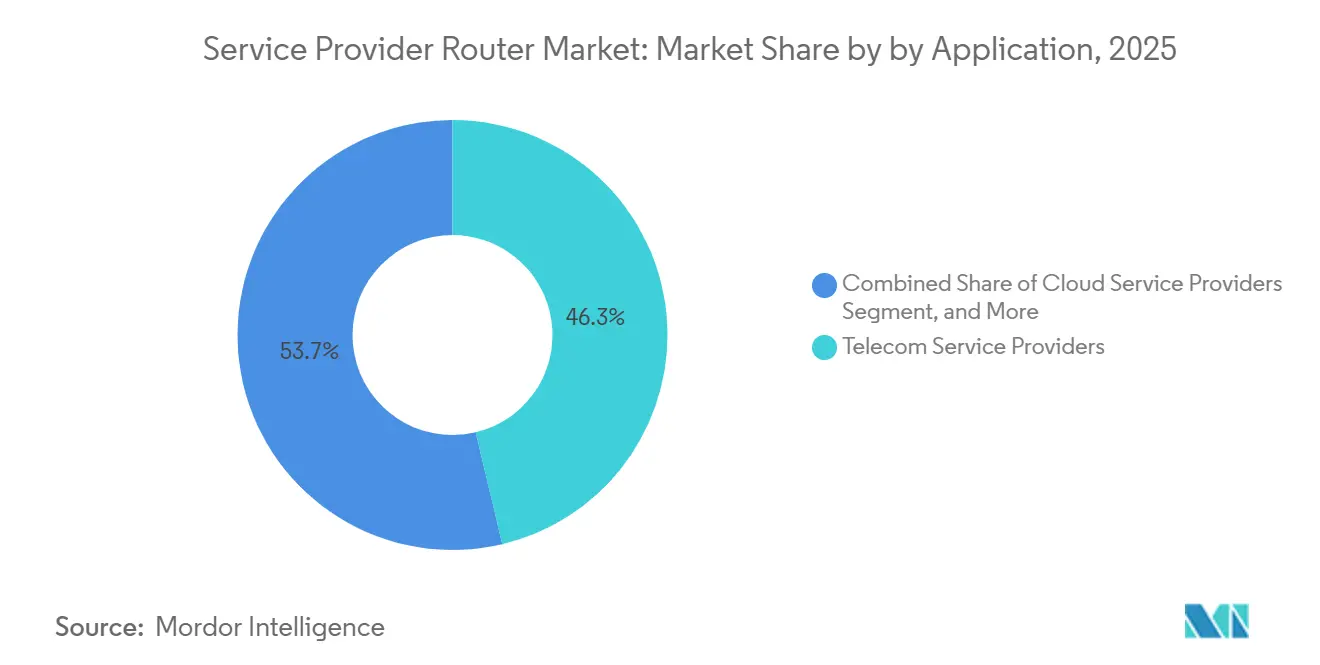
- By application, telecom service providers accounted for 46.28% of the service provider router market revenue share in 2025, and cloud service providers are forecast to record a 10.73% CAGR through 2031.
- By technology, hardware-based platforms retained 68.36% of the 2025 revenue pool, yet software-defined and virtual routers represent the fastest-growing segment at a 13.42% CAGR.
- By geography, North America commanded 41.28% of 2025 revenue, whereas Asia-Pacific is poised to grow at an 8.14% CAGR over 2026-2031.
Note: Market size and forecast figures in this report are generated using Mordor Intelligence’s proprietary estimation framework, updated with the latest available data and insights as of January 2026.
Global Service Provider Router Market Trends and Insights
Drivers Impact Analysis*
| Driver | (~) % Impact on CAGR Forecast | Geographic Relevance | Impact Timeline |
|---|---|---|---|
| 5G and 5G-Advanced Backhaul Requirements | +2.1% | China, India, South Korea, United States, global spillover | Medium term (2-4 years) |
| Proliferation of 400 G / 800 G Routing Technology | +1.8% | North America and Europe core, Asia-Pacific metro aggregation | Short term (≤ 2 years) |
| Expansion of Cloud Data Centers and DCI Traffic | +1.5% | Hyperscaler hubs in North America, Europe, Asia-Pacific | Medium term (2-4 years) |
| Rise of AI Overlay Networks Requiring Lossless Backbone | +1.3% | GPU clusters in North America and Asia-Pacific, emerging demand in Europe | Long term (≥ 4 years) |
| Emerging Quantum-Safe Routing Protocol Adoption | +0.4% | Financial and government networks in North America and Europe, pilot sites in Asia-Pacific | Long term (≥ 4 years) |
| Government Subsidies for Rural Fiber Backbone | +0.5% | India, Nigeria, Mozambique, South Sudan, Côte d'Ivoire, Brazil | Medium term (2-4 years) |
| Source: Mordor Intelligence | |||
5G And 5G-Advanced Backhaul Requirements
Mobile operators are moving from early 5G releases toward 5G-Advanced features such as network slicing and integrated access backhaul. China targeted 3.5 million base stations by year-end 2025, each requiring at least 10 G of backhaul capacity, creating incremental router demand exceeding 35 Tbit/s nationwide. South Korea’s three carriers invested KRW 8.7 trillion (USD 6.5 billion) in backhaul upgrades in 2025. Huawei’s FlexE 2.0 hard slicing and SRv6 segmentation enable sub-millisecond latency for enterprise SLA tiers. Nokia shipped more than one million AirScale microwave radios supporting 10 G E-band links, cutting urban fiber costs by 30%. These deployments prioritize timing protocols such as IEEE 1588v2 to maintain phase coherence across distributed antennas.[1]Ministry of Industry and Information Technology, “5G Base Station Deployment Target 3.5 Million,” miit.gov.cn
Proliferation Of 400 G / 800 G Routing Technology
The cost per transported bit has fallen roughly 60% since 2024, thanks to high-baud-rate coherent pluggables. Lumen activated 800G interfaces across its U.S. intercity backbone in 2025, reducing the required wavelengths per route by 75%. A Colt-Nokia field trial pushed 800 G QSFP-DD modules 120 km over standard fiber with no amplification. Arista’s R4 routers aggregate 3.2 T on a single HyperPort, ideal for hyperscaler spine fabrics. Ciena’s WaveLogic 6 Extreme optics achieved 1.6 T over 500 km, heralding terabit-class long-haul links. Multi-vendor interoperability under the OIF 800ZR spec is reducing lock-in and expediting volume deployments.[2]Nokia, “AirScale Microwave Portfolio Exceeds 1 Million Radios,” nokia.com
Expansion Of Cloud Data Centers And DCI Traffic
Hyperscalers funneled USD 600-710 billion into capital projects during 2025, with roughly 40% earmarked for data-center builds and backbone interconnects. Dell’Oro forecasts cumulative data-center capex reaching USD 1.7 trillion by 2030. DCI revenue grew 40% y-o-y in 2025. Coherent pluggables are displacing external transponders, lifting router spend inside greenfield campuses. AWS, Azure, and Google each operate proprietary backbones exceeding 100,000 route-km, forcing refresh cycles every 3 to 4 years to keep transport costs below USD 0.01 per GB-km.[3]Lumen Technologies, “Lumen Activates 800 G Coherent Optics,” lumen.com
Rise Of AI Overlay Networks Requiring Lossless Ethernet
Distributed GPU clusters push sustained east-west traffic above 100 Tbit/s, making lossless fabrics mandatory. Cornelis Networks’ Omni-Path Express cut all-reduce latency by 40% in U.S. Department of Energy supercomputers. H3C embedded dynamic buffer management to protect database replication from AI bursts. Juniper’s Apstra telemetry shortens mean time to repair to minutes and increases GPU utilization by 15%. Cisco’s Nexus Hyperfabric offloads scatter-gather operations into the switching plane, easing host CPU load by 25%. The Open Compute Project now recommends line-rate telemetry exporters to correlate network and training performance.[4]Cornelis Networks, “Omni-Path Express Fabric Delivers 200 Gbit/s,” cornelisnetworks.com
Restraints Impact Analysis*
| Restraint | (~) % Impact on CAGR Forecast | Geographic Relevance | Impact Timeline |
|---|---|---|---|
| Semiconductor supply-chain volatility | -1.2% | North America and Europe most exposed, global ripple | Short term (≤ 2 years) |
| Regulatory restrictions on Chinese vendors | -0.9% | North America, Europe, India, Australia | Medium term (2-4 years) |
| Transition to virtualized routing | -0.6% | Early adopters in North America and Europe | Long term (≥ 4 years) |
| Increasing energy-efficiency mandates | -0.4% | Europe lead, adoption in North America and Asia-Pacific | Medium term (2-4 years) |
| Source: Mordor Intelligence | |||
Semiconductor Supply-Chain Volatility
Lead times for 7 nm and 5 nm routing ASICs surpassed 40 weeks in early 2025, forcing 18-month capacity reservations and straining working capital. DDR4/DDR5 prices surged 80-90%, slicing mid-tier vendor margins by 5-7 points. A global HBM3 shortage, driven by AI accelerators, pushed several router makers toward higher-power GDDR6 buffers. TSMC’s N3 node reached full allocation by mid-2025, leaving smaller fabless firms on older processes. Domestic foundry subsidies under the U.S. CHIPS Act will not soften bottlenecks before 2027, extending volatility through the near term.
Regulatory Restrictions On Chinese Vendors
In March 2026 the FCC proposed banning foreign-made routers in federally funded U.S. networks. The U.K. NCSC advised critical operators to retire Chinese routing gear by 2029. India’s trusted-source mandate effectively excludes vendors from bordering nations without local plants. Australia’s security reforms oblige carriers to disclose high-risk vendor deployments. These policies fragment global supply, squeeze non-Chinese manufacturing capacity, and raise procurement costs for Western operators.
*Our forecasts treat driver/restraint impacts as directional, not additive. The impact forecasts reflect baseline growth, mix effects, and variable interactions.
Segment Analysis
By Router Type: Edge Intelligence Drives Distributed Processing
Edge platforms are forecast to expand at an 8.94% CAGR, outstripping the overall service provider router market. Core chassis captured 35.4% of 2025 revenue, anchoring long-haul and metro backbones. Edge growth stems from private 5G networks and multi-access edge computing that require sub-millisecond latency near end users. Cisco’s Catalyst 8200 shipped more than 50,000 units in 2025, bundling SD-WAN, IPsec, and application-aware routing to displace legacy branch appliances. Juniper’s Session Smart Router pilot reduced WAN bandwidth by 30% at Fortune 500 sites. Aggregation routers remain steady in mature cable systems where DOCSIS 4.0 uplinks need 10 G and 25 G backhaul. Subscriber edge functions are virtualizing onto uCPE: Swisscom rolled out 10,000 OneOS6 appliances, cutting truck rolls by 60%. This shift directs capex from proprietary hardware toward x86-based white boxes, tightening margins for incumbents. Nevertheless, core routers retain relevance for tier-1 carriers managing networks beyond 100,000 route-km, where redundant fabric modules ensure five-nines uptime.
The segment’s divergence illustrates how service provider router market size growth concentrates in distributed nodes while core refreshes flatten. Vendors that can package edge routing, compute, and security into a software-defined bundle are best positioned to capture incremental spend. Meanwhile, core-focused suppliers defend their share by integrating coherent optics and power-optimized silicon to squeeze more throughput per rack unit, delaying forklift upgrades.


By Bandwidth/Port Speed: Coherent Pluggables Propel Terabit Adoption
Interfaces above 400 G are forecast to rise at a 12.42% CAGR, the fastest of any speed tier in the service provider router market. In 2025, 100 G-to-400 G ports still accounted for a commanding 34.82% of revenue, reflecting entrenched use in metro aggregation and data-center spines. Operators increasingly skip 100 G and move straight to 400 G or 800 G, as seen in Verizon’s 2025 metro refresh that bypassed 100 G entirely. ZTE’s ZXCTN 6120H-SE delivered 400 G in a compact base-station router, enabling terabit backhaul without cabinet upgrades.
Arista’s XPO liquid-cooled pluggable alliance targets 1.6 T and 3.2 T modules dissipating 30 W+, pairing active thermal loops with standard QSFP-DD sockets. Ciena’s WaveLogic 6 optics extend 1.6T wavelengths over 500 km, lowering regeneration costs and energy consumption per bit. As coherent pluggables collapse transponder shelves into router line cards, the service provider router market share for platforms above 400 G widens, pulling optical and IP budgets into a converged spend pool.
By Application: Cloud Providers Internalize Routing
Telecom operators generated 46.28% of 2025 revenue, yet cloud providers will post the highest growth at a 10.73% CAGR. Hyperscalers own private backbones topping 100,000 route-km, refreshing routers every three to four years to keep costs below USD 0.01 per GB-km. Microsoft’s 2025 Azure upgrade adopted Arista 7800R4 units with 800 G optics, cutting power per bit by 40%. Google’s Andromeda SDN reduced link-provisioning time from weeks to minutes, driving utilization gains of 20%.
Internet exchange providers such as AMS-IX saw peak throughput jump 35% y-o-y in 2025, prompting upgrades to 400 G and 800 G. Enterprises shift toward SD-WAN overlays hosted in the cloud, pressuring telcos to monetize network slicing and MEC services. As a result, telecom carriers are pivoting investment toward edge routers that embed user-plane functions and support time-sensitive networking.
By Technology: Software-Defined Platforms Erode Hardware Incumbency
Hardware-centric systems held 68.36% of 2025 spend, yet software-defined and virtual routers are expected to rise at a 13.42% CAGR, the steepest climb inside the service provider router industry. Merchant-silicon white boxes, coupled with open NOS packages from RtBrick, IP Infusion, and Drivenets, now achieve 7.2 Tbit/s per chassis at a lower unit cost. Lanner’s NCA-4025 white-box uCPE, powered by 4th-Gen Xeon chips, sustains 100 G throughput for on-prem SD-WAN and firewall VNFs. Disaggregation appeals to hyperscalers prioritizing capex efficiency and rapid software iteration over carrier-grade hardening.
Incumbents respond by bundling telemetry analytics and security into integrated stacks, exemplified by Cisco’s 2024 USD 28 billion acquisition of Splunk, which links router logs to application health. As open models mature, the service provider router market share of proprietary chassis will decline, though dedicated hardware remains indispensable for outdoor cabinets subject to extreme temperatures and seismic events.
Geography Analysis
North America captured 41.28% of 2025 revenue, buoyed by USD 80 billion hyperscaler investment across Virginia, Oregon, and Texas. The Broadband Equity, Access, and Deployment program injects USD 42.45 billion into rural fiber networks, boosting demand for rugged aggregation routers. Energy-efficiency targets and Chinese vendor bans are accelerating domestic sourcing, advantaging local manufacturers.
Asia-Pacific is set for an 8.14% CAGR through 2031 as China’s 5G-Advanced plan scales to 3.5 million base stations, each requiring 10 G backhaul. India’s BharatNet allocated INR 139,000 crore (USD 16.7 billion) for fiber backbone projects. Japan’s carriers spent JPY 1.8 trillion (USD 12 billion) on 5G in fiscal 2025. Southeast Asia’s submarine-cable boom further props router demand in archipelagic states.
In Europe, operators invested EUR 45 billion (USD 50.9 billion) in 2025 networks despite tight capital outlays under EU Regulation 2023/826 that caps standby power at 8 W for high-performance appliances. Energy compliance costs encourage liquid-cooled optics and advanced thermal design, which favor vendors with deep R&D budgets.
South America leverages Brazil’s spectrum auction proceeds to modernize core backbones, while Argentina accelerates FTTH adoption. The Middle East is deploying 5G standalone cores under Saudi Vision 2030 and UAE smart-city initiatives, requiring UPF-enabled routers. African nations tap World Bank grants, such as Mozambique’s Digital Acceleration Program, to extend national fiber rings, creating opportunities for outdoor-rated routers capable of operating at 50 °C ambient temperatures.

Competitive Landscape
The top three players, Cisco, Huawei, and the combined Hewlett Packard Enterprise-Juniper entity, controlled roughly 55-60% of 2025 global revenue, indicating moderate concentration. Incumbents defend their share by packaging routing with orchestration, security, and professional services. Cisco’s predictive analytics suite, born from its Splunk acquisition, correlates network telemetry with application metrics to lock customers into multi-year subscriptions. Nokia’s 2024 USD 2.3 billion acquisition of Infinera merged optical and IP portfolios, enabling converged packet-optical shelves that cut the total cost of ownership by 25%. Arista, long a data-center switch specialist, broke into service-provider routing with its R4 Series, offering 800G ports and 3.2T HyperPorts aimed at hyperscaler spines.
White-box ecosystems capture 8-10% of 2025 data-center router shipments as RtBrick, IP Infusion, and Drivenets pair open NOS software with Edgecore or Delta hardware. Regulatory compliance is a differentiator: vendors investing in local manufacturing and security audits satisfy India’s trusted-source rules, whereas smaller challengers struggle to clear these hurdles. Early leadership in quantum-safe encryption is emerging as a niche wedge, with only a handful of suppliers integrating lattice-based algorithms into line-rate hardware in line with IETF drafts. The competitive picture suggests intensifying rivalry at the edge and in terabit-class cores, with incumbents leveraging R&D heft while challengers exploit disaggregation economics.
Service Provider Router Industry Leaders
Cisco Systems, Inc.
Huawei Technologies Co., Ltd.
Juniper Networks, Inc.
Nokia Corporation
Arista Networks, Inc.
- *Disclaimer: Major Players sorted in no particular order

Recent Industry Developments
- March 2026: The FCC proposed banning foreign-manufactured routers in networks financed by federal programs, accelerating re-sourcing among U.S. operators.
- March 2026: Arista formed a liquid-cooled XPO pluggable optics consortium targeting 1.6T and 3.2T coherent modules.
- March 2026: Ciena unveiled hyper-rail photonics and 1.6 T coherent pluggables aimed at cutting power per transmitted bit by 60%.
- March 2026: Huawei introduced Xinghe AI Fabric 2.0 and the CloudEngine XH9230 liquid-cooled switch for lossless GPU fabrics.


Global Service Provider Router Market Report Scope
The service provider router market comprises high-performance routing platforms deployed by telecom operators, cloud providers, and internet exchanges to manage traffic across core, edge, and aggregation networks. It includes hardware, software, and integrated systems enabling packet forwarding, network virtualization, traffic engineering, and secure connectivity for broadband, mobile, and data-center interconnect applications.
The Service Provider Router Market Report is Segmented by Router Type (Core Routers, Edge Routers, Aggregation Routers, and Subscriber Edge Routers), Bandwidth/Port Speed (Up to 40 Gbps, 40-100 Gbps, 100-400 Gbps, and Above 400 Gbps), Application (Telecom Service Providers, Cloud Service Providers, Internet Exchange Providers, and Enterprises and Public Sector), Technology (Hardware-Based Routers, Software-Defined/Virtual Routers, and Disaggregated/White-Box Routers), and Geography (North America, South America, Europe, Asia-Pacific, Middle East, and Africa). The Market Forecasts are Provided in Terms of Value (USD).
| Core Routers |
| Edge Routers |
| Aggregation Routers |
| Subscriber Edge Routers |
| Up to 40 Gbps |
| 40-100 Gbps |
| 100-400 Gbps |
| Above 400 Gbps |
| Telecom Service Providers |
| Cloud Service Providers |
| Internet Exchange Providers |
| Enterprises and Public Sector |
| Hardware-Based Routers |
| Software-Defined/Virtual Routers (VNF/uCPE) |
| Disaggregated/White-Box Routers |
| North America | United States |
| Canada | |
| Mexico | |
| South America | Brazil |
| Argentina | |
| Rest of South America | |
| Europe | Germany |
| United Kingdom | |
| France | |
| Italy | |
| Spain | |
| Russia | |
| Rest of Europe | |
| Asia-Pacific | China |
| Japan | |
| India | |
| South Korea | |
| Australia | |
| Rest of Asia-Pacific | |
| Middle East | Saudi Arabia |
| United Arab Emirates | |
| Turkey | |
| Rest of Middle East | |
| Africa | South Africa |
| Nigeria | |
| Kenya | |
| Rest of Africa |
| By Router Type | Core Routers | |
| Edge Routers | ||
| Aggregation Routers | ||
| Subscriber Edge Routers | ||
| By Bandwidth/Port Speed | Up to 40 Gbps | |
| 40-100 Gbps | ||
| 100-400 Gbps | ||
| Above 400 Gbps | ||
| By Application | Telecom Service Providers | |
| Cloud Service Providers | ||
| Internet Exchange Providers | ||
| Enterprises and Public Sector | ||
| By Technology | Hardware-Based Routers | |
| Software-Defined/Virtual Routers (VNF/uCPE) | ||
| Disaggregated/White-Box Routers | ||
| By Geography | North America | United States |
| Canada | ||
| Mexico | ||
| South America | Brazil | |
| Argentina | ||
| Rest of South America | ||
| Europe | Germany | |
| United Kingdom | ||
| France | ||
| Italy | ||
| Spain | ||
| Russia | ||
| Rest of Europe | ||
| Asia-Pacific | China | |
| Japan | ||
| India | ||
| South Korea | ||
| Australia | ||
| Rest of Asia-Pacific | ||
| Middle East | Saudi Arabia | |
| United Arab Emirates | ||
| Turkey | ||
| Rest of Middle East | ||
| Africa | South Africa | |
| Nigeria | ||
| Kenya | ||
| Rest of Africa | ||


Key Questions Answered in the Report
What is the projected value of the service provider router market in 2031?
The service provider router market size is forecast to reach USD 21.24 billion by 2031, expanding at a 7.62% CAGR from 2026 to 2031.
Which router type is expected to grow the fastest through 2031?
Edge routers are projected to register an 8.94% CAGR, the fastest among router types in the service provider router market [MORDOR INTELLIGENCE].
How are cloud providers influencing demand for service provider routers?
Cloud service providers are internalizing routing infrastructure and are expected to post a 10.73% CAGR, outpacing telecom carriers as they build low-latency DCI fabrics [MORDOR INTELLIGENCE].
Which port-speed segment will dominate new deployments after 2026?
Ports above 400 G are forecast to grow at a 12.42% CAGR due to coherent pluggable optics that enable 800 G and 1.6 T wavelengths [MORDOR INTELLIGENCE].
What is the geographic growth hotspot for service provider routers?
Asia-Pacific is the fastest-growing region, projected at an 8.14% CAGR, driven by large-scale 5G-Advanced rollouts and national fiber programs [MORDOR INTELLIGENCE].
How will software-defined routing impact traditional hardware sales?
Software-defined and virtual routers are forecast to rise at a 13.42% CAGR, steadily reducing the hardware-centric share of the market as operators adopt white-box platforms [MORDOR INTELLIGENCE].
Page last updated on:


