Retinal Implants Market Size and Share
Market Overview
| Study Period | 2020 - 2031 |
|---|---|
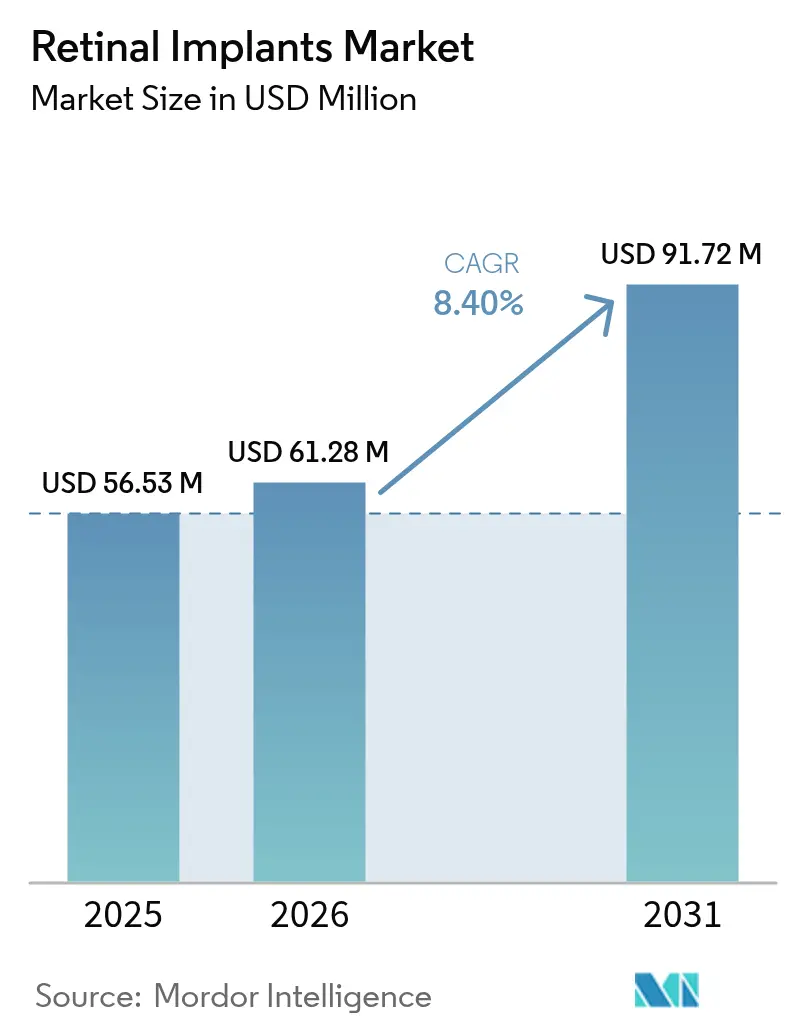
| Market Size (2026) | USD 61.28 Million |
| Market Size (2031) | USD 91.72 Million |
| Growth Rate (2026 - 2031) | 8.40% CAGR |
| Fastest Growing Market | Asia Pacific |
| Largest Market | North America |
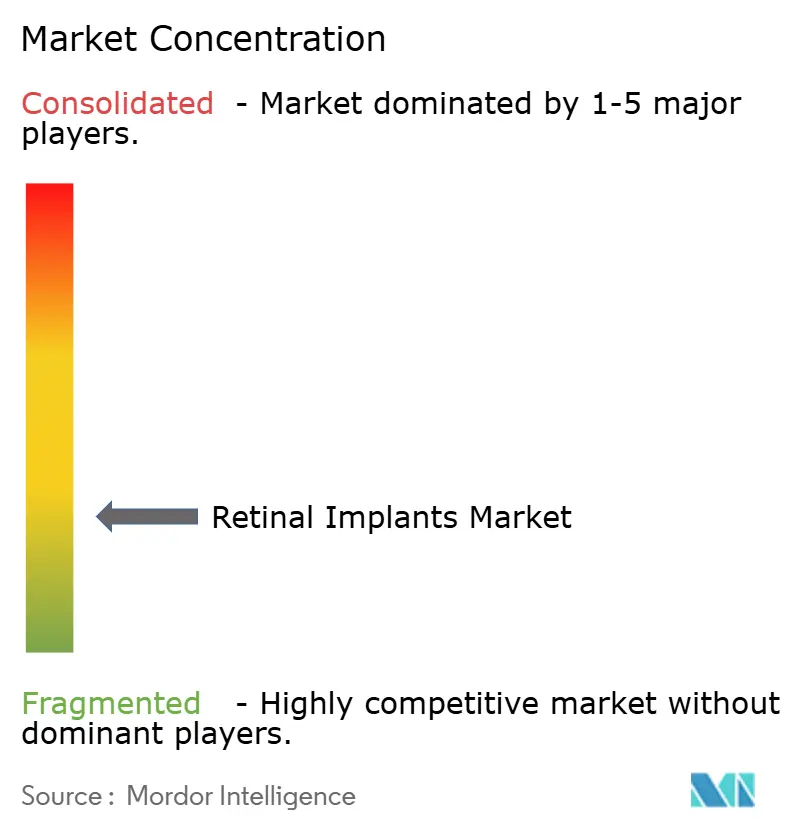
| Market Concentration | Low |
Major Players *Disclaimer: Major Players sorted in no particular order Image © Mordor Intelligence. Reuse requires attribution under CC BY 4.0. | |
Retinal Implants Market Analysis by Mordor Intelligence
The retinal implants market size is expected to grow from USD 56.53 million in 2025 to USD 61.28 million in 2026 and is forecast to reach USD 91.72 million by 2031 at 8.4% CAGR over 2026-2031. Increasing surgical adoption, rapid gains in wireless neuro-prosthetic engineering, and a smoother United States breakthrough‐device pathway collectively nurture sustained demand. Clinical trials now document measurable functional vision restoration, allowing surgeons to position implants earlier in the degenerative timeline. At the same time, gene-therapy momentum is nudging manufacturers to differentiate through higher-resolution electrode arrays and AI-powered image processing. Strategic acquisitions—such as Science Corporation’s purchase of Pixium Vision assets—signal accelerating capital formation around next-generation systems.
Key Report Takeaways
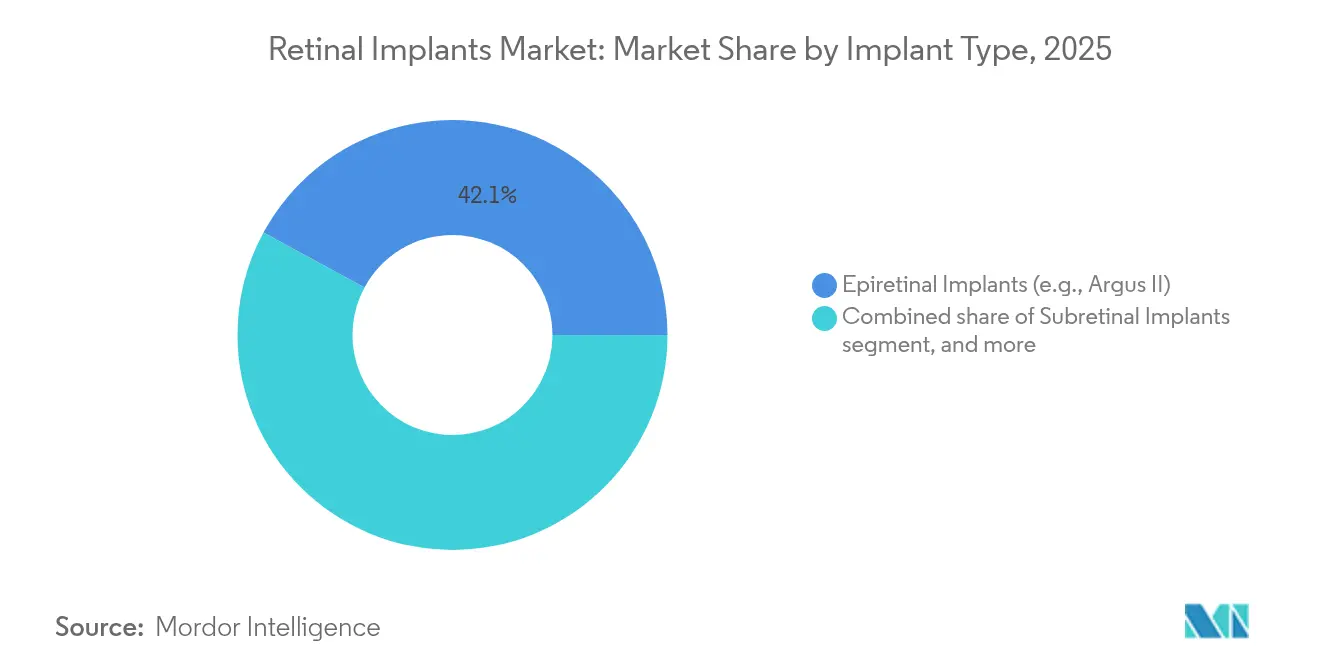
- By implant type, epiretinal systems led with a 42.10% retinal implants market share in 2025, whereas suprachoroidal platforms are projected to deliver a 10.18% CAGR through 2031.
- By technology, wired trans-scleral cable systems commanded 57.90% of the retinal implants market size in 2025, yet wireless power platforms are tracking an 11.12% CAGR to 2031.
- By disease indication, retinitis pigmentosa accounted for 46.95% of the retinal implants market size in 2025, while Stargardt disease is poised for a 10.21% CAGR during the forecast period.
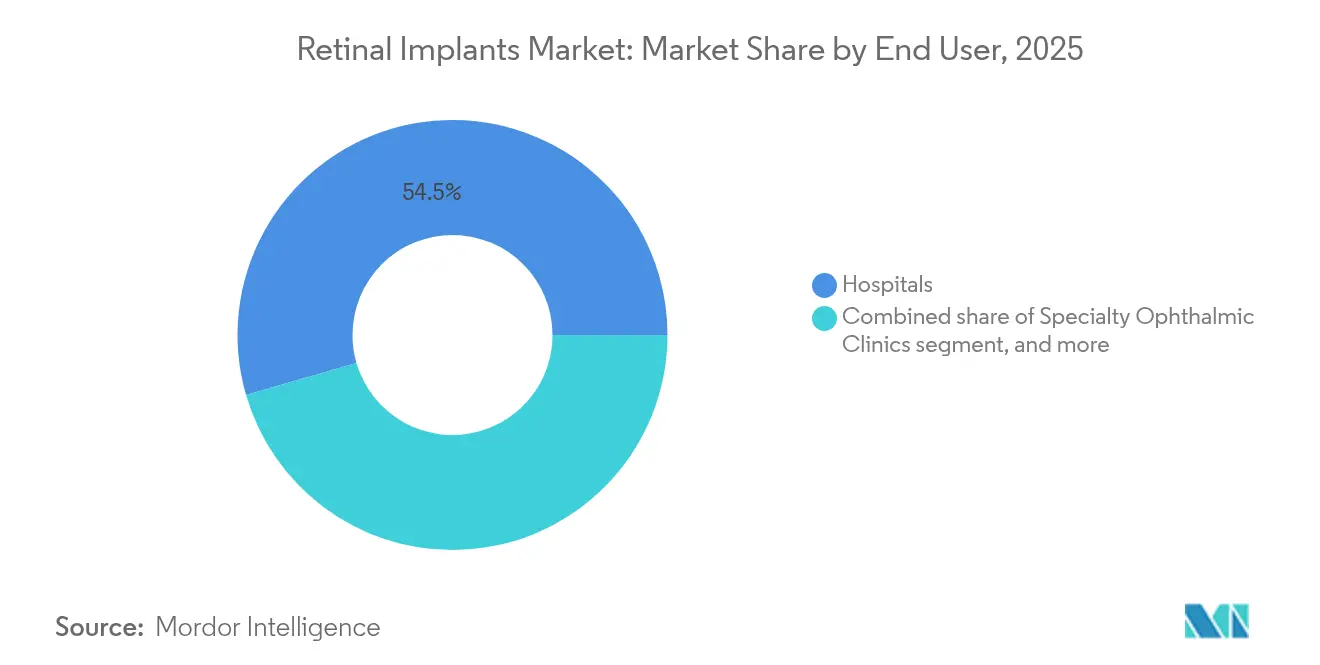
- By end user, hospitals captured 54.50% share of the retinal implants market size in 2025 and specialty ophthalmic clinics represent the fastest-growing setting at 11.42% CAGR.
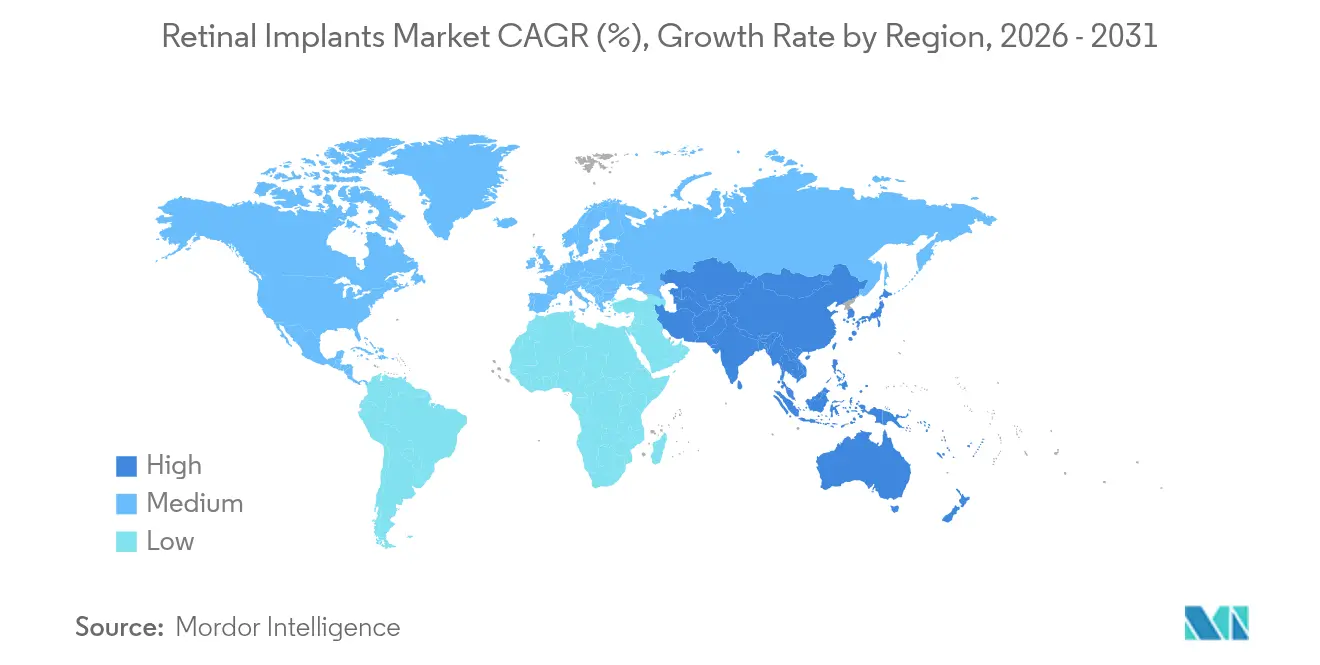
- By geography, North America held 39.75% of the retinal implants market share in 2025, but Asia-Pacific is expanding at a 9.41% CAGR to 2031.
Note: Market size and forecast figures in this report are generated using Mordor Intelligence’s proprietary estimation framework, updated with the latest available data and insights as of 2026.
Global Retinal Implants Market Trends and Insights
Driver Impact Analysis*
| Driver | % Impact on CAGR Forecast | Geographic Relevance | Impact Timeline |
|---|---|---|---|
| Rising global burden of vision loss | +2.1% | North America, Europe, Asia-Pacific | Long term (≥ 4 years) |
| Technological innovations in neuroprosthetics | +1.8% | United States & EU, spill-over to Asia-Pacific | Medium term (2-4 years) |
| Favorable regulatory and reimbursement climate | +1.2% | North America, Europe | Medium term (2-4 years) |
| Growing geriatric population | +1.5% | Japan, South Korea, Western Europe | Long term (≥ 4 years) |
| Increasing investments in ophthalmic R&D | +0.9% | United States, Europe, China, India | Short term (≤ 2 years) |
| Expanding healthcare infrastructure in emerging markets | +0.6% | Asia-Pacific, Latin America, Middle East & Africa | Long term (≥ 4 years) |
| Source: Mordor Intelligence | |||
Rising Global Burden of Vision Loss
Globally, 596 million people live with moderate-to-severe vision impairment and 43 million are blind, creating a substantial pool of late-stage patients suitable for implantation[1]World Eye & ENT Research Foundation, “Global Vision Impairment Factsheet 2025,” eye-entresearch.org. Conventional pharmacotherapy slows but rarely reverses photoreceptor loss, so demand gravitates to prosthetics once functional vision falls below navigation thresholds. Screening programs for diabetic retinopathy and macular degeneration are flagging more candidates earlier, particularly in Asia-Pacific where population aging is rapid. Cost-of-illness analyses indicate inherited retinal diseases drain USD 13.5 billion–32 billion each year in North America, strengthening the economic case for device-based vision restoration. As these epidemiologic pressures mount, the retinal implants market continues to scale beyond its original retinitis-pigmentosa niche.
Technological Innovations in Neuroprosthetics
Miniaturized wireless modules now integrate 256-electrode diamond arrays measuring 4.6 mm × 3.7 mm × 0.9 mm and draw laser power through the cornea, eliminating bulky transmitter packs[2]P. Nguyen et al., “Miniature Diamond Retinal Implant Powered by Laser Light,” arxiv.org. Photovoltaic implants such as PRIMA autonomously convert near-infrared illumination into retinal stimulation without implanted batteries, reducing long-term device failure risk. Machine-learning algorithms map gaze direction to stimulation patterns, improving recognition of faces and objects in low-contrast environments. Cortical visual prostheses—tested with 400 wireless stimulators embedded in the occipital lobe—target patients lacking an intact optic nerve, broadening the potential pool. These breakthroughs collectively lift patient mobility, surgical simplicity, and image quality, underpinning steady unit growth for the retinal implants market.
Favorable Regulatory and Reimbursement Climate
The FDA’s Breakthrough Device pathway cut review time from 12 months to roughly 7 months for candidates such as Neuralink’s Blindsight system in 2024[3]U.S. Food and Drug Administration, “Breakthrough Devices Program Updates 2025,” fda.gov. Europe mirrors this trend through the EMA’s Advanced Therapy Medicinal Product channel, expediting hybrid gene–device solutions. In the United States, Medicare contractors have begun issuing Local Coverage Determinations that reimburse implantation for end-stage retinitis pigmentosa, catalyzing regional uptake despite the absence of a national policy. Harmonization workshops among U.S., EU, Japanese, and Korean regulators further simplify multicenter trial design, trimming development timelines and costs. As approvals accelerate, investor confidence in the retinal implants market intensifies.
Growing Geriatric Population
Macular degeneration incidence rises steeply after age 65, affecting as many as 20% of seniors in high-income countries. Japan and South Korea therefore concentrate high volumes of eligible patients in sophisticated hospital networks equipped for complex ocular surgery. Tele-ophthalmology now bridges rural gaps, allowing remote mapping of residual retinal function before referral for implantation. Payors in aging societies face ballooning costs for vision-related dependency, nudging policymakers to subsidize restorative interventions. As a result, the retinal implants market gains recurring demand from both public and private insurers seeking to curb long-term care expenditure.
Restraints Impact Analysis*
| Restraints Impact Analysis | (~) % Impact on CAGR Forecast | Geographic Relevance | Impact Timeline |
|---|---|---|---|
| High cost of devices and procedures | -1.4% | Emerging markets; regions with limited reimbursement | Medium term (2-4 years) |
| Limited clinical efficacy and patient outcomes | -0.8% | Global | Short term (≤ 2 years) |
| Complex regulatory and manufacturing challenges | -0.7% | Global, more pronounced in multi-regional trials | Medium term (2-4 years) |
| Availability of alternative vision restoration therapies | -0.6% | North America, Europe, Asia-Pacific | Long term (≥ 4 years) |
| Source: Mordor Intelligence | |||
High Cost of Devices and Procedures
List prices remain near USD 100,000 per implant, excluding a 3- to 4-hour operative session, inpatient recovery, and up to two years of low-vision rehabilitation. Such economics deter health systems in Latin America and Africa where per-capita expenditure is comparatively low. Production volumes remain small, inflating component costs for hermetically sealed electrode arrays and sapphire optics. Even in the United States, Medicare still relies on narrow Local Coverage Determinations, demanding exhaustive documentation before authorizing payment, extending patient wait times. Until economies of scale or modular manufacturing trim prices, sticker shock will cap penetration in lower-income regions.
Limited Clinical Efficacy and Patient Outcomes
Average acuity among PRIMA wearers ranges from 20/438 to 20/550—below the threshold for reading unassisted text—and some users report phosphene hallucinations during adaptation. The Argus II five-year cohort retained functional devices, yet most participants still required mobility aids for independent travel. Retinal detachment, conjunctival erosion, and electrode degradation necessitate revision surgery in a minority of cases, undermining surgeon enthusiasm. Gene-therapy trials delivering biallelic RPE65 replacements now show multi-year durability without invasive hardware, siphoning candidates away from prosthetics. Consequently, ophthalmologists temper expectations, slowing referral growth for the retinal implants market in the near term.
*Our forecasts treat driver/restraint impacts as directional, not additive. The impact forecasts reflect baseline growth, mix effects, and variable interactions.
Segment Analysis
By Implant Type: Epiretinal Systems Drive Current Adoption
Epiretinal arrays delivered 42.10% of the retinal implants market share in 2025 on the strength of the Argus II legacy and surgeons’ procedural familiarity. Subretinal alternatives integrate photodiode matrices closer to surviving bipolar cells, improving contrast but adding surgical risk. Suprachoroidal designs, exemplified by the Phoenix 99, avoid retinal penetration, lowering detachment rates and driving a 10.18% CAGR forecast.
Suprachoroidal platforms also benefit from simpler explant revision because hardware rests between sclera and choroid layers. Photovoltaic subretinal chips like PRIMA are gaining European traction, whereas cortical implants remain investigational. As resolution rises, manufacturers anticipate shifting case mix toward multi-focal electrode clusters, ensuring the retinal implants market continues diversifying across implant geometries.


By Disease Indication: Retinitis Pigmentosa Leads Clinical Applications
Retinitis pigmentosa captured 46.95% of the retinal implants market size in 2025, reflecting well-understood natural history and clear eligibility thresholds. Stargardt disease is expanding at 10.21% CAGR as genomic screening identifies carriers earlier, making them receptive to proactive implantation.
Dry age-related macular degeneration is another growth locus; PRIMA’s geographic-atrophy cohort showed consistent letter-score gains at 12 months. Rare dystrophies such as choroideremia see sporadic compassionate-use implants, but gene therapy is giving these patients alternative avenues. Even so, late-stage inherited retinal disease remains the core driver for the retinal implants industry.
By End User: Hospitals Maintain Procedural Dominance
Hospitals managed 54.50% of 2025 implant volume because tertiary centers possess vitreoretinal operating theaters, intraoperative OCT, and multidisciplinary rehabilitation services. Specialty ophthalmic clinics are growing 11.42% annually, propelled by purpose-built ambulatory surgery suites and bundled care packages that lower payor costs.
Academic networks anchor early feasibility trials, train surgeons, and disseminate best practices to satellite clinics. The retinal implants market therefore follows a hub-and-spoke pattern: complex revisions stay within university hospitals, whereas straightforward primary implants migrate to high-throughput outpatient centers.
By Technology: Wireless Systems Transform Patient Experience
Wired designs still held 57.90% of revenue in 2025 because they offer reliable power transmission and data bandwidth. However, inductively coupled or laser-powered implants post an 11.12% CAGR as patients demand unrestricted head motion and minimal external hardware.
Power budgets have dropped by half since 2023 owing to energy-efficient stimulation algorithms, letting manufacturers shrink receiver coils. AI firmware now self-calibrates electrode thresholds, shortening clinic visits. Given these trends, wireless architectures are set to dominate future retinal implants market deployments.
Geography Analysis
North America delivered 39.75% of global revenue in 2025, sustained by Medicare reimbursement in select U.S. jurisdictions and a robust investigator network running pivotal IDE trials. Academic centers in California, Illinois, and Texas collectively implanted the largest annual case numbers. Canada leverages universal coverage to widen access, though procedure caps and queue times persist. Insurer negotiations hinge on long-term cost offset versus low-vision care, shaping hospital purchasing cycles.
Asia-Pacific is the fastest mover with a 9.41% CAGR through 2031, driven by population aging and rising diabetic retinopathy prevalence in China and India. Japan’s single-payer system already covers subretinal implants under high-cost medical-expense subsidies, creating steady pipeline volume. South Korea’s Health Technology Assessment body recently green-lit partial reimbursement for suprachoroidal prototypes, catalyzing domestic production grants. Urban–rural disparities remain acute; telemedicine follow-up is therefore integrated into most new rollout plans.
Europe shows gradual, policy-anchored growth. Germany’s DRG codes reimburse both implantation and programming sessions, while France bundles post-operative rehabilitation in its regional health budgets. The United Kingdom’s NICE is reevaluating cost-utility metrics for advanced wireless systems after early real-world evidence suggested higher quality-adjusted life-year gains than legacy wired models. EMA’s Advanced Therapy fast track overlaps with national device dossiers, occasionally prolonging market entry but ensuring rigorous safety oversight.

Competitive Landscape
The retinal implants market is fragmented: no single firm exceeds a 25% revenue slice, yet technological barriers restrict true commoditization. Second Sight Medical Products, while historically dominant, divested its Argus asset portfolio to refocus on drug-device hybrids. Science Corporation vaulted into prominence by acquiring Pixium Vision’s suprachoroidal IP and immediately reporting positive Primavera trial data, signaling credible challenger status.
Neuralink’s cortical Blindsight program attracted FDA breakthrough status, drawing both investor cash and regulatory spotlight toward extra-ocular approaches. LambdaVision stakes a differentiated position by fabricating protein-based artificial retinas aboard the International Space Station, aiming for unmatched uniformity and throughput. Incumbent ophthalmic majors such as Alcon are hedging via ophthalmic-surgery ecosystem acquisitions that could bundle implant procedures with cataract and refractive offerings, creating integrated care pathways.
Private-equity interest intensified when Cencora acquired Retina Consultants of America for USD 4.6 billion, hinting at vertical integration strategies linking device vendors, clinic networks, and diagnostic AI software. Venture funding continues channeled to early-stage chip-on-retina startups, though reimbursement risk keeps overall deal count below other med-tech sub-sectors. Collectively, these moves underscore a strategic pivot from proof-of-concept toward scalable manufacturing and multi-indication portfolios.
Retinal Implants Industry Leaders
Pixium Vision
Second Sight Medical Products Inc.
VisionCare, Inc.
Nano Retina
Labtician Ophthalmics, Inc.
- *Disclaimer: Major Players sorted in no particular order

Recent Industry Developments
- June 2025: Science Corporation announced tellurium-nanowire nanoprosthesis results restoring near-infrared detection in macaques.
- March 2025: FDA approved ENCELTO for MacTel 2, the first encapsulated-cell therapy in retinal disease.
- March 2025: Alcon acquired LENSAR Inc. for USD 356 million to merge robotics with ocular surgery ecosystems.
- March 2025: Vivani Medical confirmed spin-off of Cortigent to accelerate Orion cortical vision R&D.
- January 2025: Cencora closed its USD 4.6 billion purchase of Retina Consultants of America, expanding specialty-care reach.
- October 2024: Science Corporation posted positive Primavera trial interim data for geographic atrophy implants.


Global Retinal Implants Market Report Scope
As per the scope of the report, retinal implants are the devices that are used to restore useful vision to people who are suffering from vision loss. These are the implantable devices designed to supplant phototransduction within the eyes of people who lost vision.
| Epiretinal Implants (e.g., Argus II) |
| Subretinal Implants (e.g., Alpha AMS) |
| Suprachoroidal Implants |
| Implantable Miniature Telescope (IMT) |
| Other Implant Types |
| Retinitis Pigmentosa |
| Age-related Macular Degeneration |
| Stargardt Disease |
| Other Disease Indications |
| Hospitals |
| Specialty Ophthalmic Clinics |
| Academic & Research Centers |
| Wireless Powered Systems |
| Wired / Trans-scleral Cable Systems |
| Adaptive Image Processing & AI Integration |
| North America | United States |
| Canada | |
| Mexico | |
| Europe | Germany |
| United Kingdom | |
| France | |
| Italy | |
| Spain | |
| Rest of Europe | |
| Asia-Pacific | China |
| Japan | |
| India | |
| Australia | |
| South Korea | |
| Rest of Asia-Pacific | |
| Middle East & Africa | GCC |
| South Africa | |
| Rest of Middle East & Africa | |
| South America | Brazil |
| Argentina | |
| Rest of South America |
| By Implant Type | Epiretinal Implants (e.g., Argus II) | |
| Subretinal Implants (e.g., Alpha AMS) | ||
| Suprachoroidal Implants | ||
| Implantable Miniature Telescope (IMT) | ||
| Other Implant Types | ||
| By Disease Indication | Retinitis Pigmentosa | |
| Age-related Macular Degeneration | ||
| Stargardt Disease | ||
| Other Disease Indications | ||
| By End User | Hospitals | |
| Specialty Ophthalmic Clinics | ||
| Academic & Research Centers | ||
| By Technology | Wireless Powered Systems | |
| Wired / Trans-scleral Cable Systems | ||
| Adaptive Image Processing & AI Integration | ||
| Geography | North America | United States |
| Canada | ||
| Mexico | ||
| Europe | Germany | |
| United Kingdom | ||
| France | ||
| Italy | ||
| Spain | ||
| Rest of Europe | ||
| Asia-Pacific | China | |
| Japan | ||
| India | ||
| Australia | ||
| South Korea | ||
| Rest of Asia-Pacific | ||
| Middle East & Africa | GCC | |
| South Africa | ||
| Rest of Middle East & Africa | ||
| South America | Brazil | |
| Argentina | ||
| Rest of South America | ||


Key Questions Answered in the Report
What is the expected value of the retinal implants market in 2031?
The retinal implants market is projected to reach USD 91.72 million by 2031, growing at an 8.4% CAGR.
Which implant type currently holds the largest share?
Epiretinal systems led with 42.10% of the 2025 retinal implants market share.
Why are wireless implants gaining popularity?
Wireless systems improve patient mobility, reduce infection risk, and are forecast to grow at an 11.12% CAGR through 2031.
Which geographic region will grow fastest?
Asia-Pacific is expected to record a 9.41% CAGR due to rapid population aging and expanded ophthalmic infrastructure.
How does pricing affect adoption?
Device and procedural costs exceeding USD 100,000 limit uptake in regions without robust reimbursement, dampening near-term demand.
Page last updated on:


