Retinal Imaging Devices Market Size and Share
Market Overview
| Study Period | 2020 - 2031 |
|---|---|
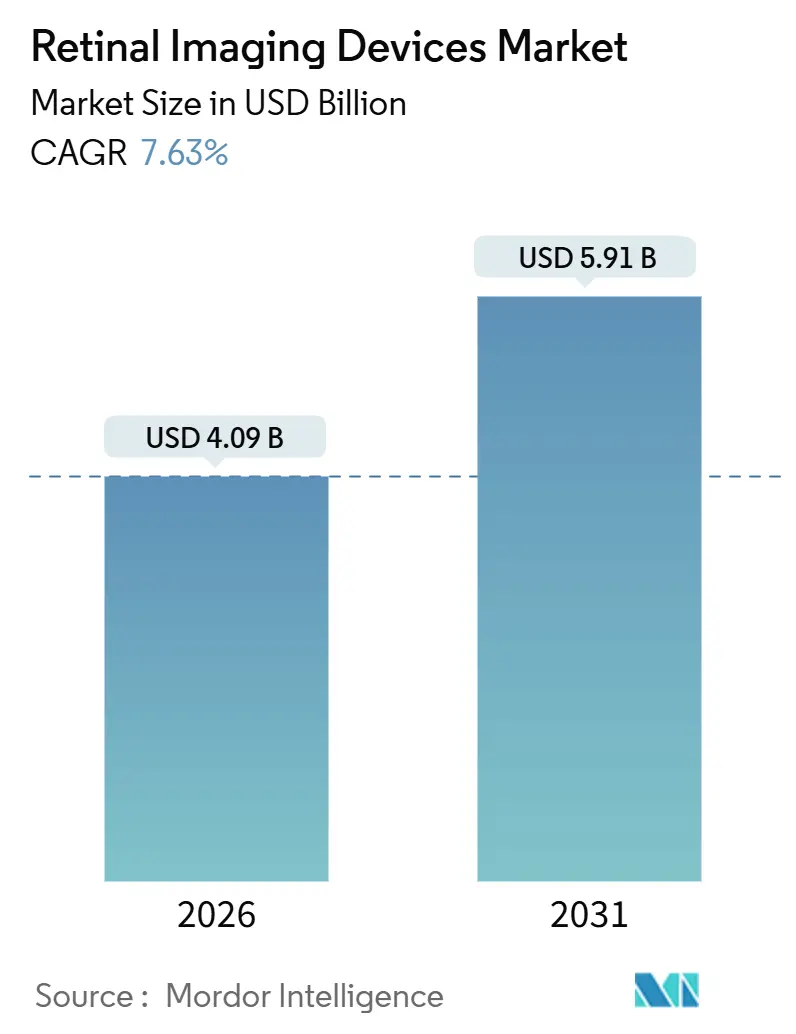
| Market Size (2026) | USD 4.09 Billion |
| Market Size (2031) | USD 5.91 Billion |
| Growth Rate (2026 - 2031) | 7.63% CAGR |
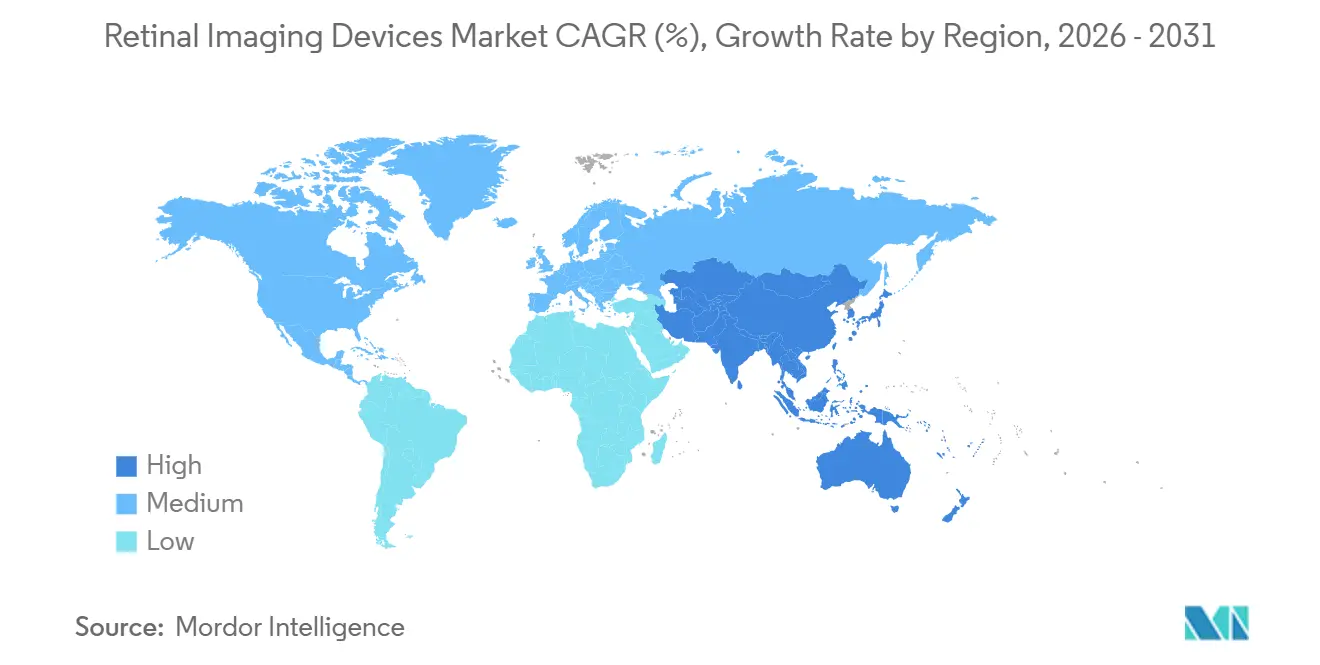
| Fastest Growing Market | Asia Pacific |
| Largest Market | North America |
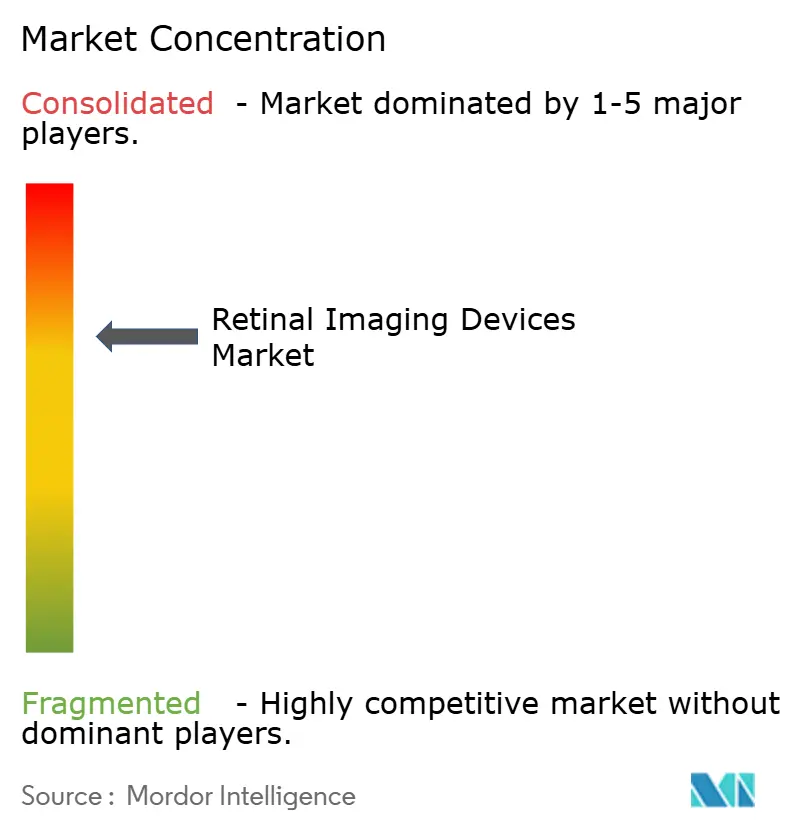
| Market Concentration | Medium |
Major Players *Disclaimer: Major Players sorted in no particular order Image © Mordor Intelligence. Reuse requires attribution under CC BY 4.0. | |
Retinal Imaging Devices Market Analysis by Mordor Intelligence
The Retinal Imaging Devices Market size is estimated at USD 4.09 billion in 2026, and is expected to reach USD 5.91 billion by 2031, at a CAGR of 7.63% during the forecast period (2026-2031).
The expansion stems from the convergence of an aging population burdened by chronic retinal disorders, rapid improvements in multimodal imaging hardware, and government initiatives that embed vision screening into basic health-care benefits. Market participants are using artificial intelligence (AI) modules to enable autonomous image grading, reducing the workload on ophthalmologists and accelerating screening throughput. Subscription-based pricing is lowering the capital barrier for independent clinics. At the same time, reimbursement reforms in high-income countries reward the use of optical coherence tomography (OCT) and ultra-widefield systems in primary care. Competition is shifting toward integrated, cloud-connected platforms that link imaging data with electronic health records, laying the groundwork for coordinated, value-based eye-care delivery.
Key Report Takeaways
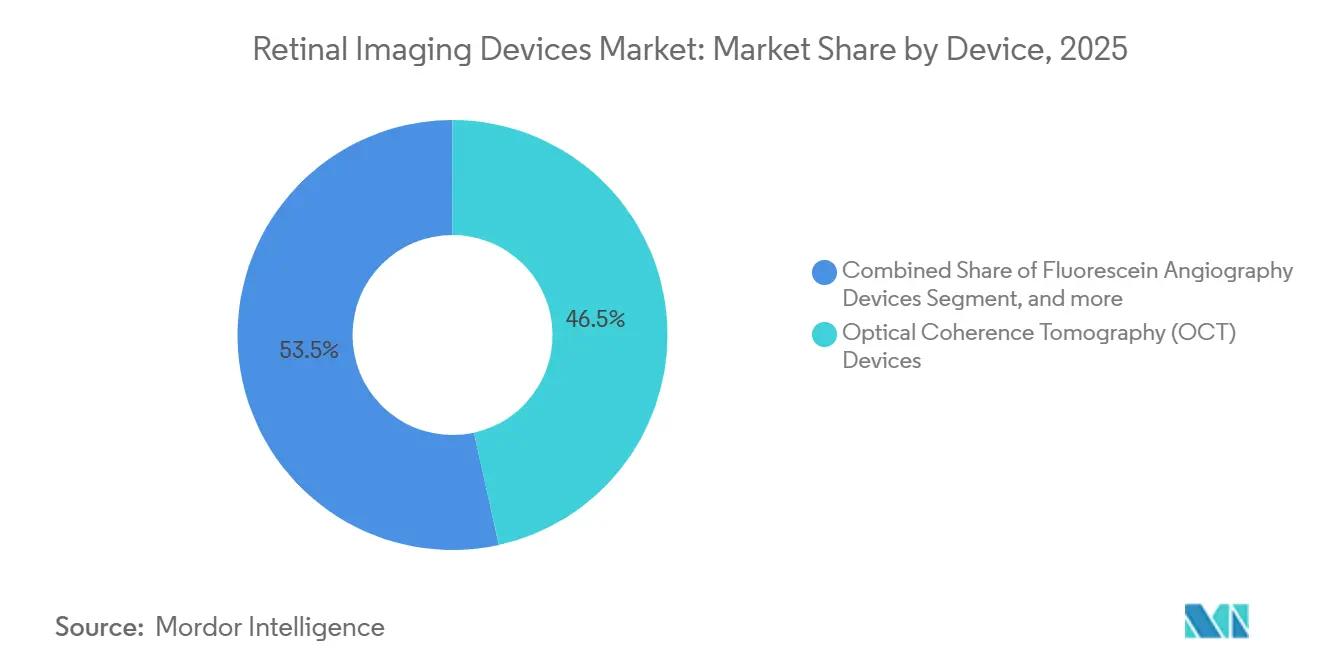
- By device type, optical coherence tomography held 46.54% of the retinal imaging devices market share in 2025. Ultra-widefield systems are forecast to record a 9.54% CAGR through 2031, the fastest among all devices.
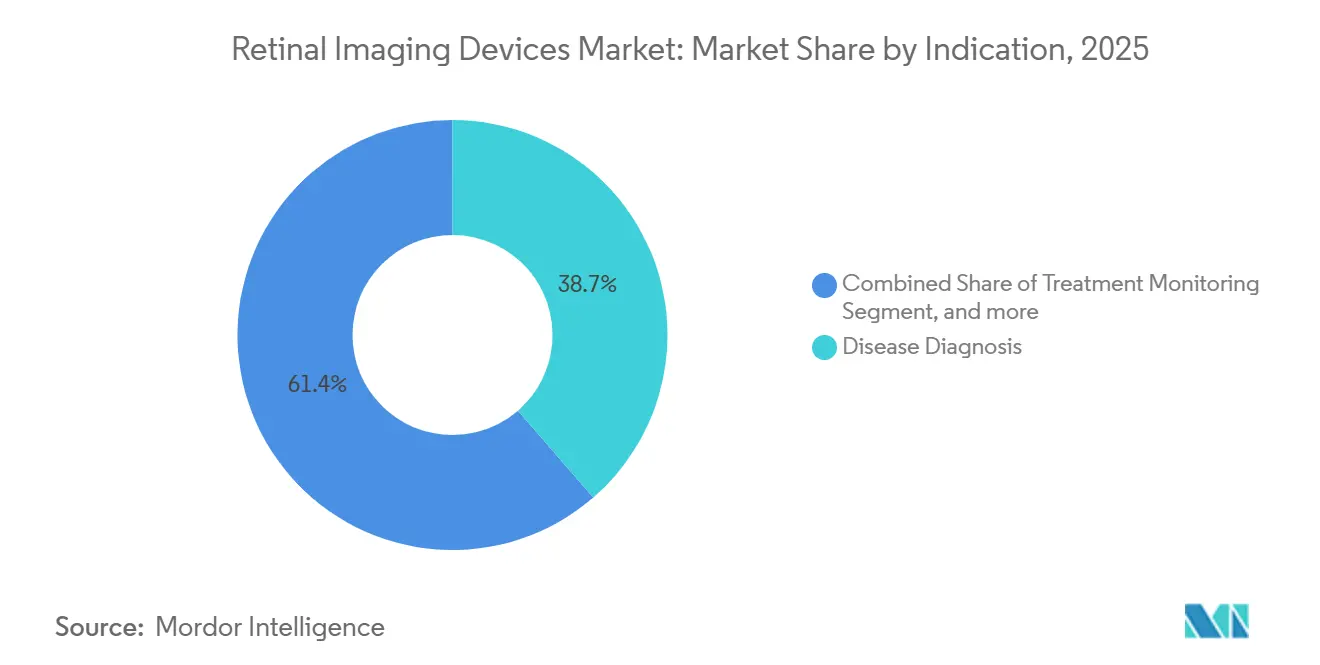
- By application, disease diagnosis accounted for 64.32% of revenue in 2025, while research and development applications are set to grow at a 9.65% CAGR through 2031.
- By indication, diabetic retinopathy accounted for 38.65% of the indication demand in 2025; retinal vein occlusion is expected to post the highest 10.11% CAGR through 2031.
- By end user, hospitals accounted for 54.32% of 2025 revenue, whereas ambulatory surgical centers will expand at a 10.23% CAGR over the forecast period.
- By geography, North America accounted for 42.12% of global turnover in 2025, but Asia-Pacific will lead growth at an 8.54% CAGR through 2031.
Note: Market size and forecast figures in this report are generated using Mordor Intelligence’s proprietary estimation framework, updated with the latest available data and insights as of January 2026.
Global Retinal Imaging Devices Market Trends and Insights
Drivers Impact Analysis*
| Driver | (~) % Impact on CAGR Forecast | Geographic Relevance | Impact Timeline |
|---|---|---|---|
| Growing global burden of chronic retinal disorders | +1.8% | Asia-Pacific and North America | Long term (≥ 4 years) |
| Continuous technological advancements in imaging modalities | +1.5% | North America, Europe, Asia-Pacific | Medium term (2-4 years) |
| Expansion of government-funded vision screening programs | +1.3% | China, India, GCC, South America | Medium term (2-4 years) |
| Rising geriatric population and associated eye-care demand | +1.2% | Japan, Germany, Italy, South Korea | Long term (≥ 4 years) |
| Integration of imaging data into connected care ecosystems | +0.9% | North America, EU, urban APAC | Short term (≤ 2 years) |
| Emergence of outcome-based equipment subscription models | +0.7% | North America, EU, Australia | Short term (≤ 2 years) |
| Source: Mordor Intelligence | |||
Growing Global Burden of Chronic Retinal Disorders
Diabetic retinopathy already affects more than 100 million adults worldwide and is poised to rise with diabetes prevalence reaching 643 million by 2030. Age-related macular degeneration (AMD) incidence climbs sharply after age 60 as longevity increases. Health agencies now recommend automated retinal imaging for non-communicable disease screening, spurring procurement across both developed and emerging markets. China’s urban prevalence of diabetic retinopathy exceeded 24% in 2024, prompting annual fundus-photography mandates that are cascading into provincial budgets. The policy momentum cements a long-duration growth runway for the retinal imaging devices market[1]D. Magliano, “IDF Diabetes Atlas: 10th Edition,” International Diabetes Federation, idf.org.
Continuous Technological Advancements in Imaging Modalities
Swept-source OCT platforms achieve axial resolutions below 5 μm and scan speeds exceeding 200,000 A-scans per second, revealing microvascular changes that older systems miss. In September 2024, the Maestro2 OCTA earned U.S. 510(k) clearance, combining angiography and automated diabetic retinopathy grading in a single unit. Ultra-widefield cameras now capture up to 200° of the retina in a single shot, improving the detection of peripheral lesions associated with retinal vein occlusion. Hand-held OCT units have penetrated neonatal intensive care units, where portability is critical. Together, these innovations shorten acquisition times, reduce motion artifacts, and expand the clinical utility of retinal imaging devices.
Expansion of Government-Funded Vision Screening Programs
NHS England committed GBP 42 million in 2024 to place OCT devices in 1,200 community optometry practices, while New Zealand, India, and China have rolled out national diabetic retinopathy screening pilots that reimburse AI-enabled fundus photography. Such programs guarantee baseline demand and justify localized manufacturing, shielding vendors from cyclical capital-spending risk. The trend is spreading to middle-income economies in South America and the Middle East, broadening the addressable market for retinal imaging devices[2]“Healthy China—Diabetic Retinopathy Screening Guidelines 2024,” National Health Commission of China, nhc.gov.cn.
Rising Geriatric Population and Associated Eye-Care Demand
United Nations projections indicate the 65-plus cohort will exceed 1.6 billion by 2050, with East Asia and Southern Europe bearing the sharpest demographic tilt. AMD prevalence doubles every decade after 60, driving recurring imaging for anti-VEGF therapy monitoring. Japan recorded an 18% rise in ophthalmology visits among residents aged 70 and above between 2020 and 2024, a trend that is pushing hospitals toward automated imaging workflows. Multi-modal platforms that consolidate OCT, fundus photography, and angiography lower patient wait times, a critical factor for frail older adults.
Restraints Impact Analysis*
| Restraint | (~) % Impact on CAGR Forecast | Geographic Relevance | Impact Timeline |
|---|---|---|---|
| High capital expenditure and maintenance costs | -0.9% | Emerging markets, rural North America | Medium term (2-4 years) |
| Shortage of skilled eye-care technicians | -0.6% | Sub-Saharan Africa, South Asia, rural APAC | Long term (≥ 4 years) |
| Limited reimbursement for advanced retinal imaging | -0.5% | North America, Europe, urban APAC | Short term (≤ 2 years) |
| Semiconductor supply-chain volatility | -0.4% | Asia-Pacific production hubs | Short term (≤ 2 years) |
| Source: Mordor Intelligence | |||
High Capital Expenditure and Maintenance Costs
Spectral-domain systems cost USD 80,000–120,000, and swept-source platforms surpass USD 150,000, placing them beyond many low-volume clinics. Annual service contracts add 10–15% of purchase cost, while consumables add USD 5,000–8,000 per year. U.S. reimbursement of USD 50–70 per OCT scan requires at least 1,500 procedures annually to break even. Many rural facilities postpone upgrades, entrenching a two-tier market that clouds near-term growth potential.
Shortage of Skilled Eye-Care Technicians
The United States faces a projected deficit of 9,300 ophthalmic technicians by 2030. Training to competency takes 6–12 months, and scarcity is worse in Sub-Saharan Africa and South Asia, where ratios slip below one technician per 100,000 people. Automated alignment and image-quality feedback can mitigate but not eliminate the need for skilled personnel, slowing throughput in large-scale screening programs[3]“Ophthalmic Technician Shortage Forecast,” American Academy of Ophthalmology, aao.org.
*Our forecasts treat driver/restraint impacts as directional, not additive. The impact forecasts reflect baseline growth, mix effects, and variable interactions.
Segment Analysis
By Device: OCT Dominance Meets Ultra-Widefield Disruption
Optical coherence tomography commanded 46.54% of retinal imaging devices market share in 2025 thanks to its role in macular and glaucoma management. Spectral-domain units remain the workhorse, yet swept-source variants are taking over the replacement cycle due to deeper choroidal penetration and faster scan speeds. Ultra-widefield cameras will log a 9.54% CAGR through 2031, benefiting from 200° one-shot coverage that uncovers peripheral diabetic lesions. Fundus cameras hold volume leadership, but AI-enabled, non-mydriatic designs are eroding market share in the low end. Other devices—such as adaptive optics and hyperspectral cameras—remain research-centric pending reimbursement clarity.


By Application: Disease Diagnosis Anchors, R&D Accelerates
Disease diagnosis retained 64.32% of 2025 revenue as providers follow guideline-mandated imaging for diabetic retinopathy, AMD, and glaucoma. Treatment monitoring expands alongside anti-VEGF regimens that require monthly OCT scans. Research and development will pace a 9.65% CAGR as drug sponsors adopt retinal biomarkers for neurodegeneration and gene-therapy trials. Cloud-based reading centers standardize protocols across multi-site studies, creating incremental lift for the retinal imaging devices market size at the application level.
By Indication: Diabetic Retinopathy Leads, Vein Occlusion Surges
Diabetic retinopathy generated 38.65% of the 2025 demand, anchored by established annual screening guidelines. Retinal vein occlusion will grow fastest at 10.11% CAGR, propelled by anti-VEGF gains that necessitate frequent imaging. AMD remains a perennial driver as wet-form patients undergo serial OCT. Smaller segments—retinal detachment, uveitis—increase the case for multimodal systems that image both the posterior pole and the periphery in a single sitting.
By End-User: Hospitals Dominate, ASCs Gain Momentum
Hospitals held 54.32% of 2025 turnover by virtue of capital depth and embedded technician teams. Ophthalmology group practices are consolidating to garner vendor discounts, while ambulatory surgical centers will post a 10.23% CAGR as payers funnel volume to lower-cost sites. Subscription pricing makes high-end OCT accessible to clinics with less than 5,000 annual visits, sustaining unit diffusion. Mobile screening vans and research institutions form a long-tail segment that provides geographic reach and data for public health analytics.
Geography Analysis
North America accounted for 42.12% of global sales in 2025, supported by Medicare OCT reimbursement under CPT codes 92133 and 92134, which surpassed 15 million scans. The United States houses over 25,000 installed spectral-domain units, and the replacement cycle is tilting toward swept-source models. Canada is scaling AI-based diabetic retinopathy screening in family clinics to shorten specialist wait times. Meanwhile, private Mexican ophthalmology centers are upgrading to differentiate services, though public procurement remains budget-tight.
Asia-Pacific will advance at an 8.54% CAGR to 2031. China’s directive to equip all tier-2 and tier-3 cities with automated screening by 2027 is set to sharply lift unit sales, while India has dedicated INR 3.2 billion (USD 38 million) to portable cameras that feed its blindness-control program. Japan’s 29% elderly population share is already straining eye-care capacity, driving the adoption of AI-enabled workflows. South Korea’s expansion of reimbursement for OCT angiography will double annual procedure volume by 2028. Australia’s shared-care pilots underline the region’s appetite for connected, community-based models.
Europe accounted for about 28% of 2025 revenue. The United Kingdom’s community-optometry roll-out of OCT devices represents the region’s most significant public procurement to date. Germany reimburses OCT for glaucoma and AMD but lags in reimbursing for diabetic retinopathy, leading to a two-speed market. France leans on non-mydriatic cameras for its diabetes screening. GCC nations invest in tertiary-eye centers to attract medical tourists, whereas Sub-Saharan Africa relies on donor-funded portable cameras. South America’s opportunity clusters in Brazil and Argentina, where private chains upgrade to spectral-domain OCT as public-sector tenders remain sporadic.

Competitive Landscape
Carl Zeiss Meditec, Topcon Corporation, and Heidelberg Engineering accounted for roughly 45% of 2025 revenue, indicating moderate concentration in the retinal imaging devices market. Incumbents defend share with bundled service contracts and proprietary software that raises switching costs. Disruptors such as Eyenuk and Remidio deploy cloud-linked, AI-ready fundus cameras through direct partnerships with health ministries and NGOs, leapfrogging conventional distribution channels. Technology leadership hinges on AI integration, multimodal imaging, and interoperability with electronic health records. Patent competition intensifies around swept-source light sources and ultra-widefield optics. Compliance with ISO 13485 and FDA 510(k) remains mandatory, but vendors that secure CE marking early enjoy a tendering head start in Europe.
Retinal Imaging Devices Industry Leaders
Carl Zeiss Meditec AG
Topcon Corporation
NIDEK CO., LTD.
Optos plc (Nikon)
Canon Medical Systems
- *Disclaimer: Major Players sorted in no particular order

Recent Industry Developments
- November 2025: Medtech innovator Remidio Innovative Solutions launched its latest innovation, the Neubo 130. This artificial intelligence-powered ultra-widefield retinal imaging system is designed with neonatal care in mind. The device revolutionises the process of diagnosis and follow-up of Retinopathy of Prematurity (ROP) and other eye diseases in babies.
- October 2025: Optos launched Silverstone RGB. Building on its flagship Silverstone platform, the new system delivers a suite of 9 imaging modalities in a single device, establishing a new benchmark in retinal imaging technology.
- July 2025: Optomed USA launched its latest innovation: Optomed Lumo, a next-generation handheld fundus camera designed to bring high-quality retinal imaging into primary care and beyond.


Global Retinal Imaging Devices Market Report Scope
As per the scope of the report, retinal imaging devices are specialized medical tools used to capture detailed images of the retina, the light-sensitive tissue at the back of the eye. They aid in diagnosing and monitoring eye conditions such as diabetic retinopathy, macular degeneration, and glaucoma. These devices improve early detection and treatment planning for various retinal diseases.
The Retinal Imaging Devices Market is Segmented by Device (OCT Devices, Fluorescein Angiography Devices, Fundus Cameras, Retinal Ultrasound Imaging Systems, Ultra-Widefield Devices, Widefield Devices, and Other Devices), Application (Disease Diagnosis, Treatment Monitoring, R&D), Indication (Diabetic Retinopathy, AMD, Glaucoma, Retinal Vein Occlusion, and Other Indications), End-User (Hospitals, Ophthalmology Clinics, ASCs, and Other End-Users), and Geography (North America, Europe, Asia-Pacific, MEA, and South America). The market report also covers the estimated market sizes and trends for 17 countries across major regions globally. The report offers the value (in USD million) for the above segments.
| Optical Coherence Tomography (OCT) Devices | Spectral-Domain OCT (SD-OCT) |
| Swept-Source OCT (SS-OCT) | |
| Hand-Held OCT | |
| Fluorescein Angiography Devices | |
| Fundus Cameras | Mydriatic Fundus Cameras |
| Non-Mydriatic Fundus Cameras | |
| Hybrid Fundus Cameras | |
| ROP Fundus Cameras | |
| Retinal Ultrasound Imaging Systems | Ophthalmic A-Scan Ultrasound |
| Ophthalmic B-Scan Ultrasound | |
| Ophthalmic Ultrasound Biomicroscopes | |
| Ophthalmic Pachymeters | |
| Ultra-Widefield Retinal Imaging Devices | |
| Widefield Retinal Imaging Devices | |
| Other Devices |
| Disease Diagnosis |
| Treatment Monitoring |
| Research & Development |
| Diabetic Retinopathy |
| Age-Related Macular Degeneration (AMD) |
| Glaucoma |
| Retinal Vein Occlusion |
| Other Indications |
| Hospitals |
| Ophthalmology Clinics |
| Ambulatory Surgical Centers (ASCs) |
| Other End-Users |
| North America | United States |
| Canada | |
| Mexico | |
| Europe | Germany |
| United Kingdom | |
| France | |
| Italy | |
| Spain | |
| Rest Of Europe | |
| Asia-Pacific | China |
| Japan | |
| India | |
| Australia | |
| South Korea | |
| Rest Of Asia-Pacific | |
| Middle East & Africa | GCC |
| South Africa | |
| Rest Of Middle East & Africa | |
| South America | Brazil |
| Argentina | |
| Rest Of South America |
| By Device | Optical Coherence Tomography (OCT) Devices | Spectral-Domain OCT (SD-OCT) |
| Swept-Source OCT (SS-OCT) | ||
| Hand-Held OCT | ||
| Fluorescein Angiography Devices | ||
| Fundus Cameras | Mydriatic Fundus Cameras | |
| Non-Mydriatic Fundus Cameras | ||
| Hybrid Fundus Cameras | ||
| ROP Fundus Cameras | ||
| Retinal Ultrasound Imaging Systems | Ophthalmic A-Scan Ultrasound | |
| Ophthalmic B-Scan Ultrasound | ||
| Ophthalmic Ultrasound Biomicroscopes | ||
| Ophthalmic Pachymeters | ||
| Ultra-Widefield Retinal Imaging Devices | ||
| Widefield Retinal Imaging Devices | ||
| Other Devices | ||
| By Application | Disease Diagnosis | |
| Treatment Monitoring | ||
| Research & Development | ||
| By Indication | Diabetic Retinopathy | |
| Age-Related Macular Degeneration (AMD) | ||
| Glaucoma | ||
| Retinal Vein Occlusion | ||
| Other Indications | ||
| By End-User | Hospitals | |
| Ophthalmology Clinics | ||
| Ambulatory Surgical Centers (ASCs) | ||
| Other End-Users | ||
| Geography | North America | United States |
| Canada | ||
| Mexico | ||
| Europe | Germany | |
| United Kingdom | ||
| France | ||
| Italy | ||
| Spain | ||
| Rest Of Europe | ||
| Asia-Pacific | China | |
| Japan | ||
| India | ||
| Australia | ||
| South Korea | ||
| Rest Of Asia-Pacific | ||
| Middle East & Africa | GCC | |
| South Africa | ||
| Rest Of Middle East & Africa | ||
| South America | Brazil | |
| Argentina | ||
| Rest Of South America | ||


Key Questions Answered in the Report
Which imaging modality leads global demand in retinal care?
Optical coherence tomography accounts for 46.54% of global revenue due to its utility in macular, glaucoma, and choroidal assessments.
What growth rate is expected for ultra-widefield cameras?
Ultra-widefield systems are projected to expand at a 9.54% CAGR between 2026 and 2031.
How are subscription models changing equipment acquisition?
Monthly bundles of USD 2,500-4,000 spread software updates, calibration, and support over time, enabling clinics with limited capital to deploy advanced imaging.
Why is Asia-Pacific the fastest growing region?
Government mandates for diabetic retinopathy screening in China and India, coupled with aging demographics in Japan and South Korea, underpin an 8.54% CAGR through 2031.
What is the main restraint curbing wider adoption in small practices?
High capital outlays of USD 80,000-150,000 plus 10-15% annual maintenance fees delay upgrades, especially where procedure volumes fall below breakeven thresholds.
Page last updated on:


