
Retail Personalization Services Market Size and Share
Market Overview
| Study Period | 2020 - 2031 |
|---|---|
| Market Size (2026) | USD 6.32 Billion |
| Market Size (2031) | USD 13.85 Billion |
| Growth Rate (2026 - 2031) | 16.99 % |
| Fastest Growing Market | Asia-Pacific |
| Largest Market | North America |
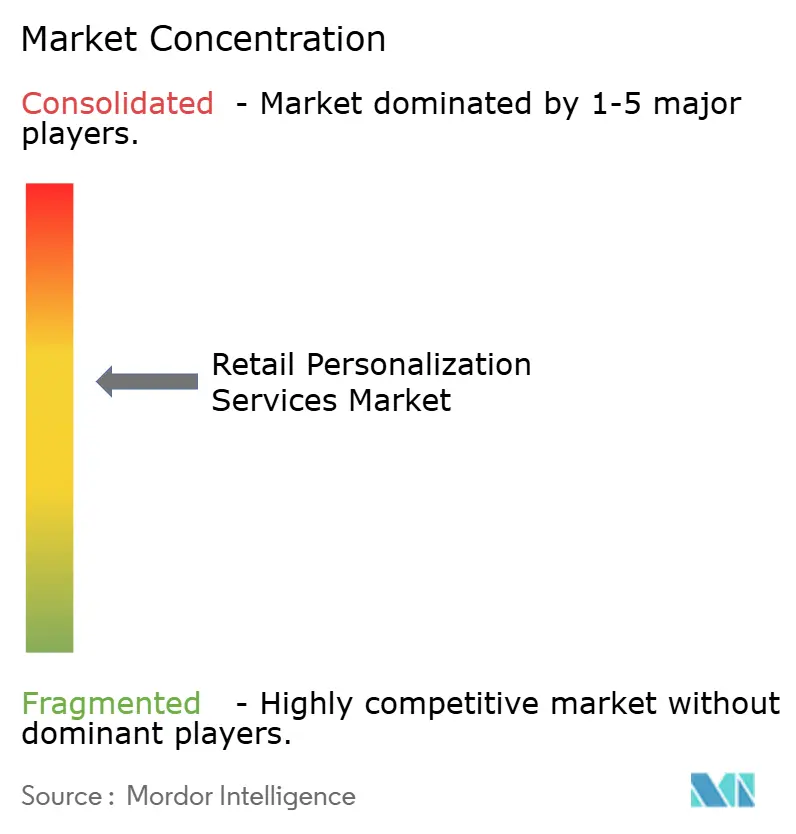
| Market Concentration | Medium |
Major Players *Disclaimer: Major Players sorted in no particular order Image © Mordor Intelligence. Reuse requires attribution under CC BY 4.0. | |
Retail Personalization Services Market Analysis by Mordor Intelligence
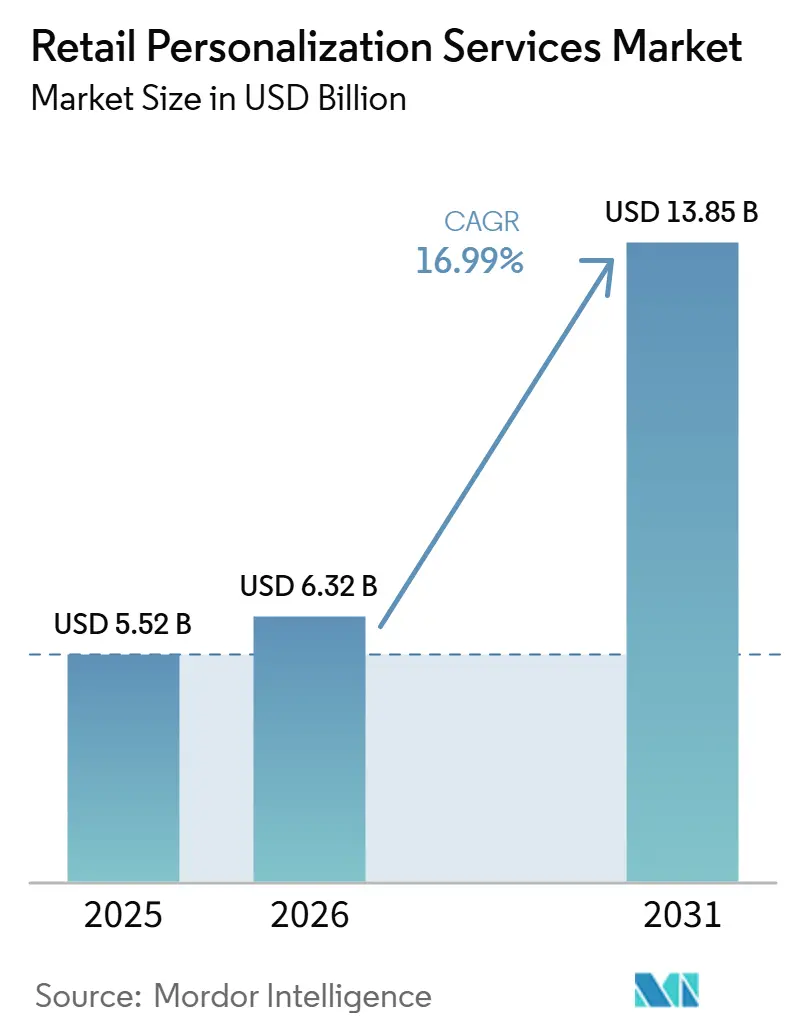
The Retail Personalization Services Market size is projected to expand from USD 5.52 billion in 2025 and USD 6.32 billion in 2026 to USD 13.85 billion by 2031, registering a CAGR of 16.99% between 2026 and 2031. Generative AI and first-party data systems are making individualized experiences more practical for mid-sized and smaller retailers. Higher paid-media costs are also shifting attention toward extracting more value from existing customer traffic and owned data. Retailers are increasingly treating customer data as a way to protect margins, rather than only as a customer experience tool. This creates opportunities for providers that combine personalization, consent management, and measurable commercial outcomes in one service.
Key Report Takeaways
- By application, Product Recommendations held 25.27% of the Retail Personalization Services Market share in 2025, while Customer Journey Orchestration is projected to grow at a CAGR of 19.22% through 2031.
- By enterprise size, Large Enterprises accounted for 62.66% of the overall market in 2025, while small and medium-sized enterprises are expected to expand at a CAGR of 18.21% through 2031.
- By end-user industry, Fashion and Apparel accounted for 22.25% of the Retail Personalization Services Market size in 2025, while Luxury and Specialty Retail is projected to grow at a CAGR of 19.23% through 2031.
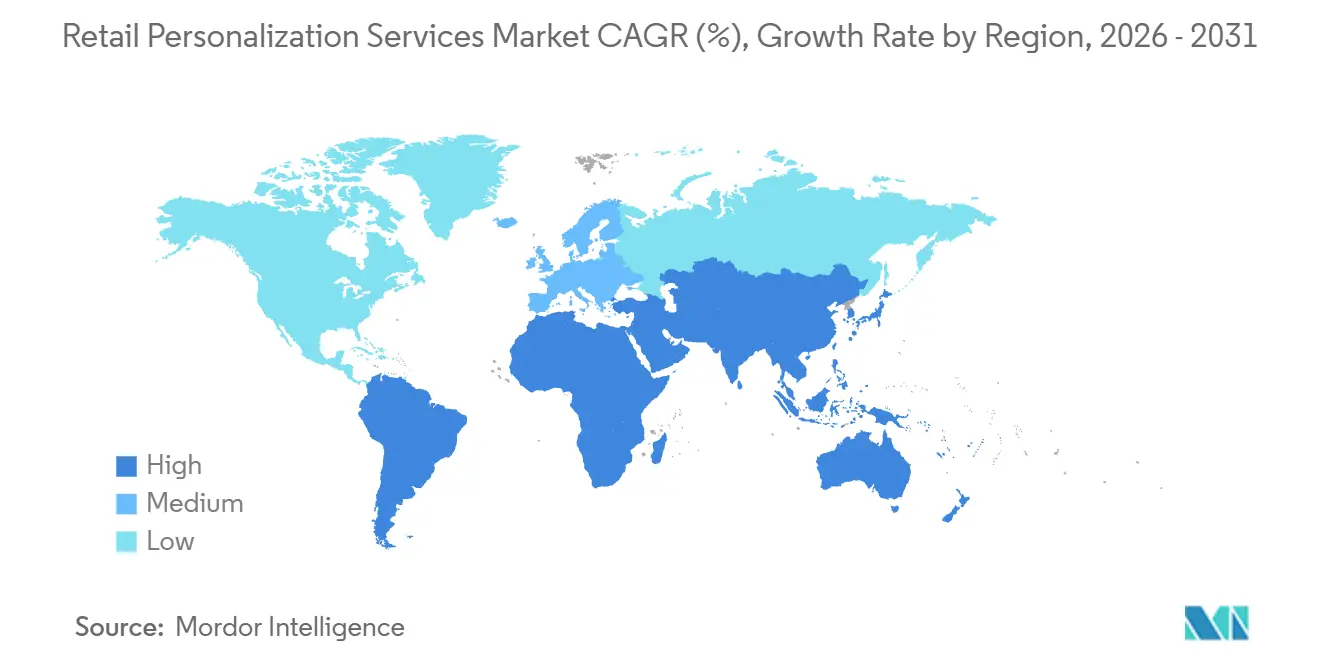
- By geography, North America held 36.39% of the global market in 2025, while Asia-Pacific is projected to expand at a CAGR of 20.23% through 2031.
Note: Market size and forecast figures in this report are generated using Mordor Intelligence’s proprietary estimation framework, updated with the latest available data and insights as of January 2026.
Market Trends and Insights
Drivers Impact Analysis of Retail Personalization Services Market*
| Driver | (~) % Impact on CAGR Forecast | Geographic Relevance | Impact Timeline |
|---|---|---|---|
| Demand for Individual Omnichannel Shopping Experiences | +3.0% | Global, with early deployment gains in North America and Western Europe | Medium term (2-4 years) |
| AI-Led Product Discovery and Search | +2.8% | Global, particularly North America, Asia-Pacific, and Northern Europe | Medium term (2-4 years) |
| First-Party Data and Retail Media Activation | +2.5% | North America and Europe, with spillover to Asia-Pacific and the Middle East | Short term (≤ 2 years) |
| Need to Improve Conversion and Margin | +2.0% | Global | Short term (≤ 2 years) |
| Generative AI for Content and Offer Personalization | +1.8% | Global, with faster uptake in North America and Asia-Pacific | Medium term (2-4 years) |
| Associate Copilots and Clienteling Across Channels | +1.3% | North America, Western Europe, and Japan | Long term (≥ 4 years) |
| Source: Mordor Intelligence | |||
Rising Demand for Individual Omnichannel Shopping Experiences
Retailers increasingly need connected experiences across stores, websites, applications, and messaging channels. The Retail Personalization Services Market benefits when behavioral signals from these touchpoints are linked to a usable customer profile. Such profiles allow retailers to respond to a shopper’s recent activity rather than rely on broad campaign rules. Connected profiles also make it easier to maintain consistent service when a shopper moves between digital and physical channels. As retailers collect richer first-party data, the quality of that data becomes more important than the personalization engine alone. This increases demand for systems that can make consented data available to the teams responsible for customer interactions.
Expanding Use of AI-Led Product Discovery and Search
AI-led discovery is changing retail search from keyword matching to a process that can consider intent, inventory, product attributes, and shopper behavior. This supports the Retail Personalization Services Market because site search is often a high-intent point in the purchase path. Algolia launched Dynamic Facets in July 2026 to adapt product filters to search context and user behavior without manual configuration.[1]Algolia, “Algolia Launches Dynamic Facets to Make Product Discovery Faster, Smarter, and More Relevant,” Algolia, algolia.com. Coveo introduced Conversational Product Discovery in March 2026, placing natural-language product dialogue directly within commerce search. Retailers with reliable product information and current inventory feeds can deliver more relevant search results than those with incomplete catalog records. Product data governance therefore becomes part of the commercial case for personalization services.[2]Coveo, “Coveo Redefines Ecommerce Discovery With Search-Native Conversational AI,” Coveo, coveo.com.
Growing Shift to First-Party Data and Retail Media Activation
The loss of third-party signals has increased the value of consented first-party data for campaign measurement and personalization. Retailers need behavioral and transactional data, not only email lists, to build useful audience models. The Retail Personalization Services Market gains from this shift because the same customer profile can support retention programs, retail media, and on-site decisions. Klaviyo announced a February 2026 partnership with Google that connects purchase-intent signals from Google surfaces to Klaviyo customer profiles. Retailers that began collecting consented data earlier can use a longer history of purchases and interactions to improve their models. This can widen the difference between retailers with mature data practices and those just starting the work.[3]Klaviyo, “Klaviyo and Google Announce Strategic Partnership to Power Autonomous Customer Experiences,” Klaviyo Newsroom, klaviyo.com.
Need to Lift Conversion and Margin in Higher-Cost Acquisition Environments
Higher customer acquisition costs make it more important for retailers to improve the value of existing visits. Personalized offers, recommendations, and messages can support this goal when they are tied to product availability and margin rules. The Retail Personalization Services Market is therefore shaped by the need to improve margin per session, not merely conversion rates. Generative AI can reduce the manual work needed to produce multiple versions of product content and offers. Poorly controlled promotion strategies may reduce profitability even when response rates rise. Providers that bring promotional margin data into decisioning systems are better positioned within the Retail Personalization Services Market.
Restraints Impact Analysis of Retail Personalization Services Market*
| Restraint | (~) % Impact on CAGR Forecast | Geographic Relevance | Impact Timeline |
|---|---|---|---|
| Data Privacy, Consent, and Cross-Border Compliance | -2.0% | Europe, North America, and expanding Asia-Pacific requirements | Short term (≤ 2 years) |
| Integration Across Commerce, CRM, CDP, and POS Systems | -1.7% | Global | Medium term (2-4 years) |
| Identity Fragmentation and Walled-Garden Checkout Paths | -1.2% | Global, with greater severity in North America and Western Europe | Medium term (2-4 years) |
| Content Operations for Frequent Personalization Testing | -0.8% | Global | Long term (≥ 4 years) |
| Source: Mordor Intelligence | |||
Data Privacy, Consent, and Cross-Border Data Compliance Complexity
Data privacy and algorithmic accountability requirements can make it harder to deploy personalization programs across multiple jurisdictions. The Retail Personalization Services Market faces added complexity when retailers must apply different consent, deletion, disclosure, and audit practices to the same program. The California Consumer Privacy Act, effective in 2026, establishes consumer privacy rights and business obligations in California. A retailer serving Europe, California, and Gulf Cooperation Council markets may need separate approaches to transparency and data handling. This burden is greater for smaller brands without large legal or technical compliance teams. Providers that embed consent controls and audit features into their platforms can reduce retailers' need to add separate tools.[4]Microsoft, “Real-Time Web Tracking and Personalization for Known and Unknown Users,” Microsoft Dynamics 365 Release Plan, learn.microsoft.com.
Integration Challenges Across Commerce, CRM, CDP, and POS Stacks
A mature personalization program connects a commerce platform, a customer relationship management system, a customer data platform, a personalization engine, and campaign tools. Each connection can introduce delays, inconsistent data fields, and ownership issues that weaken real-time decisions. Integration work often crosses marketing, information technology, and commerce teams with separate budgets and release schedules. This can extend deployment periods and raise the cost of custom work. Integrated platforms may reduce the number of connection points, but retailers using established best-of-breed systems can face disruption when changing their architecture. The need to preserve reliable data flows can therefore delay adoption even when the commercial case is clear.
*Our forecasts treat driver/restraint impacts as directional, not additive. The impact forecasts reflect baseline growth, mix effects, and variable interactions.
Retail Personalization Services Market Segment Analysis
By Application:
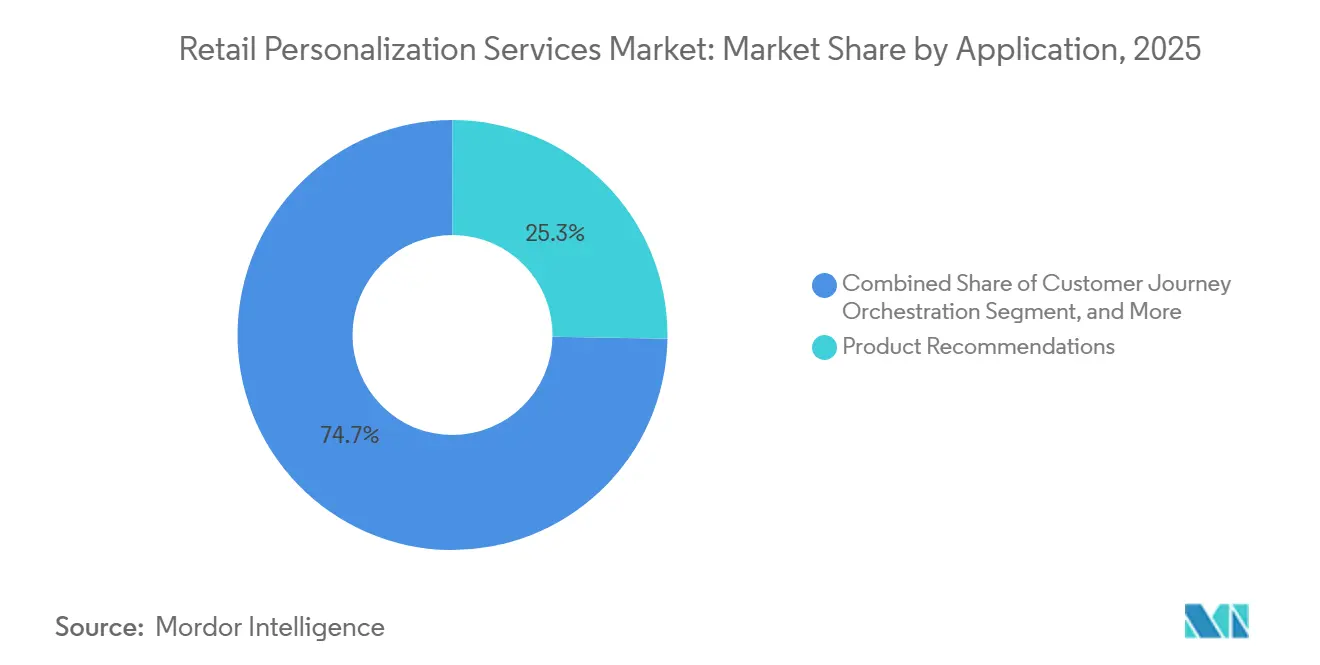
Product Recommendations Lead While Journey Orchestration Gains PaceProduct Recommendations captured 25.27% of the Retail Personalization Services Market share in 2025, making it the largest application segment. Retailers value the application because sales from a recommendation placement can be compared with a control group. Personalized Search and Merchandising is also important because search activity often indicates immediate purchase interest. Loyalty and Offer Personalization supports a move away from broad discount campaigns, while Customer Segmentation and Analytics supplies the audience understanding needed by other applications. These established uses provide the Retail Personalization Services Market with a broad base of demand.
Customer Journey Orchestration is expected to grow at a CAGR of 19.22% from 2026 to 2031, the highest growth rate among applications. Retailers are seeking systems that coordinate customer data platforms and channel tools around real-time behavior. Bloomreach made its Loomi marketing agent generally available in June 2026, with the product designed to turn a marketer prompt into a workflow with segmentation, content, and behavior-based automation. Content Personalization remains the smallest defined application segment, but generative AI can reduce the time needed to produce individual content variants. The application mix is moving from separate tools toward coordinated customer interactions.



By Enterprise Size:
Large Enterprises Lead as SMEs Narrow the GapLarge Enterprises accounted for 62.66% of the Retail Personalization Services Market in 2025. Their position reflects the cost of enterprise software, the effort required to connect systems, and the governance needed for multichannel data. Adobe Experience Cloud, Salesforce Marketing Cloud, and SAP Engagement Cloud have historically served retailers able to support large contracts and complex implementations. Large retailers also have more internal capacity for data policies, testing, and campaign operations. Implementation depth can reinforce renewals even when alternative products improve.
Small and medium-sized enterprises are projected to expand at a CAGR of 18.21% through 2031. No-code and low-code tools are reducing the engineering resources needed for adoption by smaller retailers. Bloomreach launched Loomi AI for Shopify in April 2026 as a single application that connects Shopify merchants with marketing, search, and on-site personalization functions. Klaviyo introduced Composer in March 2026 to generate marketing campaigns and flows from a single prompt. The Retail Personalization Services Market gains a wider customer base, but providers must retain merchants as similar features become more available.
By End-User Industry:
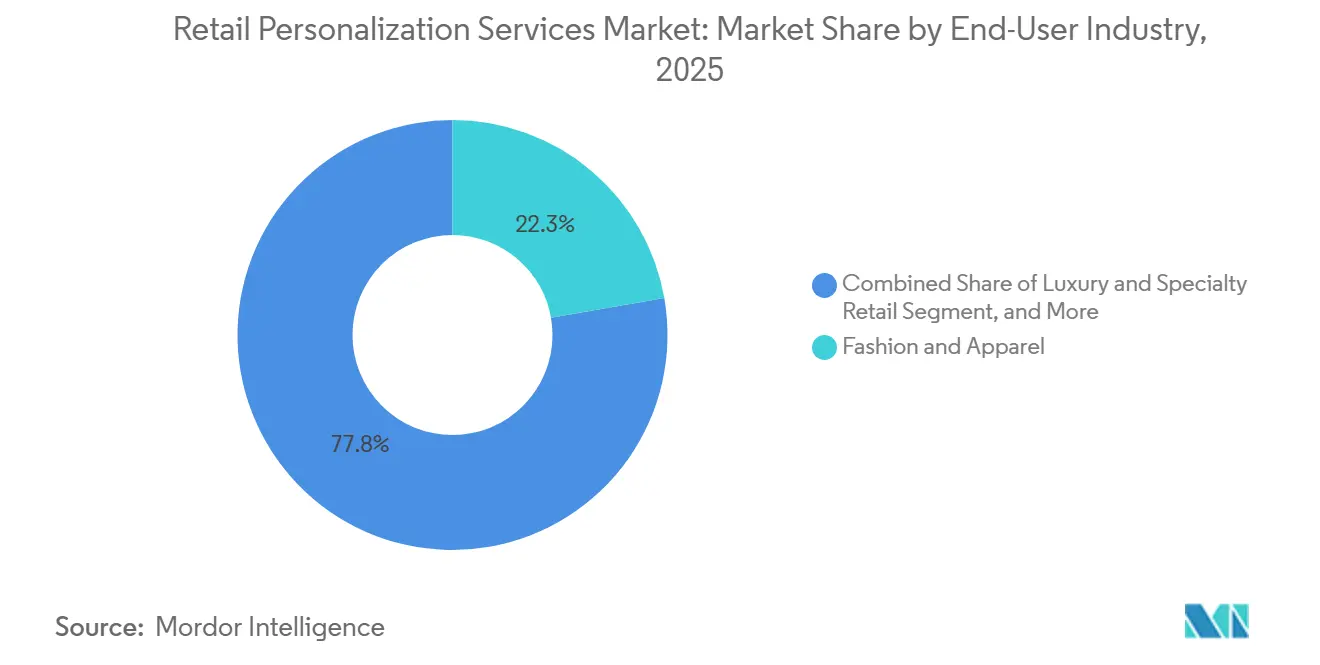
Fashion Leads While Luxury Grows FastestFashion and Apparel held 22.25% of the Retail Personalization Services Market in 2025, the largest share among end-user industries. Fast product turnover, complex sizing, and digital consumer engagement support tailored recommendations in this category. Retailers can apply personalization to product discovery, visual content, sizing guidance, and assortment decisions. Beauty and Personal Care, Grocery and FMCG, Consumer Electronics, Home Furnishings and Home Improvement, and Department Stores and Marketplaces make up smaller, defined segments. Grocery and FMCG can use loyalty data and frequent purchases for replenishment and cross-category offers.
Luxury and Specialty Retail is projected to grow at a CAGR of 19.23% from 2026 to 2031, the fastest rate among end-user industries. Luxury retailers use technology to extend clienteling while preserving service standards that uphold the exclusivity of their brands. For this segment, the value can come from recognizing when not to contact a customer and from recommending another product. Systems that combine store-associate information with digital behavior can support more considered outreach. These capabilities can command higher contract values because they support relationship quality rather than only transaction volume.
Geography Analysis
North America and Europe Retail Personalization Services Market
North America held 36.39% of the global Retail Personalization Services Market in 2025. The United States supports this position through high e-commerce adoption, a large concentration of enterprise retailers, and early adoption of customer data platforms. Canada and Mexico remain earlier-stage markets relative to the United States, but benefit from vendor ecosystems and retail groups with regional operations. Europe is the second-largest geography, led by Germany, the United Kingdom, and France. European demand for AI-led personalization is substantial, but data residency and privacy requirements can slow data activation.
APAC Retail Personalization Services Market
Asia-Pacific is projected to grow at a CAGR of 20.23% through 2031, the fastest regional rate in the Retail Personalization Services Market. China, India, South Korea, and Japan are expected to generate much of the new demand. Isetan Mitsukoshi reported a 1.4x improvement in click-through rate, a 1.4x increase in cart additions, and a 1.3x lift in conversion after deploying a personalization AI system in its e-commerce operations. These markets favor approaches that work within highly digital and mobile-led retail environments.
MEA and South America Retail Personalization Services Market
South America, the Middle East, and Africa remain earlier-stage geographies with different paths to adoption. Brazil is the leading South American opportunity because of its large e-commerce base, while retailers in Argentina and Chile are increasing investment as digital commerce expands. The United Arab Emirates and Saudi Arabia are seeing growing demand from digitally active consumers and smart retail investment. South Africa, Egypt, and Nigeria are among the African markets where mobile commerce infrastructure is supporting initial deployments. Across these regions, mobile-first commerce can favor messaging tools and application-based experiences over browser-dependent personalization engines.

Competitive Landscape
The Retail Personalization Services Market has a moderately concentrated enterprise tier. Adobe, Salesforce, SAP, Microsoft, and Amazon Web Services compete on platform breadth, data connections, and implementation networks. Bloomreach, Klaviyo, Braze, Coveo, and Algolia compete actively for mid-sized and growth-oriented retailers. Enterprise customers increasingly seek fewer platforms that can share data without extensive middleware. This preference strengthens the case for vendors that combine customer data, search, content, messaging, and decisioning into a single customer profile.
Algolia enhanced Agent Studio in July 2026 to help retailers build AI agents grounded in trusted product catalog data. The development places data quality and catalog information at the center of competition. The Retail Personalization Services Market is moving beyond isolated recommendation tools toward broader commerce infrastructure. This shift rewards providers that can make product information useful across search, recommendations, and customer engagement.
Opportunities remain in Home Furnishings and Home Improvement, where specialized templates are less common. In-store personalization also remains difficult because retailers must connect digital behavior with associate workflows. Endear launched its AI Opportunity Engine in May 2026 and reported a 35x increase in the return on store-associate outreach in early apparel-store deployments. Providers with Shopify-native connections, self-service onboarding, and consumption-based pricing are putting pressure on traditional mid-market contracts. The Retail Personalization Services Market remains competitive because no-code tools can reduce switching barriers for retailers without requiring enterprise-scale implementation.
Retail Personalization Services Industry Leaders
Salesforce, Inc.
Adobe Inc.
SAP SE
Oracle Corporation
IBM Corporation
- *Disclaimer: Major Players sorted in no particular order
Retail Personalization Services Market Companies Covered in this Report
- Adobe Inc.
- Salesforce, Inc.
- SAP SE
- Mastercard International Incorporated
- Bloomreach, Inc.
- Coveo Solutions Inc.
- Algolia, Inc.
- Nosto Solutions Ltd.
- Monetate, Inc.
- Insider by Sosyo Plus Bilgi Bilisim Tekn. Dan. Hiz. Tic. A.S.
- Braze, Inc.
- Klaviyo, Inc.
- Bluecore, Inc.
- Twilio Inc.
- Microsoft Corporation
- Google LLC
- Amazon Web Services, Inc.
- International Business Machines Corporation
- Sitecore A/S
- Optimizely North America Inc.
- PartnerCentric, Inc.
- Rise Interactive Holdings, LLC

Recent Industry Developments in Retail Personalization Services Market
- July 2026: Algolia announced significant enhancements to Agent Studio, enabling retailers to build and optimize agentic commerce experiences grounded in trusted product catalog data, extending AI-powered search and discovery into fully agentic shopping journeys for more than 18,000 business customers globally. The release positions Algolia as a central infrastructure layer for retailers deploying autonomous commerce agents across storefronts.
- July 2026: Salesforce invested in Callimacus, the agentic AI platform developed by Solomei AI, the holding company of luxury fashion brand Brunello Cucinelli, to accelerate commercial growth in Europe and North America. The investment validates the convergence of luxury clienteling and enterprise AI personalization platforms as a distinct high-value sub-market.
- July 2026: Algolia launched Dynamic Facets, a capability that automatically surfaces the most relevant product filters based on active search context and user behavior, reducing manual merchandiser configuration and improving product discovery speed for retailers managing large catalogs.
- June 2026: Klaviyo and Lightspeed Commerce launched an expanded integration connecting Klaviyo's autonomous B2C CRM with Lightspeed Retail, enabling real-time synchronized email, SMS, and omnichannel marketing campaigns for merchants across more than 100 countries.


Global Retail Personalization Services Market Report Scope
The retail personalization services market comprises professional, consulting, and managed services designed to help retail brands deliver highly tailored, relevant shopping experiences to individual consumers across digital and physical touchpoints. This market excludes the underlying software platforms and focuses instead on the human expertise required to strategize, implement, integrate, and optimize personalization technologies. These services leverage customer data, AI-driven analytics, and machine learning models to power applications such as product recommendations, personalized search and merchandising, loyalty personalization, and end-to-end customer journey orchestration. Catering to both large enterprises and small and medium-sized enterprises across various retail sub-sectors, including fashion and apparel, beauty, grocery, consumer electronics, and luxury retail, these services enable businesses to enhance customer engagement, increase conversion rates, boost average order values, and build long-term brand loyalty in an increasingly competitive and experience-driven retail landscape.
The Retail Personalization Services Market Report is Segmented by Application (Product Recommendations, Personalized Search and Merchandising, Loyalty and Offer Personalization, Customer Segmentation and Analytics, Customer Journey Orchestration, Content Personalization, and Others), Enterprise Size (Large Enterprises, and Small and Medium-sized Enterprises), End-User Industry (Fashion and Apparel, Beauty and Personal Care, Grocery and FMCG, Consumer Electronics, Home Furnishings and Home Improvement, Luxury and Specialty Retail, and Department Stores and Marketplaces), and Geography (North America, South America, Europe, Asia-Pacific, Middle East, and Africa). The Market Forecasts are Provided in Terms of Value (USD).
| Product Recommendations |
| Personalized Search and Merchandising |
| Loyalty and Offer Personalization |
| Customer Segmentation and Analytics |
| Customer Journey Orchestration |
| Content Personalization |
| Other Applications |
| Large Enterprises |
| Small and Medium-sized Enterprises |
| Fashion and Apparel |
| Beauty and Personal Care |
| Grocery and FMCG |
| Consumer Electronics |
| Home Furnishings and Home Improvement |
| Luxury and Specialty Retail |
| Department Stores and Marketplaces |
| North America | United States |
| Canada | |
| Mexico | |
| South America | Brazil |
| Argentina | |
| Chile | |
| Rest of South America | |
| Europe | Germany |
| United Kingdom | |
| France | |
| Italy | |
| Spain | |
| Rest of Europe | |
| Asia-Pacific | China |
| Japan | |
| India | |
| South Korea | |
| Australia | |
| Rest of Asia-Pacific | |
| Middle East | United Arab Emirates |
| Saudi Arabia | |
| Qatar | |
| Rest of Middle East | |
| Africa | South Africa |
| Egypt | |
| Nigeria | |
| Rest of Africa |
| By Application | Product Recommendations | |
| Personalized Search and Merchandising | ||
| Loyalty and Offer Personalization | ||
| Customer Segmentation and Analytics | ||
| Customer Journey Orchestration | ||
| Content Personalization | ||
| Other Applications | ||
| By Enterprise Size | Large Enterprises | |
| Small and Medium-sized Enterprises | ||
| By End-User Industry | Fashion and Apparel | |
| Beauty and Personal Care | ||
| Grocery and FMCG | ||
| Consumer Electronics | ||
| Home Furnishings and Home Improvement | ||
| Luxury and Specialty Retail | ||
| Department Stores and Marketplaces | ||
| By Geography | North America | United States |
| Canada | ||
| Mexico | ||
| South America | Brazil | |
| Argentina | ||
| Chile | ||
| Rest of South America | ||
| Europe | Germany | |
| United Kingdom | ||
| France | ||
| Italy | ||
| Spain | ||
| Rest of Europe | ||
| Asia-Pacific | China | |
| Japan | ||
| India | ||
| South Korea | ||
| Australia | ||
| Rest of Asia-Pacific | ||
| Middle East | United Arab Emirates | |
| Saudi Arabia | ||
| Qatar | ||
| Rest of Middle East | ||
| Africa | South Africa | |
| Egypt | ||
| Nigeria | ||
| Rest of Africa | ||


Key Questions Answered in the Report
What is the size of the Retail Personalization Services Market?
The Retail Personalization Services Market is projected to grow from USD 6.32 billion in 2026 to USD 13.85 billion by 2031, at a CAGR of 16.99%.
Which retail personalization application is growing fastest?
Customer Journey Orchestration is projected to grow at a CAGR of 19.22% through 2031 as retailers coordinate behavior-based interactions across channels.
Why are retailers investing in first-party data?
First-party behavioral and transactional data can support personalized experiences, retail media activation, and better campaign measurement as third-party signals decline.
Which retail vertical has the highest projected growth?
Luxury and Specialty Retail is projected to grow at a CAGR of 19.23% through 2031, supported by AI-enabled clienteling and more considered customer outreach.
Which region is expected to grow fastest through 2031?
Asia-Pacific is projected to grow at a CAGR of 20.23% through 2031, led by China, India, South Korea, and Japan.
What are the main barriers to adopting personalization services?
The main barriers are data privacy requirements, consent management, cross-border compliance, and integration across commerce, CRM, CDP, and POS systems.
Page last updated on:





