
Radar Level Transmitter Market Size and Share
Market Overview
| Study Period | 2020 - 2031 |
|---|---|
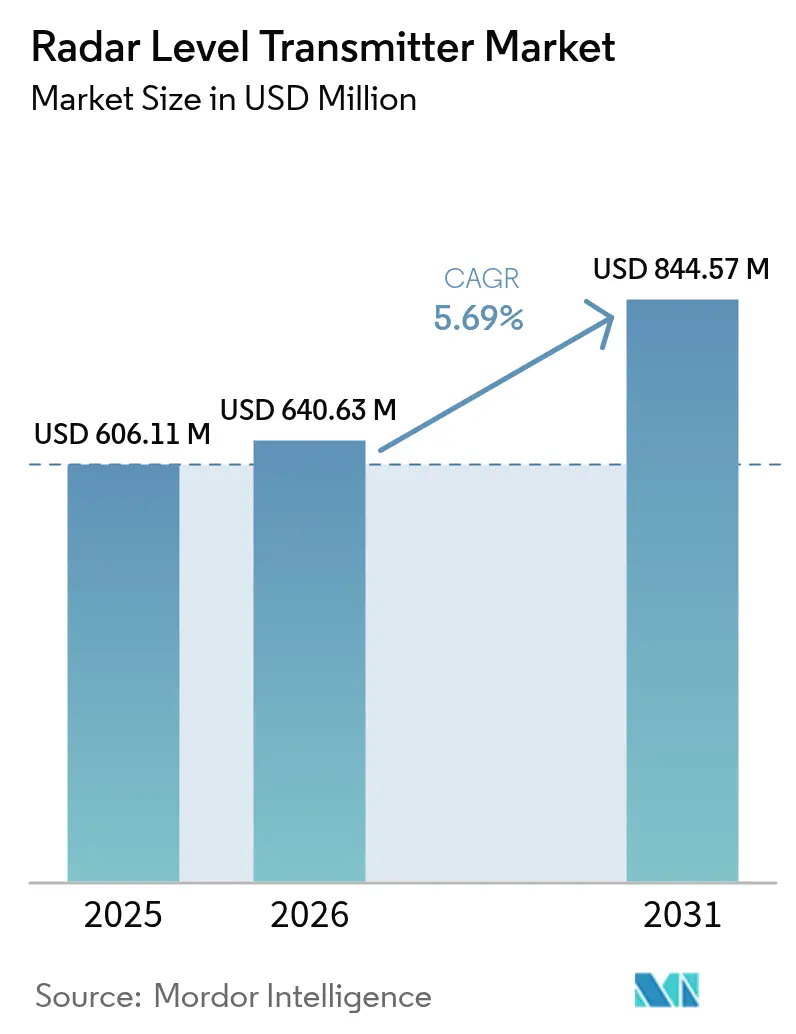
| Market Size (2026) | USD 640.63 Million |
| Market Size (2031) | USD 844.57 Million |
| Growth Rate (2026 - 2031) | 5.69 % |
| Fastest Growing Market | Asia Pacific |
| Largest Market | North America |
| Market Concentration | Medium |
Major Players *Disclaimer: Major Players sorted in no particular order Image © Mordor Intelligence. Reuse requires attribution under CC BY 4.0. | |
Radar Level Transmitter Market Analysis by Mordor Intelligence
The radar level transmitter market size was valued at USD 606.11 million in 2025 and estimated to grow from USD 640.63 million in 2026 to reach USD 844.57 million by 2031, at a CAGR of 5.69% during the forecast period (2026-2031). Demand is anchored in industrial automation programs that require precise level monitoring to meet stricter environmental and safety mandates. Technology migration from ultrasonic to 80 GHz radar in European oil terminals, growing desalination capital spending across the Gulf states, and retrofit activity in aging North-American water utilities are pivotal growth vectors. Manufacturers are also benefiting from coal-to-chemicals projects in China, where complex interface measurements favor guided-wave radar, and from a steady move toward wireless, Industrial-Internet-ready sensors that support predictive maintenance. Competitive differentiation hinges on antenna miniaturization, advanced signal processing for foam or low-dielectric media, and service ecosystems that shorten commissioning times.
Key Report Takeaways
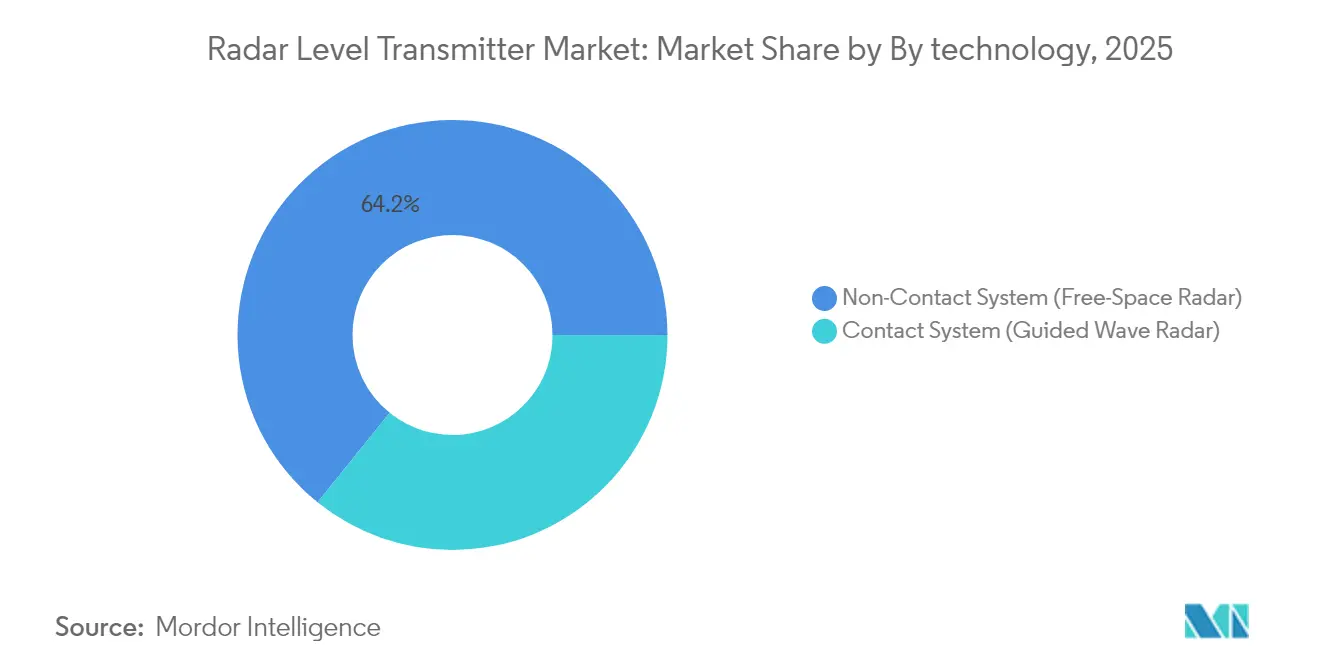
- By technology, non-contact radar systems held 64.20% of radar level transmitter market share in 2025; guided-wave radar is expected to register the fastest 6.63% CAGR to 2031.
- By frequency range, K-band retained 37.40% revenue share in 2025, while W-band frequencies are projected to grow at 7.18% CAGR through 2031.
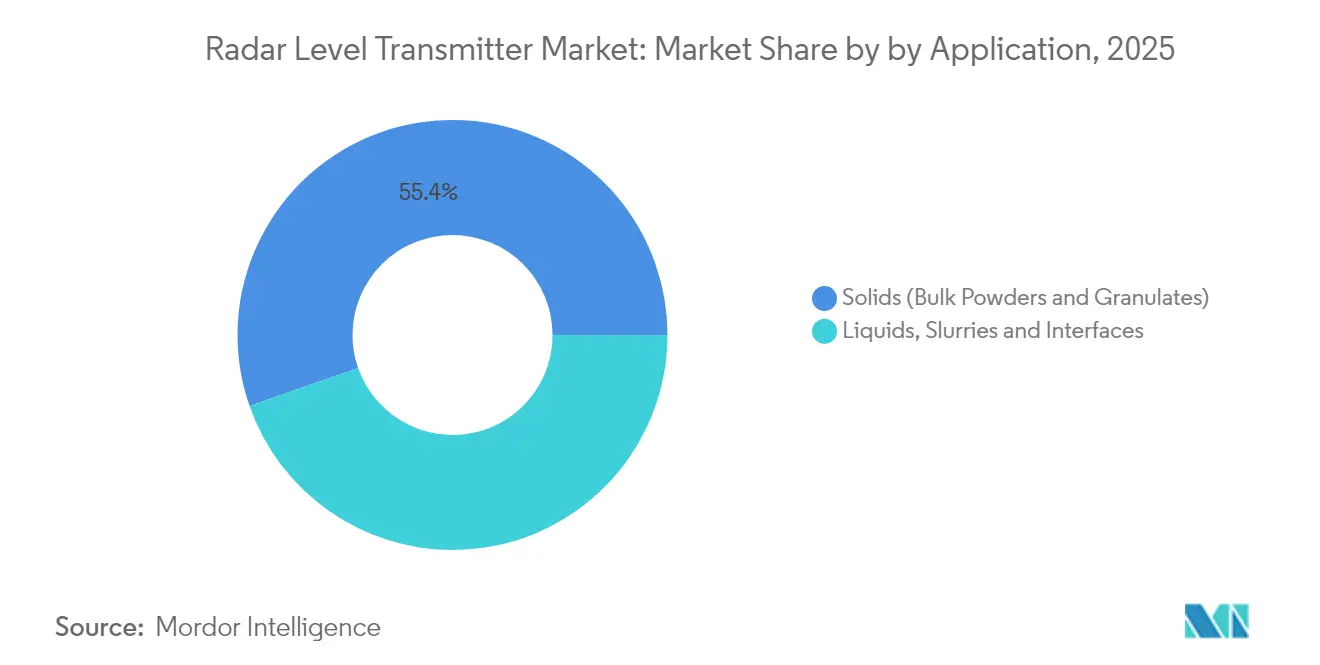
- By application, liquids, slurries, and interface measurement represented 44.65% of the radar level transmitter market size in 2025; bulk solids applications are advancing at 6.86% CAGR.
- By end-user, the oil and gas segment commanded 25.70% of radar level transmitter market size in 2025, yet water and wastewater treatment is expanding at 7.91% CAGR to 2031.
- By geography, North America led with 31.70% revenue share in 2025; Asia-Pacific is recording the highest 7.28% CAGR through 2031.
- Emerson, Siemens, Endress+Hauser, ABB, and Honeywell collectively accounted for 53.40% of 2025 global radar level transmitter market share.
Note: Market size and forecast figures in this report are generated using Mordor Intelligence’s proprietary estimation framework, updated with the latest available data and insights as of 2026.
Global Radar Level Transmitter Market Trends and Insights
Drivers Impact Analysis*
| DRIVER | (~) % IMPACT ON CAGR FORECAST | GEOGRAPHIC RELEVANCE | IMPACT TIMELINE |
|---|---|---|---|
| 80 GHz Radar Replacing Ultrasonic Sensors in EU Oil-Terminal Overfill Protection | +0.8% | Europe, North America | Medium term (2-4 years) |
| Desalination CAPEX Boom in GCC Boosting Radar Installations | +0.6% | Middle East, North Africa | Long term (≥ 4 years) |
| China Coal-to-Chemicals Interface Measurement Demand | +0.5% | Asia-Pacific, China core | Medium term (2-4 years) |
| Retrofit Wave of IIoT-Ready Instruments in Ageing US Water Plants | +0.4% | North America | Short term (≤ 2 years) |
| Hygienic Non-Contact Radar Adoption by North-American Craft Breweries | +0.2% | North America | Short term (≤ 2 years) |
| Foam-Tolerant Radar for Tailings Dams in Australian Mining | +0.3% | Asia-Pacific, Australia | Medium term (2-4 years) |
| Source: Mordor Intelligence | |||
80 GHz radar replacing ultrasonic sensors in EU oil-terminal overfill protection
European regulations mandate advanced overfill protection, prompting operators to replace ultrasonic gauges with 80 GHz radar. Narrow beam angles concentrate microwave energy, delivering reliable measurements even through vapors and temperature swings, while compact antenna designs simplify retrofits in tanks fitted with floating roofs. Coupled with maintenance-free operation, the technology ensures compliance and lowers lifecycle cost.[1]KROHNE Messtechnik, “80 GHz Radar Level Measurement Technology in Detail,” krohne.com
Desalination CAPEX boom in GCC boosting radar installations
Saudi Arabia, the UAE, and Kuwait collectively account for half of global desalination capacity. New multi-stage flash and reverse-osmosis plants demand non-contact radar that withstands corrosive, high-salinity brines. Integration with digital control systems improves energy efficiency and water recovery, embedding radar as a standard specification in regional EPC contracts.
China coal-to-chemicals interface measurement demand
Guided-wave radar solves multiphase interface challenges in China’s expanding coal-to-chemicals complexes. Reliable detection in vessels with fluctuating dielectric constants protects yields and satisfies tighter emission rules, reinforcing radar over capacitance or float technologies.
Retrofit Wave of IIoT-Ready Instruments in Ageing US Water Plants
The United States water treatment infrastructure modernization initiative is driving widespread adoption of Industrial Internet of Things-ready radar level transmitters, replacing aging mechanical and ultrasonic systems with digitally-enabled solutions. Municipal water utilities are prioritizing radar technology for its ability to provide continuous, accurate measurements while supporting remote monitoring and predictive maintenance capabilities. The technology's wireless communication capabilities enable utilities to optimize operations while reducing labor costs by up to 60%, a critical consideration given workforce constraints in the sector.
Restraints Impact Analysis*
| RESTRAINTS | (~) % IMPACT ON CAGR FORECAST | GEOGRAPHIC RELEVANCE | IMPACT TIMELINE |
|---|---|---|---|
| Signal Loss in Foam-Intense Reactors | -0.4% | Global, chemical processing core | Medium term (2-4 years) |
| Shortage of Certified Radar Technicians in ASEAN | -0.3% | Asia-Pacific, ASEAN countries | Long term (≥ 4 years) |
| High Up-Front Cost vs Ultrasonic on OEM Skids | -0.2% | Global | Short term (≤ 2 years) |
| Low-Dielectric Powders Causing Accuracy Concerns | -0.2% | Global, bulk solids applications | Medium term (2-4 years) |
| Source: Mordor Intelligence | |||
Signal loss in foam-intense reactors
Thick foam layers attenuate microwaves, causing spurious echoes that disrupt level control in ethoxylation or fermentation vessels. Enhanced signal processing and hybrid radar-capacitance probes mitigate, but physics still limits radar penetration in extreme foaming.[2]Drexelbrook, “Foam Trending,” drexelbrook.com
Shortage of certified radar technicians in ASEAN
Rapid industrialization outpaces skills development, slowing project commissioning and service response in Indonesia, Vietnam, and the Philippines. Vendor-sponsored academies and e-learning portals aim to close the talent gap, yet results will materialize gradually.
*Our forecasts treat driver/restraint impacts as directional, not additive. The impact forecasts reflect baseline growth, mix effects, and variable interactions.
Segment Analysis
By Technology: Non-contact radar consolidates leadership
Non-contact sensors captured 64.20% of 2025 revenue, reflecting preference for maintenance-free operation in corrosive or high-temperature duties. The sub-segment will expand at 6.58% CAGR, reinforced by frequency-modulated continuous-wave (FMCW) platforms that sharpen signal-to-noise ratios. Guided-wave radar retains a niche where interface detection or heavy foam is prevalent. Compact 80 GHz antennas now retrofit vessels once limited to ultrasonic probes, enlarging addressable demand for the radar level transmitter market.
Digital advances such as Bluetooth commissioning and in-sensor diagnostics simplify compliance audits, enhancing the radar level transmitter industry’s value proposition. Suppliers position self-monitoring features as a hedge against workforce shortages, elevating radar to a core node in enterprise asset-performance platforms.



By Frequency Range: W-band accelerates
K-band (24-26 GHz) still held 37.40% of 2025 shipments, appreciated for cost-effectiveness and broad approvals. Yet W-band (76-81 GHz and 120 GHz) sensors show 7.18% CAGR due to sub-3° beam angles that ignore agitator blades and narrow nozzles, delivering reliable readings in 40-m columns or slender brew kettles. Certification agencies in the United States, EU, and China cleared W-band for process use, driving scale economies that are eroding historic price premiums. As component costs fall, W-band penetration will remake competitive positioning in the radar level transmitter market.
By Application: Solids measurement turns a corner
Solids (Bulk Powders & Granulates) duties still commanded 55.35% share in 2025, and Liquids, Slurries & Interfaces handling is moving from mechanical plumb-bobs to radar at 6.88% CAGR. Innovations such as probe-end projection and real-time dust suppression algorithms unlock accurate readings in cement silos and soy-meal bins. Automatic surface profiling helps grain processors optimize blending and cut truck loading delays, underscoring radar’s role in modern supply-chain orchestration.
By End-User Industry: Water treatment outpaces oil & gas
Oil and gas retained the largest slice at 25.70% of 2025 sales; however, tightening effluent regulations propel water and wastewater plants at 7.91% CAGR. Utilities weigh total cost of ownership and find radar’s zero-maintenance design offsets the higher capex compared with ultrasonic devices. The radar level transmitter market size for municipal utilities is projected to add USD 24.47 million between 2026 and 2031, equating to 12.00% of incremental global demand.
Geography Analysis
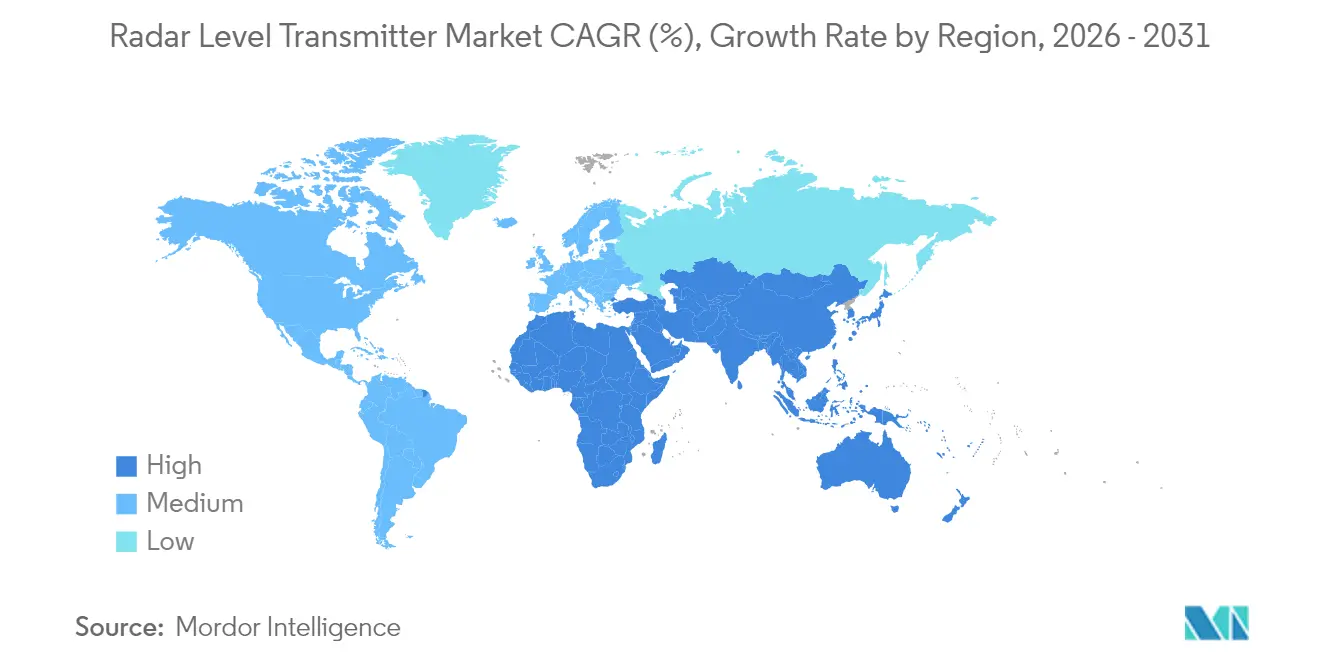
North America’s 31.70% revenue share stems from mature oil, chemical, and food industries, coupled with federal grants that incentivize digital upgrades in water infrastructure. Utilities leverage cloud-connected radar to cut field visits, while craft brewers adopt hygienic models that withstand aggressive clean-in-place cycles.
Asia-Pacific is the growth engine at 7.28% CAGR, led by Chinese coal-to-chemicals plants and Indian smart-city wastewater projects. Australian miners specify foam-tolerant 80 GHz units for tailings management, and Southeast Asian palm-oil refineries demand guided-wave models that handle sticky media.
Europe maintains steady momentum, driven by process optimization in Germany’s chemical parks and methane-emission rules that mandate tighter tank-gauging accuracy across the continent. Scandinavian utilities procure low-power radar sensors suited to cold-climate reservoirs, emphasizing sustainability and reduced servicing trips.
The Middle East’s desalination boom anchors long-term demand, whereas Latin America’s copper and lithium expansions support solids-focused radar deployments. Africa’s cement and beverage sectors adopt cost-optimized 24 GHz units as electrification spreads.

Regulatory Landscape
Radar level transmitters fall under a multi-layer compliance stack that spans functional safety, hazardous-area approvals, EMC, radio-spectrum rules, and industrial cybersecurity. For safety-instrumented applications, vendors commonly align designs and documentation to IEC 61508 (SIL-capable product development). Installations in hazardous locations typically follow regional schemes such as ATEX (Europe), IECEx (global), and cFMus listings (North America). As plants standardize on higher-frequency devices, notably 76-81 GHz and emerging higher bands, radio access requirements such as ETSI EN 305 550-6 for LPR/TLPR equipment in 116 GHz to 250 GHz ranges add another gate for product qualification, alongside EMC expectations such as EN 61326-1 for industrial environments.
Cyber and verification requirements for connected instruments are also tightening. The ISA/IEC 62443 series is widely referenced for securing industrial automation and control systems, reinforcing secure-by-design expectations for IIoT-ready level instruments that interface with control systems and asset-performance platforms. In April 2026, NIST finalized IR 8259 Rev. 1, which outlines baseline cybersecurity activities for IoT product manufacturers, and instrument suppliers increasingly use it when documenting security capabilities. In parallel, China published GB/T 39404-2026 in April 2026 (effective November 2026) for security requirements for industrial robot control units, reflecting broader national emphasis on industrial control security that influences procurement requirements across connected industrial devices and their ecosystems.
Value Chain Analysis
The radar level transmitter value chain starts with RF and microwave components (oscillators, mixers, and transceiver modules for FMCW or pulsed architectures), antenna systems (horns, lenses, or patch arrays), and industrial-grade electronics (processors, memory, power management, and intrinsically safe barriers where required). These inputs flow into instrument OEMs that develop RF and firmware and signal-processing (echo tracking, foam and dust rejection), design mechanical process connections and select materials to match the application, and run certification workstreams covering functional safety, hazardous area, EMC, and spectrum where applicable. Calibration and verification features increasingly sit at the device level, moving differentiation toward software, diagnostics, and digital tooling that accelerates commissioning and supports auditability.
Downstream, products are sold via direct OEM channels, automation distributors, and instrumentation service partners to end users and EPCs across oil and gas, chemicals, water and wastewater, mining, and food and beverage. Plant-network integration (including HART and newer Ethernet-ready approaches) brings in DCS/PLC vendors, gateway providers, and system integrators that package radar into broader automation and asset-management projects. OEM competition along this chain is visible in the push to expand 80 GHz FMCW families and remote-configuration tooling, such as KROHNE introducing OPTIWAVE 1530 and 1560 FMCW transmitters with Bluetooth and HART connectivity in November 2025, and HAWK Measurement Systems launching the Senator H80 80 GHz FMCW series in June 2026. Together, these launches reinforce how higher-frequency platforms and digital commissioning are used to shorten deployment cycles.
Competitive Landscape
The radar level transmitter market features medium concentration. Five global leaders together claimed 54% revenue in 2024, yet regional specialists and OEM-focused entrants keep pricing pressure moderate. Emerson’s 2025 “Project Beyond” embeds AI data fabrics that elevate radar from instrument to analytics cornerstone. Siemens integrates Industrial Foundation Models that crunch radar datasets for predictive throughput gains on assembly lines. Endress+Hauser’s agreement with SICK widens its portfolio to include gas analysis, creating integrated offering synergies.
VEGA’s expansion in North America shortens lead times, while KROHNE leverages early-mover advantage in W-band to win retrofit projects. Honeywell’s alliance with Danfoss addresses interoperability friction inside hybrid control rooms, ensuring radar tags populate edge-to-cloud historians seamlessly. Start-ups targeting wireless, battery-powered 80 GHz devices challenge incumbents in remote tank-farm monitoring, yet scale hurdles persist.
Radar Level Transmitter Industry Leaders
Emerson Electric Co.
Siemens AG
Endress+Hauser Group
ABB Ltd.
VEGA Grieshaber KG
- *Disclaimer: Major Players sorted in no particular order


Market Opportunities and Future Outlook
Wireless and remotely commissioned radar level measurement is creating deployment paths for remote tank farms, municipal assets, and hard-to-reach process vessels where access, safety, or power constraints previously limited instrumentation choices. One visible pull is the commercialization of fully wireless radar transmitters, including Emerson introducing the Rosemount 3408 as a native WirelessHART non-contacting radar level transmitter in October 2025, with subsequent 2026 coverage continuing to emphasize radar-enabled wireless level monitoring for inaccessible assets. This broadens non-contact radar deployment beyond classic wired instrument loops and aligns with retrofit programs targeting fewer field visits and improved asset visibility.
A second opportunity is the migration toward standardized 80 GHz FMCW product lines and higher-frequency sensing where precision and clutter rejection constrain performance for older approaches. Vendor introductions in 2026 show continued focus on compact 80 GHz FMCW designs for liquids and solids, including HAWK Measurement Systems launching the Senator H80 series in June 2026 and HIKMICRO launching the LRG10 80 GHz FMCW radar level meter series in April 2026. The same period also highlights built-in diagnostics and self-verification, including Endress+Hauser promoting Heartbeat Technology-enabled radar instrumentation. At the component and specialty-sensing level, 2026 activity around 120 GHz class transceivers and 122 GHz industrial radar sensors indicates a pathway for adjacent high-precision monitoring use cases such as vibration and predictive maintenance, which plants can bundle into wider automation upgrades as they add more Industrial-Internet-ready instrumentation nodes.
Recent Industry Developments
- April 2026: Endress+Hauser announced a new generation of 80 GHz Micropilot radar sensors that adds Heartbeat Technology capabilities, guided commissioning wizards, and Ethernet-APL support. The update supports the shift toward self-verifying instruments that reduce proof-test burden and simplify integration into modern, Ethernet-ready process networks.
- October 2025: Endress+Hauser launched the Micropilot radar family (FMR10B, FMR20B, and FMR30B) based on 80 GHz technology for both liquid and solid applications. Broadening a common platform across use cases supports standardization for end users and EPCs, helping reduce spares complexity and accelerating retrofit decisions away from ultrasonic and mechanical devices.
- July 2024: The IEC published IEC 62381:2024, defining requirements for Factory Acceptance Tests (FAT) and Site Acceptance Tests (SAT) for process automation systems. Clearer test expectations at the system level support demand for instruments with robust diagnostics and documented verification workflows, helping faster commissioning and more consistent project handover.


Research Methodology Framework and Report Scope
Market Definition and Coverage
For this study, the radar level transmitter market covers the revenue earned from radar based instruments used to measure and continuously monitor level in tanks, silos, and process vessels across industrial sites, including both contact and non-contact radar designs.
Scope exclusions: This sizing excludes installation labor, plant engineering services, and unrelated level measurement technologies such as ultrasonic or float-based sensors.
Segmentation Overview
- By Technology
- Contact System (Guided Wave Radar)
- Non-Contact System (Free-Space Radar)
- FMCW Radar
- Pulsed Radar
- By Frequency Range
- C and X Band (6-12 GHz)
- K Band (24-26 GHz)
- W Band (76-81 and 120 GHz)
- By Application
- Liquids, Slurries and Interfaces
- Solids (Bulk Powders and Granulates)
- By End-user Industry
- Oil and Gas
- Chemicals and Petrochemicals
- Water and Wastewater
- Food and Beverages
- Power Generation
- Pharmaceuticals and Biotechnology
- Metals and Mining
- Marine and Shipbuilding
- Other Industries (Pulp and Paper, Cement)
- By Geography
- North America
- United States
- Canada
- Mexico
- Europe
- United Kingdom
- Germany
- France
- Italy
- Rest of Europe
- Asia-Pacific
- China
- Japan
- India
- South Korea
- Rest of Asia-Pacific
- Middle East
- Israel
- Saudi Arabia
- United Arab Emirates
- Turkey
- Rest of Middle East
- Africa
- South Africa
- Egypt
- Rest of Africa
- South America
- Brazil
- Argentina
- Rest of South America
- North America
Data Sources, Market Sizing, and Validation
Desk Research
Desk research was used to set market boundaries and build the first demand view by industry and geography. We relied on public sources such as the US Energy Information Administration for refinery and fuel throughput indicators, the International Energy Agency for industrial energy and investment signals, and the US Geological Survey for mining and metals activity that drives solids measurement needs.
We also reviewed sources such as the US EPA and similar national environmental agencies for water and wastewater compliance themes, along with trade data and industrial production series published by customs and national statistics offices. These inputs were complemented with company filings, investor decks, product catalogs, and reputable press coverage to understand typical application fit and replacement cycles. For cross-checking company exposure and patenting intensity, paid subscriptions covering company financials and patent databases were used in a selective way. The sources listed here are illustrative only, and other public references were used for data collection, validation, and clarification during the work.
Primary Interviews and Surveys
Primary work focused on validating how radar level transmitters get selected and purchased in real projects, and where pricing and lead times were moving. We spoke with a mix of instrument suppliers, channel partners, and end users in process industries such as oil and gas, chemicals, water utilities, and power. Those inputs were then used to confirm adoption by application (liquids versus solids) and to test regional demand differences across APAC, EMEA, and the Americas.
Distribution of primary research fieldwork respondents
| Company type | Respondent position | Region |
|---|---|---|
| Top tier: 28% | CXOs: 14% | APAC: 41% |
| Mid tier: 50% | Functional/Unit leaders: 38% | EMEA: 33% |
| Smaller Players: 22% | Managers: 48% | Americas: 26% |
Market-Sizing & Forecasting
Sizing starts from a top-down build where industry spend pools and asset activity are reconstructed by end use, then converted into radar level transmitter demand using penetration and replacement logic. In practice, we map core demand centers like hydrocarbon processing, chemical production, power and steam systems, and municipal and industrial water treatment, since these sites have large installed bases of tanks, reactors, and storage units.
Key model inputs include process industry capital spending direction, the share of radar used versus other level technologies by application type, the replacement cycle for installed instruments, and the typical price range by technology choice (guided wave versus non-contact) and by frequency band used for the measurement. Regional weighting is guided by industrial output trends and project additions, and then corrected using feedback from interviews on where order books were improving or slowing.
Forecasts are produced using scenario analysis supported by short series smoothing for near-term ordering patterns. The assumptions are checked against what practitioners expect for plant upgrades and compliance-led investments. The totals are corroborated with selective bottom-up approximations, such as sampled price times shipment proxies from channel checks, and gaps are handled by applying conservative penetration ranges when application-level data is incomplete.
Data Validation & Update Cycle
Validation is done by comparing model outputs with independent signals, such as regional industrial production trends, upstream and downstream project pipelines, and changes in water infrastructure activity. When a variance is spotted, we re-check the scope mapping, pricing assumptions, and the timing of demand recognition so one-off projects do not distort the run rate.
Before sign-off, the work goes through step-by-step analyst reviews where calculations are replicated and key assumptions are challenged. We also trigger re-contact with selected interviewees if a new discrepancy appears. Reports are refreshed annually, and interim updates are made when material events impact process industry spending or supply availability. Right before delivery, a final pass is completed so clients receive the most current view available.
Mordor Intelligence's Radar Level Transmitter Market Size Compared Against Other Published Estimates
It is normal to see different market sizes for radar level transmitters because each publisher sets boundaries in its own way, and those choices directly change the revenue pool being counted. Differences also come from the year used as the base, exchange rate timing, and whether the estimate assumes fast upgrades or a slower replacement cycle.
Key gaps usually show up around what gets included in the instrument scope and how demand is linked back to real plant activity. By tracking installed-base replacement cycles and end-user capex signals, Mordor Intelligence keeps the model anchored to measurable tanks and vessels demand rather than treating all industrial automation spend as addressable, which is where the spread typically starts.
Benchmark comparison
| Source | Market Size | Gaps in Research Methodology |
|---|---|---|
| Mordor Intelligence | USD 640.63 M (2026) | |
| Industry Research Publisher A | USD 656.35 M (2025) | Uses a different base year and longer forecast frame, and its sizing notes suggest broader regional aggregation and timing that can shift currency conversion and price assumptions versus a 2026 starting point. |
| Industry Research Publisher B | USD 809.00 M (2024) | Reports a higher earlier-year value, which can happen when adjacent instrument revenue or broader application baskets are captured, and when price-mix assumptions are not tightly tied to guided wave versus non-contact adoption splits. |
Looking at the three numbers together, the main lesson is that scope and timing decisions matter as much as the math. Our approach stays traceable because the demand build is linked to end-use activity and practical adoption rates, and then corrected through interview checks so the final value is repeatable and easy to audit year over year.


Key Questions Answered in the Report
What is the current value of the radar level transmitter market?
The market is valued at USD 640.63 million in 2026 and is projected to climb to USD 844.57 million by 2031.
Which region is growing fastest for radar level transmitters?
Asia-Pacific is expanding at a 7.28% CAGR, driven by industrial build-out in China, India, and Southeast Asia.
Why are 80 GHz radar sensors displacing ultrasonic devices in oil terminals?
Narrow beam angles, immunity to vapor and temperature shifts, and compliance with new EU overfill-protection rules make 80 GHz radar more reliable.
Which end-user industry will see the highest growth?
Water and wastewater treatment leads with an 7.91% CAGR as utilities digitize assets and meet stricter discharge regulations.
How does W-band frequency improve measurement accuracy?
W-band’s high frequency produces sub-3° beam angles that avoid vessel internals and deliver sharper resolution for closely spaced liquid interfaces.
What restrains wider radar adoption in ASEAN markets?
A shortage of certified technicians complicates installation and maintenance, delaying projects despite strong demand
Page last updated on:





