
Printed Medical Devices Market Size and Share
Market Overview
| Study Period | 2020 - 2031 |
|---|---|
| Market Size (2026) | USD 5.92 Billion |
| Market Size (2031) | USD 12.15 Billion |
| Growth Rate (2026 - 2031) | 15.47 % |
| Fastest Growing Market | Asia-Pacific |
| Largest Market | North America |
| Market Concentration | Medium |
Major Players *Disclaimer: Major Players sorted in no particular order Image © Mordor Intelligence. Reuse requires attribution under CC BY 4.0. | |
Printed Medical Devices Market Analysis by Mordor Intelligence
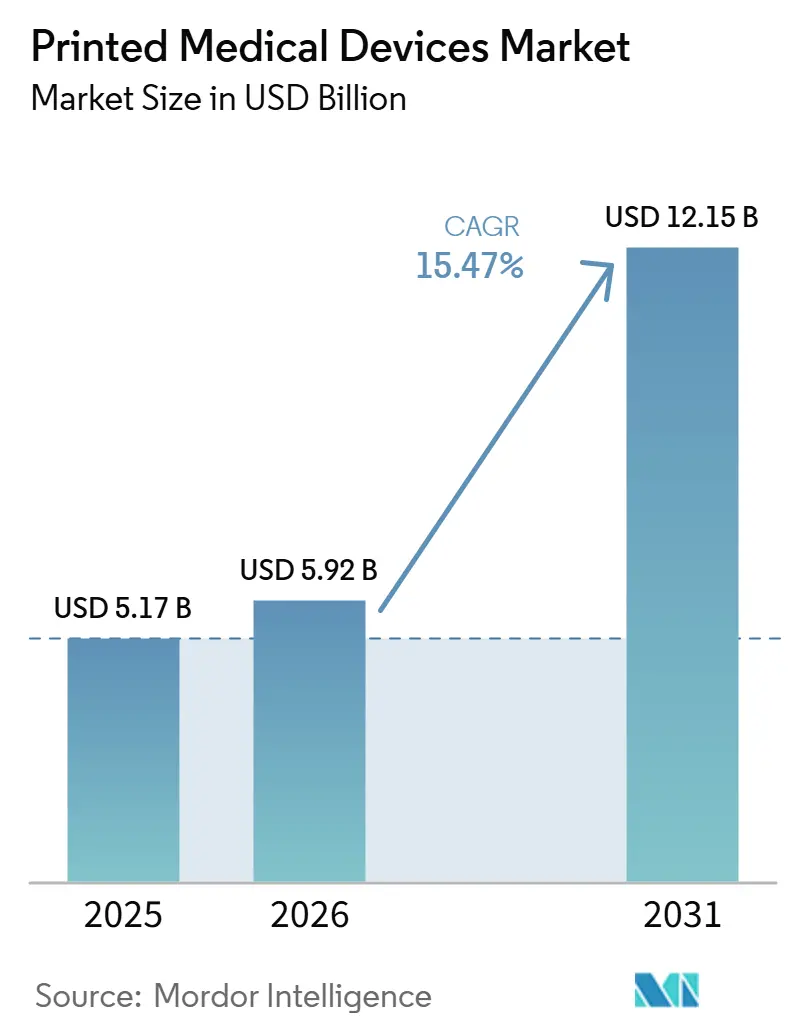
The printed medical devices market is projected to expand from USD 5.17 billion in 2025 and USD 5.92 billion in 2026 to USD 12.15 billion by 2031, registering a CAGR of 15.47% between 2026 and 2031. The printed medical devices market is moving from prototyping into direct clinical production as hospitals and manufacturers use additive methods for implants, guides, and procedure-specific tools in regular care pathways. Demand remains strongest where patient-matched design improves surgical fit, reduces adjustment during procedures, and supports better functional outcomes in orthopedic, dental, and craniofacial settings. The printed medical devices market is also gaining support from point-of-care manufacturing inside hospitals, where digital imaging, design software, and validated printing workflows are being tied more closely to surgical planning and delivery. Competition is being shaped by large medical device companies with in-house additive capabilities and by specialist platform vendors that compete through materials qualification, software integration, and certified manufacturing services. A clearer compliance framework is lowering execution risk for the printed medical devices market, especially after the FDA aligned U.S. quality system requirements more closely with ISO 13485 under the QMSR final rule.
Key Report Takeaways
- By product type, printed implants accounted for 38.74% of the printed medical devices market size in 2025, while bioprinted medical devices and tissue constructs are projected to advance at an 18.92% CAGR through 2031.
- By technology, stereolithography held 35.92% of revenue in 2025, while bioprinting technologies posted the highest projected CAGR at 16.17% through 2031.
- By application, orthopedics accounted for 39.46% of the printed medical devices market size in 2025, while tissue engineering and regenerative medicine are forecasted to grow at a 16.84% CAGR through 2031.
- By end-user, hospitals and clinics held 46.28% of the printed medical devices market share in 2025, while biotechnology and pharmaceutical companies registered the fastest projected CAGR at 17.56% through 2031.
- By geography, North America held 43.71% of global revenue in 2025, while Asia-Pacific recorded the fastest projected CAGR at 19.23% through 2031.
Note: Market size and forecast figures in this report are generated using Mordor Intelligence’s proprietary estimation framework, updated with the latest available data and insights as of January 2026.
Market Trends and Insights
Drivers Impact Analysis of Printed Medical Devices Market*
| Driver | (~) % Impact on CAGR Forecast | Geographic Relevance | Impact Timeline |
|---|---|---|---|
| Rising Demand for Patient-Matched Medical Devices | +3.8% | Global, with early concentration in North America and Germany | Medium term (2-4 years) |
| Expanding Clinical Use of Surgical Guides and Templates | +3.2% | North America and EU, APAC with China and Japan | Short term (≤ 2 years) |
| Growth in Point-of-Care Manufacturing Inside Hospitals | +2.6% | North America and Europe | Medium term (2-4 years) |
| Regulatory Clarity for Additively Manufactured Medical Devices | +2.0% | Global | Short term (≤ 2 years) |
| Broader Adoption of Biocompatible Polymers, Metals, and Bioinks | +1.7% | North America, Europe, APAC core | Medium term (2-4 years) |
| Digital Workflow Integration Across Imaging, CAD, and Printing | +1.2% | North America, Europe, APAC spillover | Long term (≥ 4 years) |
| Source: Mordor Intelligence | |||
Rising Demand for Patient-Matched Medical Devices
Patient-matched design has become one of the strongest demand anchors in the printed medical devices market because it addresses a direct clinical need rather than a manufacturing preference. Surgeons in orthopedic and craniofacial procedures increasingly depend on image-based workflows that translate scans into components built for a single anatomy, which reduces the need for intraoperative adjustment and supports more precise fit. Restor3d’s December 2025 rollout of the iTotal Identity CR 3DP Porous system showed how fully personalized and cementless knee replacement designs are moving into formal product roadmaps instead of remaining bespoke side offerings. As this evidence base builds, the printed medical devices market gains a stronger case for wider adoption because the value proposition is tied to clinical performance, revision risk, and operating room efficiency rather than to production novelty alone.
Expanding Clinical Use of Surgical Guides and Templates
Surgical guides and patient-specific templates are becoming a routine extension of digital surgical planning in the printed medical devices market. Their role has moved beyond preoperative visualization because they now help convert imaging data into actionable procedure steps that can be manufactured close to the treatment site. The March 2025 point-of-care facial implant case at University Hospital Basel demonstrated that on-site production can support same-day manufacture and implantation within an MDR-compliant workflow, which is a meaningful operational shift for time-sensitive reconstruction procedures.[1]3D Systems Corporation, “3D Systems Solution Enables World's First Facial Implant Manufacturing at Point of Care,” 3D Systems, 3dsystems.com This platform has been used across more than 80 cranial implant surgeries at partner hospitals, which shows that hospital-based additive production is functioning at repeated clinical volume rather than as a one-time demonstration. That pattern matters for the printed medical devices market because vendors with validated applications and site-ready regulatory workflows have a clearer route to adoption than suppliers that still sell hardware without clinical implementation depth.
Growth in Point-of-Care Manufacturing Inside Hospitals
Point-of-care production inside hospitals is changing how the printed medical devices market reaches end users because manufacturing is moving closer to care delivery. Instead of waiting for external suppliers, health systems are building workflows that connect imaging, design approval, fabrication, and surgical use in one internal process. The VA Puget Sound Health Care System opened a production-ready 3D bioprinting facility in June 2025 with advanced robotics for patient-matched graft delivery to the operating room, and the model was presented as a template that can be replicated across the wider VA network.[2]U.S. Department of Veterans Affairs, “VA Puget Sound Unveils Nation-Leading 3D Bioprinting Facility to Transform Veteran Care,” VA Puget Sound Health Care, va.gov This matters to the printed medical devices market because hospitals that internalize manufacturing begin to act less like traditional buyers and more like long-term production partners that need certified consumables, software continuity, and sustained regulatory support. That shift strengthens recurring demand around validated materials and process control, which can influence vendor positioning more than printer installation numbers alone.
Regulatory Clarity for Additively Manufactured Medical Devices
Regulatory clarity is reducing one of the largest execution barriers in the printed medical devices market. The most important change is the FDA’s QMSR final rule, which formally incorporated ISO 13485 into 21 CFR Part 820 and created a more predictable quality management baseline for additive manufacturers. That alignment matters because it gives manufacturers, contract producers, and hospital-based programs a clearer compliance target when they build or upgrade quality systems.[3]U.S. Food & Drug Administration, “Quality Management System Regulation (QMSR) Final Rule,” Federal Register, federalregister.govFor the printed medical devices market, this makes certification readiness and documented process control more central to competition because compliance capacity is now tied more directly to commercial scale.
Restraints Impact Analysis of Printed Medical Devices Market*
| Restraint | (~) % Impact on CAGR Forecast | Geographic Relevance | Impact Timeline |
|---|---|---|---|
| High Validation Burden for Personalized Medical Products | -1.8% | Global, with the strongest effect in North America and Europe | Medium term (2-4 years) |
| Capital Intensity of Medical Grade Printers and Post-Processing | -1.5% | APAC emerging markets, Middle East and Africa, South America | Long term (≥ 4 years) |
| Fragmented Reimbursement for Custom Printed Devices | -1.2% | North America and Europe | Medium term (2-4 years) |
| Limited Clinical Scale-Up for Complex Bioprinted Products | -0.9% | Global, especially in tissue engineering and bioprinting sub-segments | Long term (≥ 4 years) |
| Source: Mordor Intelligence | |||
High Validation Burden for Personalized Medical Products
The same customization that supports demand in the printed medical devices market also raises the burden of proof for manufacturers. Patient-specific devices do not fit the same review rhythm as standardized product families because each variation must still meet requirements for structural performance, biocompatibility, and sterilization within a controlled process. This increases time, cost, and documentation work in direct proportion to design complexity and the degree of personalization. As a result, the printed medical devices market favors companies that already operate certified manufacturing infrastructure and established quality systems, while smaller innovators face a steeper path to routine clinical commercialization. This restraint is especially relevant for bioprinting and tissue engineering programs because they need strong validation packages before demand can convert into scalable procurement.
Limited Clinical Scale-Up for Complex Bioprinted Products
Clinical scale-up remains a real constraint for the printed medical devices market in advanced regenerative applications, even as headline progress continues. Early milestones are important, but complex bioprinted products still need repeatable manufacturing, clinically meaningful evidence, and a practical path from study settings into regular treatment. Precise Bio’s ongoing Phase 1 corneal implant study and the NEOLIVER liver bioprinting program further show that commercial opportunity exists, yet these programs are still working through the long evidence-building cycle needed for broader clinical deployment. That means the printed medical devices market can grow quickly in adjacent regenerative tools and early devices, while full therapeutic scale-up will likely remain concentrated among companies with stronger clinical and manufacturing resources.
*Our forecasts treat driver/restraint impacts as directional, not additive. The impact forecasts reflect baseline growth, mix effects, and variable interactions.
Printed Medical Devices Market Segment Analysis
By Product Type:
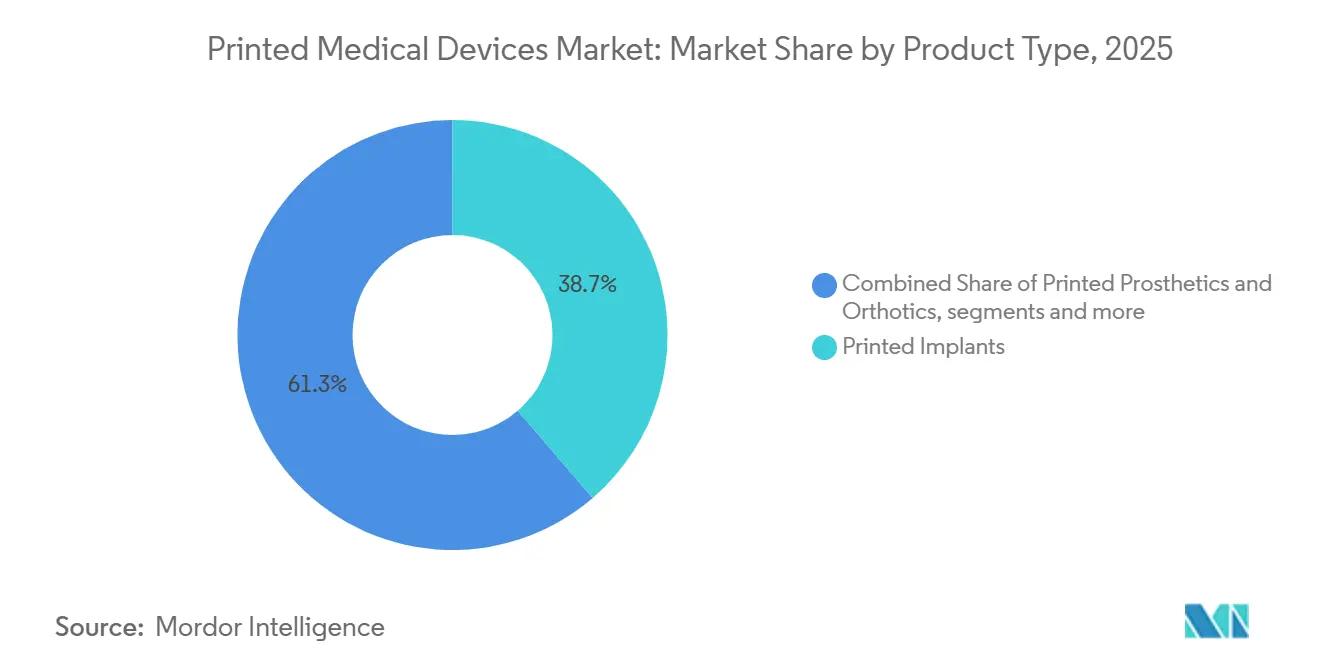
Implants Anchor Revenue While Bioprinting Redefines the Growth HorizonPrinted implants held 38.74% of revenue in 2025, which made them the main revenue base of the printed medical devices market through demand in orthopedic, spinal, and craniofacial reconstruction. This segment benefits from a direct clinical match between additive manufacturing and porous metallic structures, where design freedom supports osseointegration and procedure-specific fit. The printed medical devices industry also continues to rely on implants because this category already fits established surgical pathways, hospital purchasing behavior, and surgeon familiarity across high-volume procedures. The strength of implants gives the printed medical devices market a stable revenue core even as newer categories move through earlier adoption stages.
Bioprinted medical devices and tissue constructs are projected to grow at an 18.92% CAGR through 2031, which makes them the fastest-expanding product group in the printed medical devices market. Printed surgical instruments and guides continue to benefit each time a hospital installs or validates a point-of-care workflow, since these applications connect clearly to imaging, planning, and same-site production. Other product types such as dental restorations, hearing-related devices, CPAP masks, and prosthetics are also advancing as material portfolios broaden for patient-specific use cases.



By Technology:
SLA Holds Volume Lead as Bioprinting Signals Structural ChangeStereolithography held 35.92% of 2025 revenue, which kept it in the volume lead within the printed medical devices market. Its position reflects strong use in high-resolution parts such as dental devices, surgical planning models, and anatomical phantoms where surface finish and dimensional accuracy are critical. SLA near imaging and simulation workflows, where printed structures support research, calibration, and preparation rather than permanent implantation. Fused deposition modeling remains important for institutions entering the printed medical devices industry because it lowers the initial barrier for selected models and prosthetic components, even if its finish and material range limit broader clinical use.
Bioprinting technologies are forecasted to expand at a 16.17% CAGR through 2031, which gives them the fastest growth profile among the technology groups in the printed medical devices market. This reflects rising clinical activity in regenerative medicine and a widening expectation that advanced platforms must align with formal quality and validation frameworks before large institutions will scale purchases. Material jetting and related methods are carving out a place in anatomical modeling where multi-material and tissue-mimicking output improves training and procedural planning. The technology mix in the printed medical devices market is therefore widening, but adoption still follows clinical use case strength, materials validation, and the quality burden attached to each workflow.
By Application:
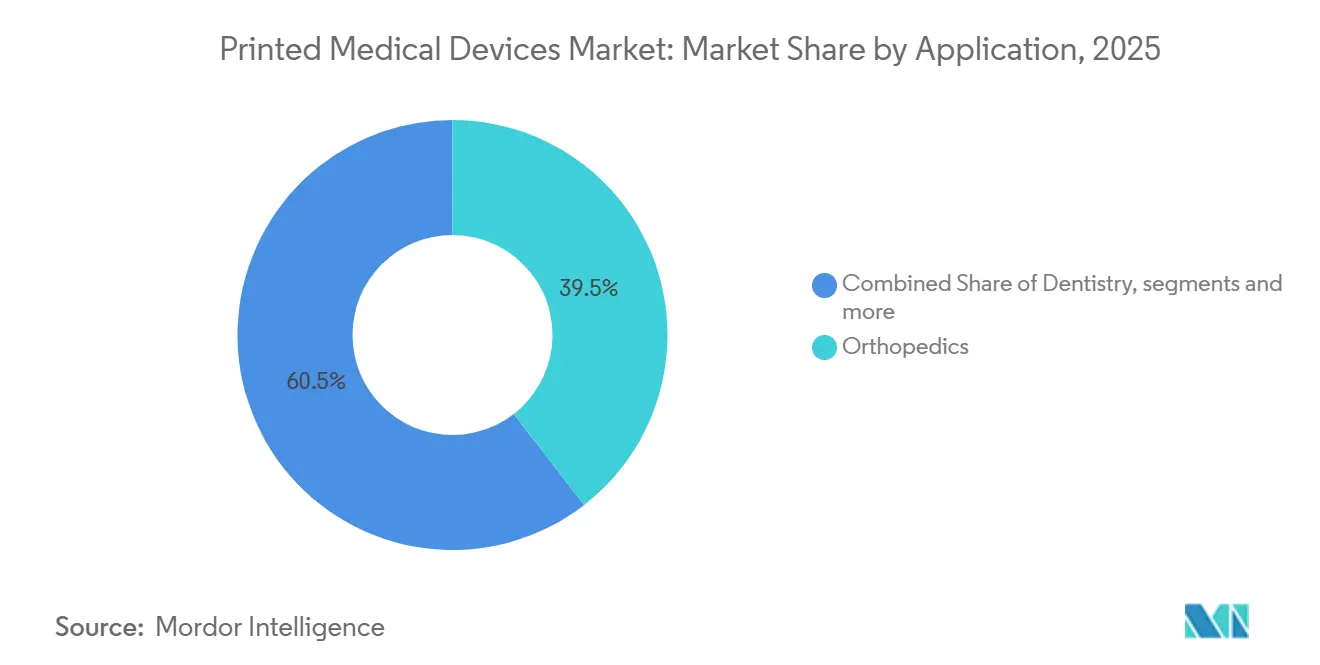
Orthopedics Leads on Volume, Regenerative Medicine Sets PaceOrthopedics accounted for 39.46% of revenue in 2025, which kept it as the largest application in the printed medical devices market. This position reflects the combination of aging patient pools, revision procedure needs, and the compatibility of additive manufacturing with porous metallic implants and patient-matched reconstruction. Dentistry remains one of the most digitally mature application areas because scanner-to-printer workflows are already embedded in many practices and laboratories. This keeps the printed medical devices market closely tied to established digital dentistry infrastructure, even when device complexity is lower than in large orthopedic procedures.
Tissue engineering and regenerative medicine are projected to grow at a 16.84% CAGR through 2031, which makes it the fastest-moving application group in the printed medical devices market. The segment draws support from multiple development paths, including peripheral nerve repair, corneal implants, liver bioprinting research, and tissue-based testing tools for pharmaceutical work. The NEOLIVER program also supports regenerative printing, which is broadening beyond one organ or tissue type toward more advanced transplant-oriented goals. In the printed medical devices market, this segment is growing not only from implantable ambitions, but also from its value in screening, modeling, and preclinical development workflows.
By End-User:
Hospitals Lead Volume While Biotech and Pharma Define Emerging DemandHospitals and clinics held 46.28% of the printed medical devices market share in 2025, which made them the largest end-user group by revenue. Their lead reflects both procedure volume and the growing shift toward in-house or hospital-adjacent additive production for guides, models, and selected patient-matched devices. The printed medical devices market is changing its account structure in this segment because hospitals are increasingly buying workflows, materials, validation support, and service continuity rather than only buying hardware. Dental clinics and laboratories remain an important parallel channel because their digital maturity supports strong throughput with lower capital intensity than implant-grade hospital manufacturing.
Biotechnology and pharmaceutical companies are projected to grow at a 17.56% CAGR through 2031, making them the fastest-expanding end-user segment in the printed medical devices market. Demand here comes from both tissue constructs used for drug screening and direct investment in therapeutic programs that rely on printed biological structures. Academic and research institutes continue to play an enabling role because they generate the early clinical and translational work that later moves into procurement channels. The printed medical devices market therefore depends on hospitals for present volume, while biotech and pharma accounts expand the future commercial base through research, testing, and therapeutic development.
Geography Analysis
North America Printed Medical Devices Market
North America accounted for 43.71% of the printed medical devices market in 2025, which made it the leading regional contributor by a clear margin. The region benefits from a dense base of FDA-registered additive manufacturing capacity, mature surgical supply chains, and hospitals that have moved further into operational use of point-of-care production. The United States remains the center of regional demand because it combines large procedure volumes with major academic health systems, VA facilities, and specialized orthopedic centers that can support validated additive workflows. Canada and Mexico remain smaller sub-markets, but position them around dental production and selected orthopedic use cases within the wider regional ecosystem.
Europe Printed Medical Devices Market
Europe remained the second-largest regional block in the printed medical devices market and stood out for its structured regulatory environment. The region’s framework for in-hospital manufacturing is creating higher documentation demands, but it is also pushing institutions toward more standardized and auditable workflows. Germany, the United Kingdom, and France continue to lead regional deployment of certified hospital-based additive capabilities. Italy and France also retain a strong position in dental device activity because existing CAD and CAM capability provides a practical bridge into broader additive adoption.
APAC, MEA and South America Printed Medical Devices Market
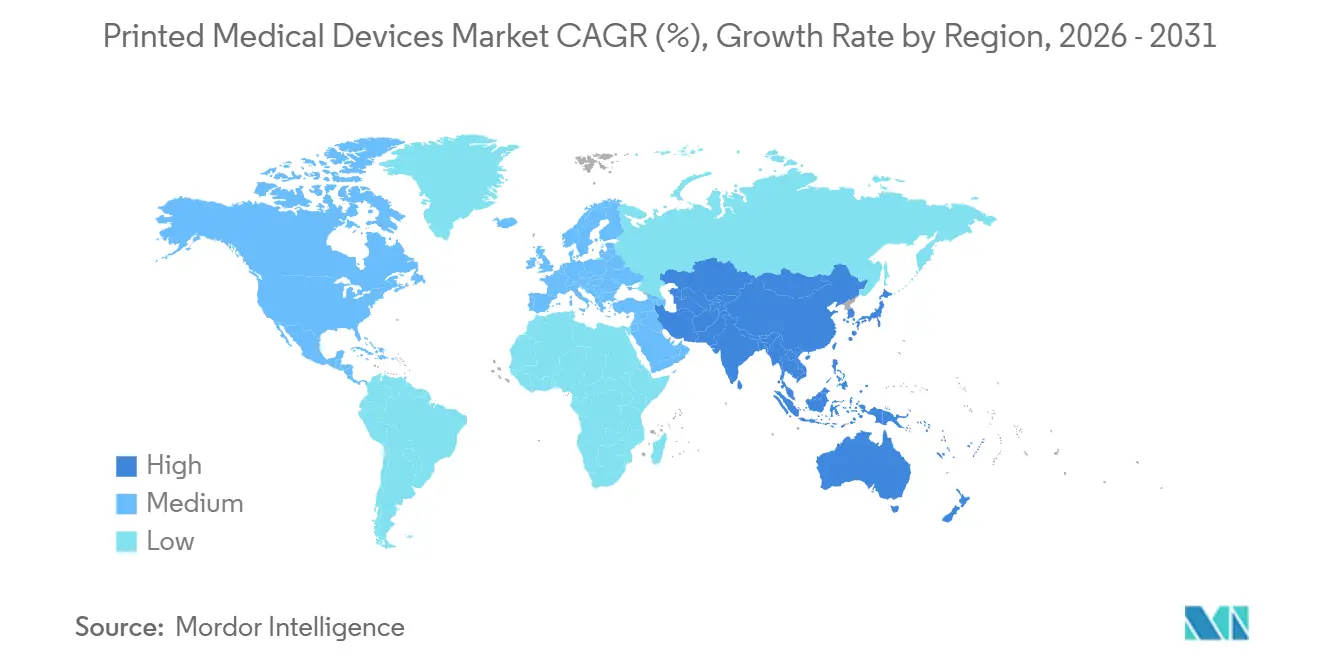
Asia-Pacific is projected to expand at a 19.23% CAGR through 2031, making it the fastest-growing geography in the printed medical devices market. The region’s growth base is broad, with China supported by large surgical volumes, Japan supported by advanced care quality and aging demographics, India supported by expanding manufacturing interest, and South Korea supported by digital dentistry depth. The printed medical devices market is still less mature in much of Asia-Pacific than in North America or Western Europe, but growth is being reinforced by domestic manufacturing ambitions and wider digital health infrastructure investment. Middle East and Africa and South America remain earlier-stage opportunities in the printed medical devices market, with GCC healthcare investment and Brazil’s dental and orthopedic demand providing the clearest starting points for future expansion.

Competitive Landscape
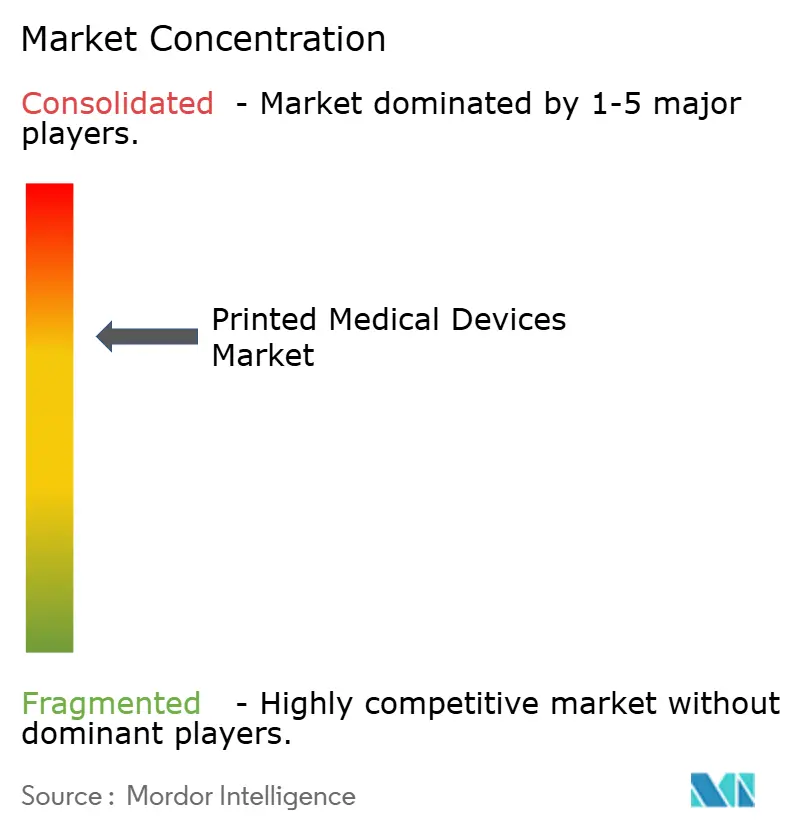
The printed medical devices market is moderately concentrated and competition is organized around 2 broad groups that increasingly overlap in capability. One group includes large medical device manufacturers such as Stryker, Zimmer Biomet, and Medtronic, which use additive manufacturing inside product development and clinical differentiation strategies. The second group includes specialist additive platform vendors such as Stratasys, 3D Systems, Materialize, EOS, and Formlabs, which compete through process breadth, software integration, materials certification, and manufacturing support. The printed medical devices market is becoming more complex because these platform companies are moving closer to certified production roles while OEMs deepen their internal additive expertise. That convergence means buyers now assess not only printer performance, but also validated materials, regulatory readiness, and the supplier’s ability to support repeatable medical manufacturing.
Strategic moves in 2025 and 2026 show how companies are strengthening position through product expansion, regulatory execution, and tighter control over supply inputs. Zimmer Biomet’s February 2026 clearance for the G7 TM Acetabular System reinforced the continuing pace of implant innovation in complex hip reconstruction. EOS added a different kind of strategic move in April 2026 when it acquired Metalpine, which strengthened control over metal powder supply and traceability. These actions show that the printed medical devices market is not competing on hardware alone, because supply assurance, certification depth, and procedure-specific product design are all becoming harder to separate.
White space remains visible in smaller dental laboratories, in regenerative production for pharmaceutical screening, and in service-led point-of-care models for hospitals that do not want to absorb full capital and validation burdens. Lower-cost systems from smaller vendors can still address fragmented clinic and prosthetic lab demand, but that part of the printed medical devices market is less protected by certification and institutional workflow depth. By contrast, advanced bioprinting entrants may create sharper niche disruption if they move clinical programs through validation and into reimbursable practice pathways at scale. The printed medical devices market is therefore likely to reward companies that combine clinical application depth with compliant materials and dependable manufacturing infrastructure, rather than companies that rely only on machine access or early demonstration value.
Printed Medical Devices Industry Leaders
Stratasys Ltd.
3D Systems Corporation
Materialise NV
EOS GmbH
Formlabs Inc.
- *Disclaimer: Major Players sorted in no particular order
Printed Medical Devices Market Companies Covered in this Report
- 3D Systems
- 3T Additive Manufacturing Ltd.
- Axial3D
- Carbon, Inc.
- EnvisionTEC
- EOS GmbH
- Formlabs Inc.
- Formlabs Inc.
- GE Additive
- HP Development Company, L.P.
- Materialise
- Medtronic
- Nano3D Biosciences Inc.
- Nanofabrica Ltd.
- Prodways Group
- Renishaw plc
- SLM Solutions Group AG
- Stratasys
- Stryker
- Zimmer Biomet

Recent Industry Developments in Printed Medical Devices Market
- April 2026: EOS GmbH completed 100% acquisition of Metalpine GmbH, an Austrian high-quality metal powder manufacturer in which it was previously a minority shareholder; the move deepens EOS' vertical integration of medical and industrial-grade AM materials supply, supporting tighter powder-to-implant traceability requirements under FDA's QMSR and EU MDR.
- April 2026: Restor3d announced full commercial release of the Aeros Modular Stem System, a 3D-printed total ankle replacement implant, following a limited market release in May 2025 during which more than 250 procedures were completed by 50+ surgeons; full commercial availability commenced in the United States on April 2, 2026.
- March 2026: Stryker unveiled Triathlon Gold at the AAOS 2026 Annual Meeting, its first commercially available 3D-printed femoral knee component, featuring a Titanium nitride surface for metal-sensitive patients, alongside expanded Mako SmartRobotics portfolio and new power tool introductions across orthopedic specialties.


Global Printed Medical Devices Market Report Scope
According to the report’s scope, the printed medical devices market includes electronically or additively manufactured medical components, such as printed implants, prosthetics, surgical guides, sensors, and bioprinted constructs, used across diagnostics, therapeutics, and regenerative applications.
The printed medical devices market is segmented into product type, technology, application, end-user, and geography. By product type, the market is segmented into printed implants, printed prosthetics and orthotics, printed surgical instruments and guides, bioprinted medical devices and tissue constructs, and other product types. By technology, the market is segmented into stereolithography (SLA), fused deposition modeling (FDM), selective laser sintering (SLS), electron beam melting (EBM), bioprinting technologies, and other technologies. By application, the market is segmented into orthopedics, dentistry, cardiovascular applications, surgical planning and training, tissue engineering and regenerative medicine, and other applications. By end-user, the market is segmented into hospitals and clinics, dental clinics and laboratories, academic and research institutes, medical device manufacturers, and biotechnology and pharmaceutical companies. By geography, the market is segmented into North America, Europe, Asia-Pacific, the Middle East and Africa, and South America. The report also covers the estimated market sizes and trends for 17 countries across major regions globally. The report offers values (USD) for all the above segments.
| Printed Implants |
| Printed Prosthetics and Orthotics |
| Printed Surgical Instruments and Guides |
| Bioprinted Medical Devices and Tissue Constructs |
| Other Product Types |
| Stereolithography (SLA) |
| Fused Deposition Modeling (FDM) |
| Selective Laser Sintering (SLS) |
| Electron Beam Melting (EBM) |
| Bioprinting Technologies |
| Other Technologies |
| Orthopedics |
| Dentistry |
| Cardiovascular Applications |
| Surgical Planning and Training |
| Tissue Engineering and Regenerative Medicine |
| Other Applications |
| Hospitals and Clinics |
| Dental Clinics and Laboratories |
| Academic and Research Institutes |
| Medical Device Manufacturers |
| Biotechnology and Pharmaceutical Companies |
| North America | United States |
| Canada | |
| Mexico | |
| Europe | Germany |
| United Kingdom | |
| France | |
| Italy | |
| Spain | |
| Rest of Europe | |
| Asia-Pacific | China |
| Japan | |
| India | |
| Australia | |
| South Korea | |
| Rest of Asia-Pacific | |
| Middle East and Africa | GCC |
| South Africa | |
| Rest of Middle East and Africa | |
| South America | Brazil |
| Argentina | |
| Rest of South America |
| By Product Type | Printed Implants | |
| Printed Prosthetics and Orthotics | ||
| Printed Surgical Instruments and Guides | ||
| Bioprinted Medical Devices and Tissue Constructs | ||
| Other Product Types | ||
| By Technology | Stereolithography (SLA) | |
| Fused Deposition Modeling (FDM) | ||
| Selective Laser Sintering (SLS) | ||
| Electron Beam Melting (EBM) | ||
| Bioprinting Technologies | ||
| Other Technologies | ||
| By Application | Orthopedics | |
| Dentistry | ||
| Cardiovascular Applications | ||
| Surgical Planning and Training | ||
| Tissue Engineering and Regenerative Medicine | ||
| Other Applications | ||
| By End-User | Hospitals and Clinics | |
| Dental Clinics and Laboratories | ||
| Academic and Research Institutes | ||
| Medical Device Manufacturers | ||
| Biotechnology and Pharmaceutical Companies | ||
| By Geography | North America | United States |
| Canada | ||
| Mexico | ||
| Europe | Germany | |
| United Kingdom | ||
| France | ||
| Italy | ||
| Spain | ||
| Rest of Europe | ||
| Asia-Pacific | China | |
| Japan | ||
| India | ||
| Australia | ||
| South Korea | ||
| Rest of Asia-Pacific | ||
| Middle East and Africa | GCC | |
| South Africa | ||
| Rest of Middle East and Africa | ||
| South America | Brazil | |
| Argentina | ||
| Rest of South America | ||


Key Questions Answered in the Report
What is the 2026 value of printed medical devices?
The printed medical devices market stands at USD 5.17 billion in 2025 to USD 5.92 billion in 2026 and is projected to reach USD 12.15 billion by 2031 at a 15.47% CAGR.
Which region leads global demand for printed medical devices?
North America led in 2025 with 43.71% of global revenue, supported by a dense manufacturing base and mature hospital adoption.
Which product category contributes the most revenue?
Printed implants led with 38.74% share in 2025 because orthopedic, spinal, and craniofacial procedures already align well with additive manufacturing benefits.
Which application is expanding the fastest?
Tissue engineering and regenerative medicine is forecasted to grow at a 16.84% CAGR through 2031 as clinical translation expands in nerve, corneal, and organ-related programs.
Page last updated on:





