Printed Circuit Board Assembly Market Size and Share
Market Overview
| Study Period | 2020 - 2031 |
|---|---|
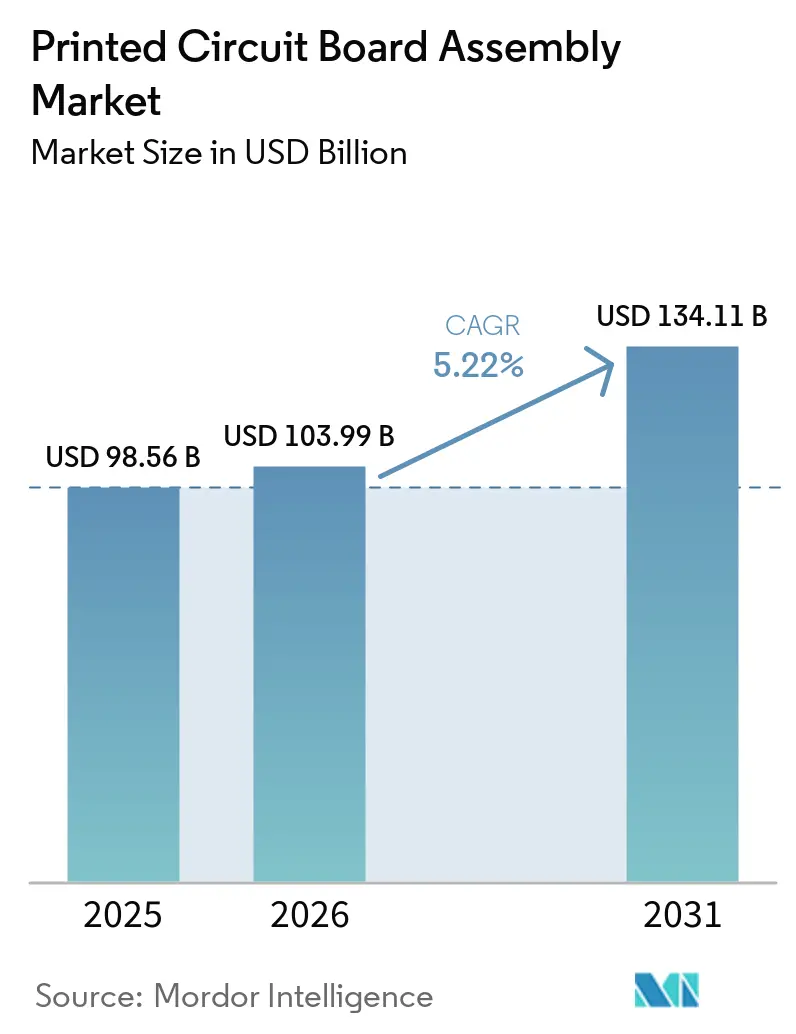
| Market Size (2026) | USD 103.99 Billion |
| Market Size (2031) | USD 134.11 Billion |
| Growth Rate (2026 - 2031) | 5.22% CAGR |
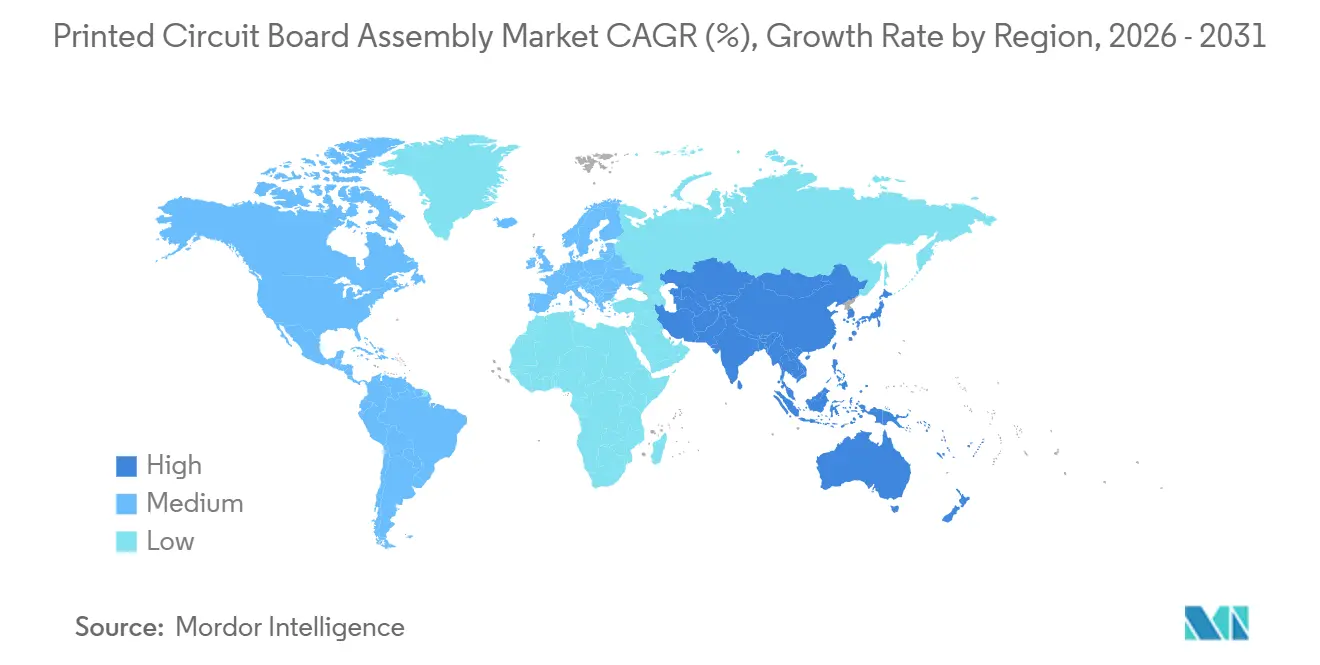
| Fastest Growing Market | Asia Pacific |
| Largest Market | Asia Pacific |
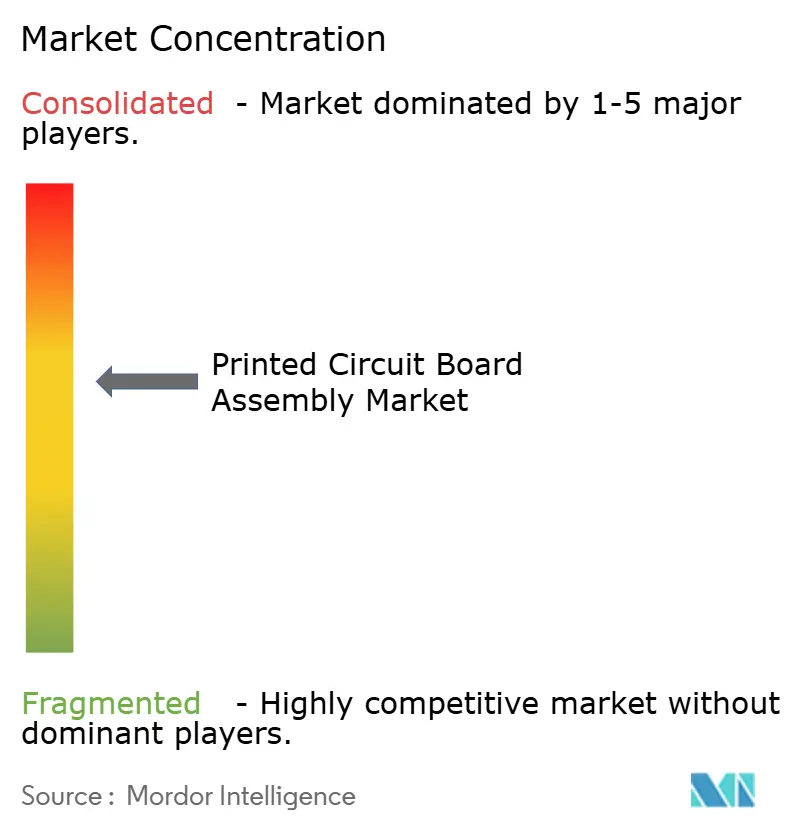
| Market Concentration | Medium |
Major Players *Disclaimer: Major Players sorted in no particular order Image © Mordor Intelligence. Reuse requires attribution under CC BY 4.0. | |
Printed Circuit Board Assembly Market Analysis by Mordor Intelligence
The Printed Circuit Board Assembly market achieved a market size of USD 103.99 billion in 2026 and is projected to reach USD 134.11 billion by 2031, advancing at a 5.22% CAGR across the forecast period. Growth reflects a pivot from high-volume consumer builds toward higher-margin assemblies for automotive electrification, hyperscale data centers, and low-Earth-orbit constellations. Demand for surface-mount technology lines that support 0201-metric placements remains strong, yet mixed-technology lines are expanding as aerospace and industrial clients seek through-hole robustness for rugged duty cycles. Contract assemblers are responding with larger nitrogen reflow ovens, sequential lamination capabilities, and in-line impedance modeling tools, actions that raise capital-expenditure intensity but lock in premium pricing. At the same time, original equipment manufacturers are shifting toward partial turnkey engagements to shift procurement risk and gain design-for-manufacturability expertise, improving assembler margins despite volatile copper prices that widened London Metal Exchange price bands to USD 2,200 per ton in 2025. Regional diversification is also material, Asia-Pacific retains clear cost leadership, but North America and Europe are channeling investment toward medical-device and defense programs where end-market certification barriers bolster returns.
Key Report Takeaways
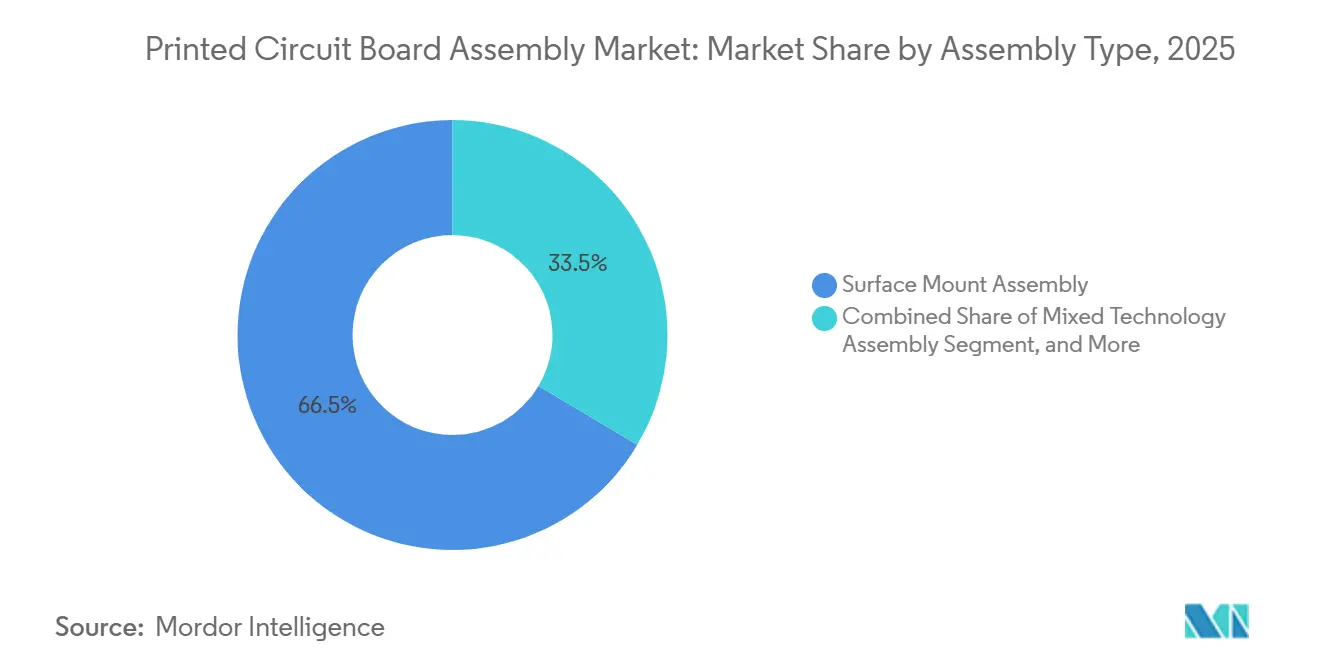
- By assembly type, surface-mount technology held 66.47% of revenue in 2025; mixed-technology lines are forecast to grow at a 5.63% CAGR to 2031.
- By customer engagement model, build-to-print captured 58.77% of the Printed Circuit Board Assembly market share in 2025, while partial turnkey is projected to advance at a 6.14% CAGR through 2031.
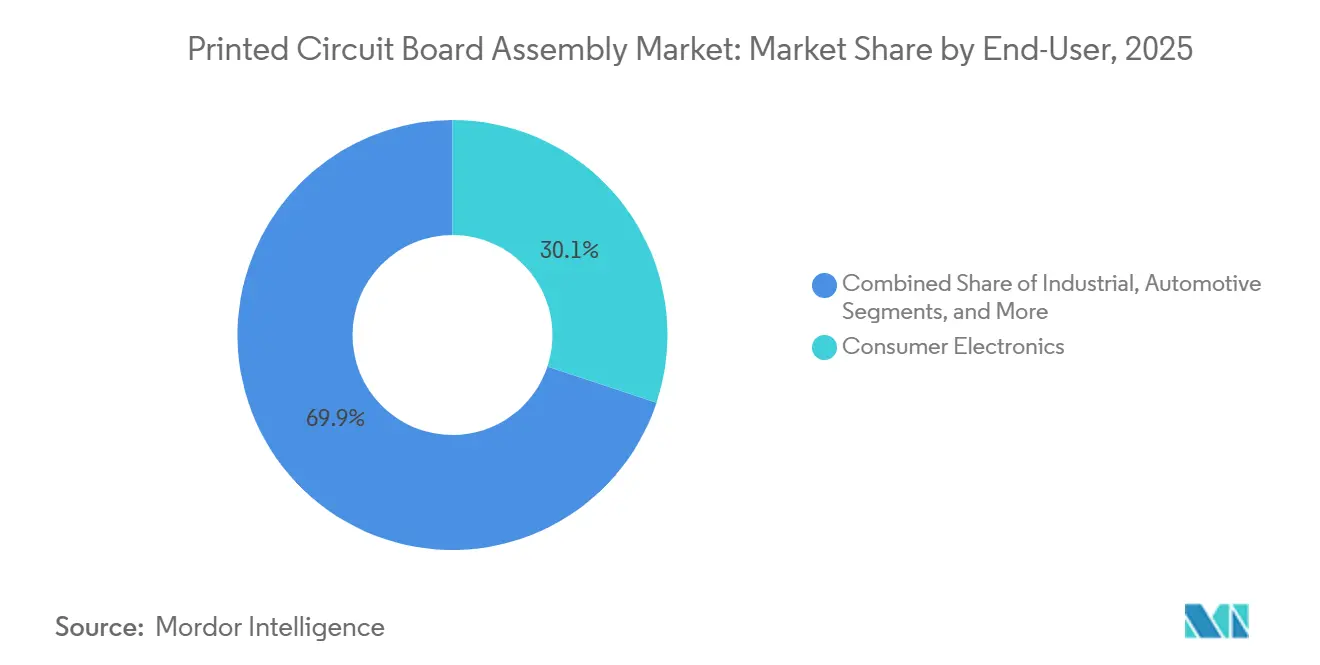
- By end user, automotive electronics accounted for 5.92% of incremental growth, the fastest rate in the period; consumer electronics retained 30.11% revenue share in 2025.
- By geography, Asia-Pacific generated 71.82% of 2025 revenue and is expanding at a 6.72% CAGR through 2031.
Note: Market size and forecast figures in this report are generated using Mordor Intelligence’s proprietary estimation framework, updated with the latest available data and insights as of January 2026.
Global Printed Circuit Board Assembly Market Trends and Insights
Drivers Impact Analysis*
| Driver | (~) % Impact on CAGR Forecast | Geographic Relevance | Impact Timeline |
|---|---|---|---|
| Surge in Consumer Electronics Refresh Cycles | +0.8% | Global, with concentration in Asia-Pacific and North America | Short term (≤ 2 years) |
| Rapid Electrification of Vehicles Boosting Automotive PCB Demand | +1.2% | Global, led by China, Europe, and North America | Medium term (2-4 years) |
| 5G Infrastructure Rollouts Accelerating HDI and RF Board Orders | +0.9% | Global, early deployment in North America, Europe, Asia-Pacific | Medium term (2-4 years) |
| Cloud and Hyperscale Data Centers Driving High-Layer Count Server Boards | +1.0% | Global, concentrated in North America and Asia-Pacific | Long term (≥ 4 years) |
| Chiplet-Based Heterogeneous Integration Spurring Package Substrate Volumes | +0.7% | Global, led by North America and Taiwan | Long term (≥ 4 years) |
| LEO Satellite Constellation Build-Outs Requiring Radiation-Hardened Boards | +0.3% | Global, with manufacturing in North America and Europe | Long term (≥ 4 years) |
| Source: Mordor Intelligence | |||
Surge in Consumer Electronics Refresh Cycles
Refresh intervals shortened from 36 months in 2020 to 24 months in 2025 as subscription-based upgrades gained traction, adding 0.8 percentage points to growth. Manufacturers are now adopting removable-battery designs to satisfy forthcoming European Union directives, a shift that adds 15-20% more surface-mount components per handset. Tablet shipments slipped 8% in 2025, yet printed circuit board layer counts rose from 8 to 12 to consolidate modems, haptics, and digitizers on slimmer stacks. Foldable displays are deepening demand for flexible assemblies certified to endure 200,000 folds, capabilities held by fewer than ten global assemblers. Together, these trends push placement densities beyond 150 parts per square inch, forcing stencil suppliers to deliver sub-20-micron pastes and amplifying demand for automated optical inspection.
Rapid Electrification of Vehicles Boosting Automotive PCB Demand
Electronics content per light vehicle climbed to USD 720 in 2025 and is expected to reach USD 1,100 by 2030 as battery-electric penetration accelerates. Centralized zone controllers that replace up to 120 discrete control units raise assembly layer counts above 16 and call for sequential lamination and laser drilling. BMW’s Neue Klasse platform, for example, aims to slash harness weight by 30% by 2027 through consolidation, while 48-volt architectures require 6-ounce copper and thermal vias that dissipate 150 W/in².[1]BMW AG, “Neue Klasse Electronics Architecture,” bmw.com Assemblers are therefore investing in nitrogen-atmosphere reflow and flying-probe impedance testing to meet AEC-Q100 Grade 1 cycles from −40 °C to +125 °C. The result is a 1.2-percentage-point lift to the Printed Circuit Board Assembly market CAGR.
5G Infrastructure Rollouts Accelerating HDI and RF Board Orders
Global base-station counts reached 1.8 million in 2025, with millimeter-wave small cells demanding insertion loss below 0.3 dB/in at 28 GHz. Open RAN disaggregation is shifting compute loads to edge boards packed with FPGAs and SoCs that dissipate more than 200 W. Verizon’s deployment of 10,000 C-band sites in 2025 underscores material inflation, Rogers high-frequency laminates cost 40% more than FR-4 but are now a design standard. Automated inspection is the new choke point because only a handful of vendors offer 50-µm defect detection at line speeds above 1 m/min. Collectively, these factors add 0.9 percentage points to CAGR, cementing RF and HDI lines as a strategic capex priority for contract manufacturers.
Cloud and Hyperscale Data Centers Driving High-Layer Count Server Boards
Hyperscale capex hit USD 220 billion in 2025, and server motherboards captured 12% of that spend. Modern single-socket designs integrate 128-core processors and 1 TB of memory on 24- to 32-layer boards, raising demand for impedance-controlled stacks with 50 Ω traces from DC to 10 GHz. The Open Compute Project’s modular specifications extend board service life from three to seven years, improving total cost of ownership but increasing initial board complexity. Original design manufacturers such as Quanta are bypassing branded server vendors, compressing gross margins yet tripling volume. Package-substrate volumes will further swell as chiplet designs proliferate, lifting CAGR by 1.0 percentage point.
Restraints Impact Analysis*
| Restraint | (~) % Impact on CAGR Forecast | Geographic Relevance | Impact Timeline |
|---|---|---|---|
| Volatile Copper Prices Squeezing Fabrication Margins | -0.6% | Global, acute impact in Asia-Pacific and Europe | Short term (≤ 2 years) |
| Stringent Environmental Regulations on PCB Manufacturing Chemicals | -0.4% | Europe and North America, spillover to Asia-Pacific | Medium term (2-4 years) |
| Capacity Bottlenecks in ABF Resin Supply for High-End Substrates | -0.3% | Global, concentrated in Taiwan and Japan | Medium term (2-4 years) |
| Skilled Labor Shortages in SMT Assembly in Southeast Asia | -0.2% | Southeast Asia, spillover to South Asia | Long term (≥ 4 years) |
| Source: Mordor Intelligence | |||
Volatile Copper Prices Squeezing Fabrication Margins
Copper traded between USD 8,200 and USD 10,400 per ton in 2025, a 21% band that cut fabricator margins by as much as 3 points.[2]London Metal Exchange, “LME Primary Copper Prices 2025,” lme.com Assemblers now carry 60 days of foil inventory to hedge, up from 30 days in 2020. Meanwhile, thinner 12-µm foils used in HDI builds lower raw-material cost 15% but push defect rates to 350 ppm because foils tear during lamination. Vertically integrated players such as TTM Technologies held 14% gross margins in 2025 versus 9% for spot buyers. Until copper supply elasticity improves, the Printed Circuit Board Assembly market faces a 0.6-point drag on CAGR.
Stringent Environmental Regulations on PCB Manufacturing Chemicals
The European Union added 12 per- and polyfluoroalkyl substances to its REACH restricted list in 2024, compelling solder-mask reformulations that raise material cost 8-12%. Halogen-free laminates preferred by automotive and medical clients have glass-transition temperatures 15 °C lower than those of brominated counterparts, increasing delamination risk under lead-free solder at 245 °C. China tightened VOC emission limits to 50 mg/m³ in 2025, necessitating catalytic oxidizers that cost USD 2 million and raise electric bills 12%. Approval cycles in Vietnam and Thailand stretch to 18 months and have already delayed eight capacity projects valued at USD 450 million. The cumulative impact trims Printed Circuit Board Assembly market growth by 0.4 percentage points.
*Our forecasts treat driver/restraint impacts as directional, not additive. The impact forecasts reflect baseline growth, mix effects, and variable interactions.
Segment Analysis
By Assembly Type: Mixed Technology Gains as Ruggedization Demands Rise
Mixed-technology lines are projected to expand at a 5.63% CAGR through 2031, eclipsing the overall Printed Circuit Board Assembly market average. Surface-mount processes still accounted for 66.47% of 2025 revenue, thanks to smartphone and tablet builds that top 150 placements per square inch. Through-hole remains entrenched in power-conversion and defense modules where vibration can exceed 20 g and temperature cycling spans −55 °C to +125 °C.[3]IPC, “IPC-A-610 Rev H,” ipc.org Flexible PCB Assembly market size for electric-vehicle charging equipment is also rising, as 400 A busbars require mechanical fastening over solder. Automated inspection with 3-D solder profiling is becoming standard, yet only 30% of assemblers in Southeast Asia own such systems, limiting yield gains.
Press-fit connectors are reducing soldered through-hole volumes by 12% annually, but plating thickness must exceed 40 µm to avert barrel cracking during 80 N insertions. Simultaneously, surface-mount components smaller than 0201 metric now form 22% of smartphone placements, pushing stencil aspect ratios below 1.2 and doubling escape rates. As a result, mixed-technology adoption balances reliability with densification, reinforcing its above-average growth profile in the Printed Circuit Board Assembly market.


By Customer Engagement Model: Partial Turnkey Captures Design Offload
Build-to-print secured 58.77% of 2025 revenue, yet partial turnkey engagements are forecast to grow 6.14% annually through 2031 as original equipment manufacturers seek design-for-manufacturability support. Partial turnkey allows assemblers to negotiate directly with distributors, capturing an incremental 8-12% material margin while assuming obsolescence risk when forecast variance tops 15%. Automotive tier-one suppliers now specify in-circuit test fixture development in their partial turnkey statements of work, lifting gross margins to 18-22% for qualified providers. Conversely, design-assisted engagements remain niche, serving medical-device prototypes where traceability premiums justify 25-40% higher engineering fees.
Turnkey suppliers must maintain approved vendor lists covering up to 500 manufacturers, a burden that is beyond the reach of smaller shops without enterprise resource planning systems costing USD 1 million. Consignment models blur distinctions further, reducing working capital use by up to 30%. Collectively, partial turnkey dynamics position the engagement model as the fastest-growing segment of the Printed Circuit Board Assembly market.
By End-User: Automotive Electronics Outpaces Consumer Segments
Automotive electronics are projected to advance at a 5.92% CAGR through 2031, ahead of consumer electronics despite the latter’s 30.11% 2025 revenue share. Centralized domain controllers, over-the-air update modules, and sensor-fusion boards are driving the Printed Circuit Board Assembly market in vehicles as component counts per car climb past 60. Smartphone shipments fell 4% in 2025, yet board value per handset rose 9% owing to under-display biometrics, periscope cameras, and mmWave transceivers. Folding-screen phones require flexible boards that raise defect rates from 180 ppm to 320 ppm, intensifying demand for precision reflow profiling.
Industrial automation orders for conformal-coated boards rated to 85% humidity are also growing, while communications gear migrates to 800-GbE, demanding 50 Ω differential routing within ±5% tolerance across 20 GHz. Medical devices adhere to ISO 13485 and 21 CFR 820, pushing documentation costs by 30-50% but commanding gross margins above 18%. Collectively, these dynamics shift revenue toward automotive and other high-reliability verticals, broadening the market footprints.
Geography Analysis
Asia-Pacific generated 71.82% of global revenue in 2025 and is accelerating at 6.72% through 2031, the fastest regional CAGR in the Printed Circuit Board Assembly market. China assembled 1.4 billion smartphones in 2025, yet entry-level production is migrating to Vietnam and India as Guangdong labor costs climb 6% per year. Taiwan supplied 42% of server motherboards, leveraging its proximity to advanced packaging fabs to achieve 48-hour shipment windows to hyperscalers. India booked USD 118 billion in electronics output in 2025 and is attracting fresh investment through 25% capital subsidies, though it still imports 65% of surface-mount components.
Japan’s 2025 revenue fell 3% as automotive OEM assembly shifted abroad, yet the nation retained leadership in robotics and imaging assemblies that require defect rates below 10 ppm. South Korea is scaling flexible printed circuits for foldable phones and automotive displays, a segment where Samsung and LG Display controlled 58% of global revenue. Southeast Asia attracted USD 12 billion in electronics capex in 2025, driven by reshoring strategies to reduce geopolitical risk.
North America grew 4.2% in 2025 and now captures 62% of medical and aerospace board spend owing to Buy America provisions. Europe’s automotive slump curbed revenue, yet its focus on industrial and automotive-grade boards sustained 16% gross margins, four points higher than Asia-Pacific averages. Rest of World, mainly Mexico, rose as a near-shoring hub for North American customers, lifting the region’s Printed Circuit Board Assembly market share to 6% in 2025.

Competitive Landscape
The Printed Circuit Board Assembly market shows moderate concentration; the top 10 providers accounted for a considerable share of 2025 revenue, but fragmentation persists across niche verticals. Hon Hai Precision Industry, Pegatron, and Wistron together account for over 40% of smartphone and tablet volumes, driving per-board labor costs down to USD 1.80 from USD 3.20 for mid-tier peers.
Jabil, Flex, and Sanmina target automotive and industrial segments and have cut defect escape rates to 50 ppm by installing AI-based classification systems. Benchmark Electronics and Plexus exploit regulatory moats in the implantables and aerospace markets, where ISO 13485 and AS9100 certifications can take up to 24 months to obtain.
Technology adoption remains the decisive differentiator. By 2025, 38 equipment vendors had adopted the IPC-HERMES-9852 machine-to-machine protocols, reducing changeovers from 45 minutes to 12 minutes for high-mix lots. Edge-computing boards for autonomous vehicles offer new white-space, domain controllers that dissipate 200 W on a single substrate require advanced vapor-chamber cooling and yield gross margins exceeding 20%. Regional newcomers in Vietnam and India enjoy 8-12% cost advantages via government incentives but face 18-month automotive qualification cycles that limit rapid share gains.
Printed Circuit Board Assembly Industry Leaders
Hon Hai Precision Industry Co. Ltd.
Pegatron Corporation
Jabil Inc.
Flex Ltd.
Sanmina Corporation
- *Disclaimer: Major Players sorted in no particular order

Recent Industry Developments
- December 2025: Foxconn committed USD 1.2 billion to add four SMT lines in Tamil Nadu, India, targeting 12 million smartphone boards annually by Q4 2026, and creating 8,000 jobs under the Indian production-linked incentive scheme.
- November 2025: Jabil acquired a European automotive electronics assembler for USD 340 million, adding ISO 26262 capabilities and increasing 48-volt power-electronics capacity 35%.
- October 2025: Flex opened a USD 280 million factory in Guadalajara, Mexico, with six high-speed SMT lines capable of 25-µm defect detection at 1.2 m/min, targeting automotive and industrial near-shoring demand.
- September 2025: Sanmina landed a five-year, USD 420 million motherboard contract with a North American hyperscaler, covering 28-layer boards at 180 parts/in² density.
- August 2025: Pegatron earmarked USD 150 million to expand Vietnamese capacity for eight million laptop motherboards by mid-2026 as customers diversify away from China.


Global Printed Circuit Board Assembly Market Report Scope
The Printed Circuit Board Assembly Market is the process of assembling printed circuit boards (PCBs) by mounting electronic components to create functional electronic circuits. This market encompasses various assembly types, customer engagement models, and end-user applications across different regions.
The Printed Circuit Board Assembly Market Report is Segmented by Assembly Type (Surface Mount, Through-Hole, and Mixed Technology), Customer Engagement Model (Build-to-Print, Partial Turnkey, and Design-Assisted), End-User (Mobile Devices, Consumer Electronics, Computer, Industrial, Automotive, Communication, Lighting, Medical, and Other End-Users), and Geography (North America, Europe, Asia-Pacific, and Rest of World). The Market Forecasts are Provided in Value (USD).
| Surface Mount Assembly |
| Through-Hole Assembly |
| Mixed Technology Assembly |
| Build-to-Print PCBA |
| Partial Turnkey PCBA |
| Design-Assisted PCBA |
| Mobile Devices (Smartphones and Tablets) |
| Consumer Electronics |
| Computer (PCs/Desktop/Laptops) |
| Industrial |
| Automotive |
| Communication |
| Lighting |
| Medical |
| Other End-Users |
| North America | United States |
| Rest of North America | |
| Europe | Germany |
| United Kingdom | |
| Netherlands | |
| Rest of Europe | |
| Asia-Pacific | China |
| Taiwan | |
| Japan | |
| India | |
| South Korea | |
| Southeast Asia | |
| Rest of Asia-Pacific | |
| Rest of World |
| By Assembly Type | Surface Mount Assembly | |
| Through-Hole Assembly | ||
| Mixed Technology Assembly | ||
| By Customer Engagement Model | Build-to-Print PCBA | |
| Partial Turnkey PCBA | ||
| Design-Assisted PCBA | ||
| By End-User | Mobile Devices (Smartphones and Tablets) | |
| Consumer Electronics | ||
| Computer (PCs/Desktop/Laptops) | ||
| Industrial | ||
| Automotive | ||
| Communication | ||
| Lighting | ||
| Medical | ||
| Other End-Users | ||
| By Region | North America | United States |
| Rest of North America | ||
| Europe | Germany | |
| United Kingdom | ||
| Netherlands | ||
| Rest of Europe | ||
| Asia-Pacific | China | |
| Taiwan | ||
| Japan | ||
| India | ||
| South Korea | ||
| Southeast Asia | ||
| Rest of Asia-Pacific | ||
| Rest of World | ||


Key Questions Answered in the Report
What revenue level is the global Printed Circuit Board Assembly space forecast to reach in 2031?
The value is projected to climb to USD 134.11 billion by 2031, reflecting a 5.22% CAGR from 2026.
How quickly will mixed-technology lines expand during the 2026–2031 period?
Mixed-technology assembly is set to post a 5.63% CAGR, outpacing the overall sector as ruggedized applications proliferate.
Which geography is expected to record the strongest growth rate through 2031?
Asia-Pacific leads with a 6.72% CAGR, driven by electric-vehicle supply-chain integration in China, packaging advances in Taiwan, and incentive programs in India.
Why are original equipment makers shifting toward partial turnkey engagements?
Partial turnkey models transfer design-for-manufacturability tasks and component sourcing to assemblers, boosting material-margin capture by 8–12% while trimming OEM risk.
What core trend is fueling demand for high-layer-count boards in servers?
Hyperscale operators are adopting single-socket architectures with 128-core processors, lifting board stackups to 24–32 layers to accommodate dense power and memory routing.
In what way do copper price swings influence fabrication economics?
Volatility between USD 8,200 and USD 10,400 per ton forces fabricators to double copper-foil inventory days and slices gross margins by up to 3 percentage points.
Page last updated on:


