
Premium OTT Video Market Size and Share
Market Overview
| Study Period | 2020 - 2031 |
|---|---|
| Market Size (2026) | USD 224.54 Billion |
| Market Size (2031) | USD 332.74 Billion |
| Growth Rate (2026 - 2031) | 8.18 % |
| Fastest Growing Market | Asia-Pacific |
| Largest Market | North America |
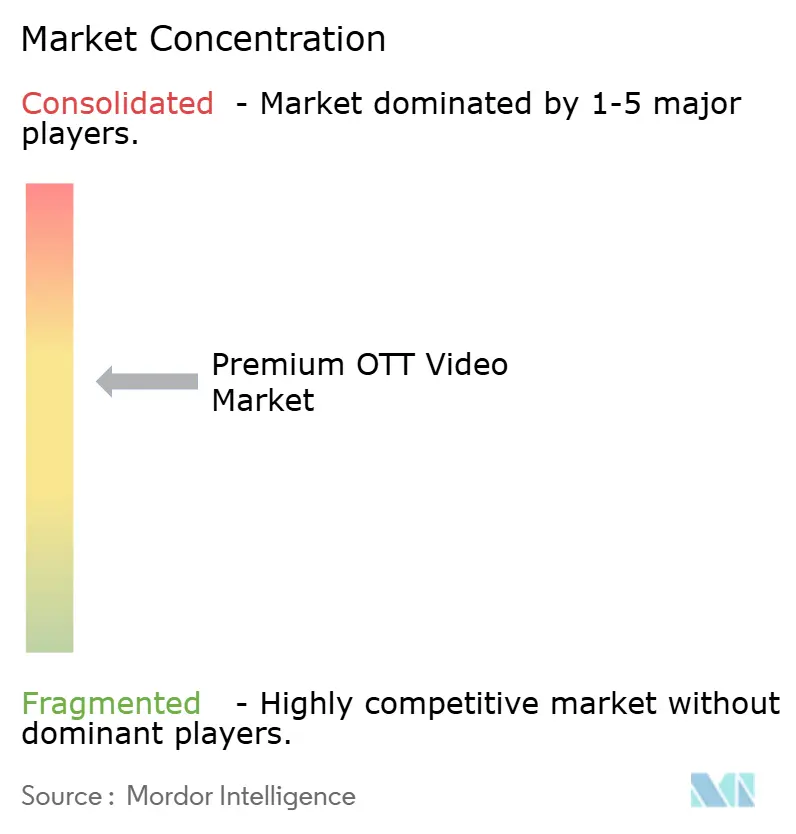
| Market Concentration | Medium |
Major Players *Disclaimer: Major Players sorted in no particular order Image © Mordor Intelligence. Reuse requires attribution under CC BY 4.0. | |
Premium OTT Video Market Analysis by Mordor Intelligence
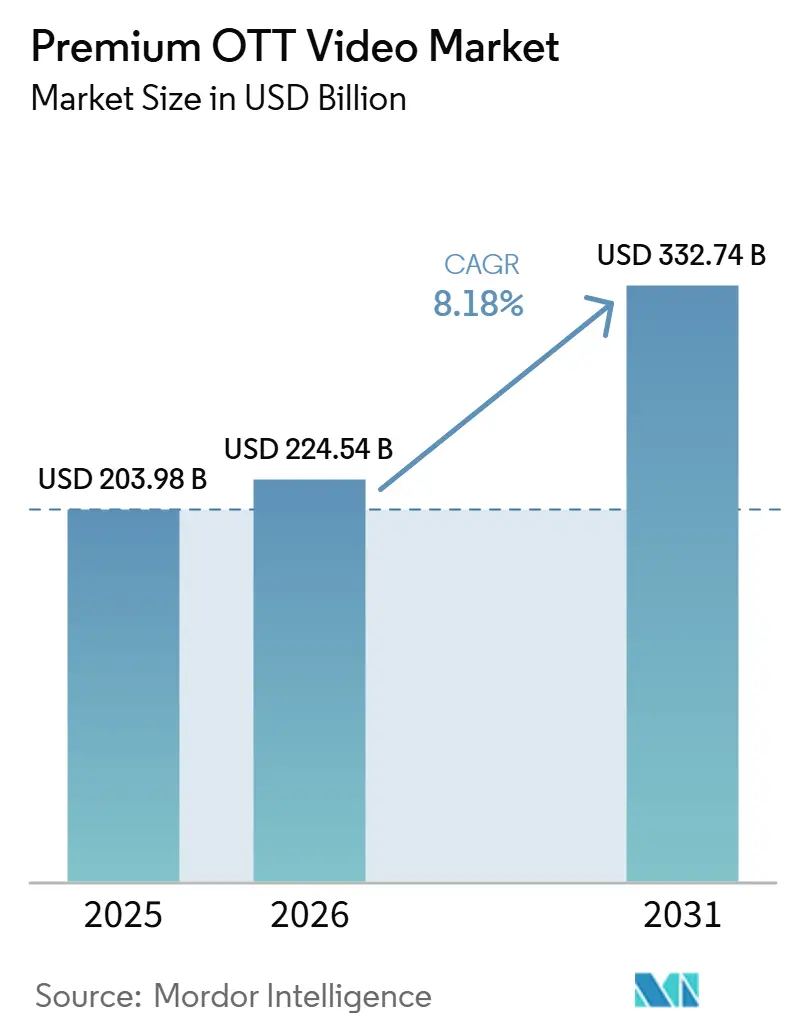
The premium OTT video market size is projected to expand from USD 203.98 billion in 2025 and USD 224.54 billion in 2026 to USD 332.74 billion by 2031, registering a CAGR of 8.18% between 2026 and 2031. Growth in the premium OTT video market is being supported by a larger paid user base, stronger advertiser interest in streaming inventory, and a continued shift away from linear television. The premium OTT video market is also changing in quality, as leading platforms are placing greater emphasis on revenue stability, retention, and pricing mix than on raw subscriber additions alone. Live sports rights have become one of the strongest retention tools in the premium OTT video market, while premium ad-supported tiers have moved into the core business model rather than remaining a secondary offer. At the same time, content costs, subscription fatigue, and piracy are putting pressure on platform economics and forcing companies to sharpen their bundling, localization, and product strategies. Consolidation, broader language support, and better use of viewing data are opening new room for the premium OTT video market, but they are also raising the execution standard for global and regional participants.
Key Report Takeaways
- By revenue model, SVOD held 48.12% share in 2025, while AVOD is projected to expand at 9.23% CAGR through 2031.
- By content genre, TV shows and episodic content accounted for 43.64% of the market share in 2025, while movies and films are projected to grow at a 9.34% CAGR through 2031.
- By device type, smartphones and tablets commanded a 38.61% share in 2025, while smart TVs are expected to grow at an 8.78% CAGR through 2031.
- By end user, individual consumers held 88.39% share in 2025, while commercial users are projected to expand at 9.27% CAGR through 2031.
- By geography, North America accounted for 37.28% of the premium over-the-top (OTT) video market in 2025, while Asia-Pacific is projected to grow at a 9.53% CAGR through 2031.
Note: Market size and forecast figures in this report are generated using Mordor Intelligence’s proprietary estimation framework, updated with the latest available data and insights as of January 2026.
Market Trends and Insights
Drivers Impact Analysis of Premium OTT Video Market*
| Driver | (~) % Impact on CAGR Forecast | Geographic Relevance | Impact Timeline |
|---|---|---|---|
| Rising Demand for Premium, Ad-Free, and Early-Window Content | +2.1% | Global, with highest intensity in North America and Europe | Short term (≤ 2 years) |
| Expansion of Live Sports Rights Across Streaming Platforms | +1.8% | Global core, highest in North America and Asia-Pacific, including India, Japan, and Australia | Medium term (2-4 years) |
| Growth of Hybrid Monetization Models and Premium Ad Tiers | +1.5% | Global, with largest near-term revenue impact in North America | Short term (≤ 2 years) |
| Telco and Pay-TV Bundling to Reduce Churn | +1.0% | North America, Europe, and Asia-Pacific core, with spillover to Middle East | Medium term (2-4 years) |
| AI-Powered Personalization and Retention Optimization | +0.7% | Global, with early-mover advantages in North America and China | Medium term (2-4 years) |
| Localization of Originals and Language-Specific Catalogs | +0.5% | Asia-Pacific, South America, Middle East and Africa | Long term (≥ 4 years) |
| Source: Mordor Intelligence | |||
Rising Demand for Premium, Ad-Free, and Early-Window Content
Demand for premium, ad-free, and early-window programming continues to support the premium OTT video market, as users still place high value on uninterrupted access and a stronger title selection. This shift has also changed platform priorities, and the premium OTT video market is now leaning more on content quality, release timing, and franchise strength than on sheer title volume. The premium OTT video market benefits when users see clear value in paying for earlier access, because that improves renewal intent and reduces casual switching between services. Company-led investment in broader accessibility also strengthens this driver, since deeper language support makes premium catalogs more usable across regions and audience groups.[1]The Walt Disney Company, “Disney+ Expands Language Support to 58 Audio Languages and Adds Right-to-Left Interface,” The Walt Disney Company, thewaltdisneycompany.com The premium OTT video market is therefore gaining from a more deliberate premium proposition that combines better content, better access, and better user fit.
Expansion of Live Sports Rights Across Streaming Platforms
Live sports rights are becoming a central growth force in the premium OTT video market because they deliver recurring engagement and keep users active throughout the year. Unlike general entertainment, sports viewing happens in real time, which gives the premium over-the-top (OTT) video market stronger retention around a smaller set of must-watch events. The premium OTT video market also benefits from sports because the same rights package can support subscription revenue, premium ad sales, and broader platform visibility. In Asia-Pacific, cricket remains especially important, and the premium OTT video market in India continues to show how marquee rights can influence yearly platform economics and competitive balance. This makes sports less of a side category and more of a durable operating asset inside the premium OTT video market.
Growth of Hybrid Monetization Models and Premium Ad Tiers
Hybrid monetization has become one of the clearest structural shifts in the premium OTT video market, enabling platforms to serve both premium and cost-sensitive households. The premium OTT video market is no longer built around a single subscription tier, and services are now using several price points to widen reach and protect retention. This change matters because a lower-priced plan can still create attractive value when paired with advertising, better targeting, and longer user duration. The premium OTT video market also gains flexibility from this model in regions where household budgets fluctuate unevenly and full-price subscriptions face greater resistance. As a result, the premium OTT video market is moving toward a more balanced revenue design that combines access, scale, and monetization efficiency.
Telco and Pay-TV Bundling to Reduce Churn
Bundling with telecom and pay-TV partners is helping the premium OTT video market by reducing sign-up friction and simplifying billing for households. This approach matters in the premium OTT video market not only in mature regions, but also in emerging ones where telecom operators still shape access and distribution. The premium OTT video market also benefits when services remain visible within broader entertainment packages rather than competing solely as stand-alone apps. For platforms facing higher cancellation risk, bundled distribution gives the premium OTT video market a steadier retention path than constant discounting or short promotional offers. This is why partial reaggregation is becoming more visible across the premium OTT video market, with direct services still important but distribution partners regaining influence.
Restraints Impact Analysis of Premium OTT Video Market*
| Restraint | (~) % Impact on CAGR Forecast | Geographic Relevance | Impact Timeline |
|---|---|---|---|
| Subscription Fatigue and Service Stacking | -1.5% | Global, most acute in North America and Western Europe | Short term (≤ 2 years) |
| Escalating Content Acquisition and Sports Rights Costs | -1.2% | Global core, with cost pressure highest in North America and Asia-Pacific | Medium term (2-4 years) |
| Piracy and Unauthorized Restreaming of Premium Content | -0.7% | Asia-Pacific, South America, Middle East and Africa, with secondary impact in Europe | Medium term (2-4 years) |
| Fragmented Device Experience and App Store Commissions | -0.5% | Global, with platform-fee pressure most visible in North America | Short term (≤ 2 years) |
| Source: Mordor Intelligence | |||
Subscription Fatigue and Service Stacking
Subscription fatigue is a direct restraint on the premium OTT video market, as many households now review their entertainment spending more often than before. The premium OTT video market faces this pressure most clearly where consumers already manage several paid digital services and rotate them based on price or a single title. That behavior weakens long-term retention and makes the premium OTT video market more dependent on steady release quality, stronger bundles, and clearer value signals. The premium OTT video market also faces friction when ad-supported tiers reduce prices but do not improve viewer satisfaction enough to hold users over time. This means the premium OTT video market still has room to grow, but growth comes with tighter retention discipline and less tolerance for weak product differentiation.
Escalating Content Acquisition and Sports Rights Costs
Content and rights inflation is raising the cost floor across the premium OTT video market, especially for services that lack sufficient scale to spread spending across a very large base. Premium scripted programming, local originals, and sports packages all require long-cycle commitments, making the premium OTT video market harder for mid-tier platforms to navigate. The premium OTT video market is therefore moving toward a two-speed structure where the largest companies can keep investing while smaller players become more selective. This also increases the value of product efficiency, language reuse, and better targeting, because the premium OTT video market cannot rely solely on expensive content to support returns. The result is a wider gap inside the premium OTT video market between platforms that can turn content spend into durable monetization and those that mainly use it as a short-term churn defense.
*Our forecasts treat driver/restraint impacts as directional, not additive. The impact forecasts reflect baseline growth, mix effects, and variable interactions.
Premium OTT Video Market Segment Analysis
By Revenue Model:
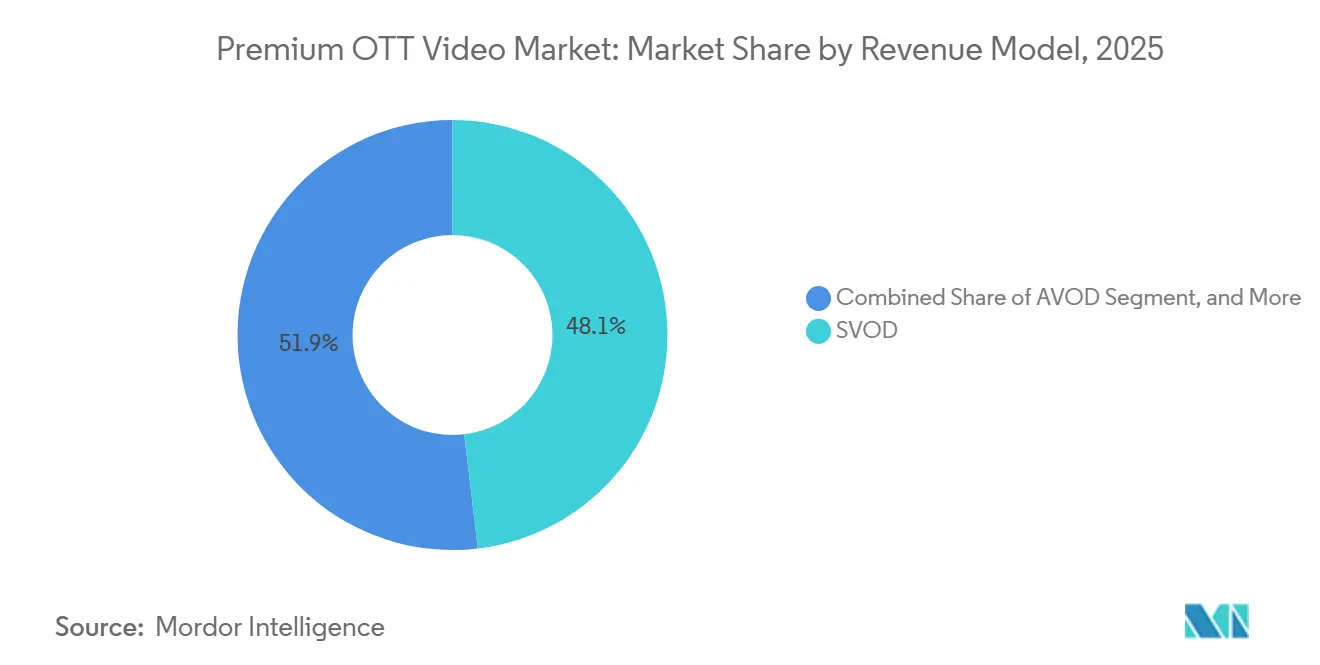
SVOD Anchors Revenue While AVOD Rewrites Growth MathSVOD held 48.12% of the premium OTT video market in 2025, making it the largest revenue model across the category. That position reflected the continued strength of ad-free viewing, premium originals, and the willingness of higher-value users to pay for cleaner access. Even with that lead, the premium OTT video market is shifting from a single-model structure to a layered one, because AVOD is projected to grow at 9.23% CAGR through 2031. The premium OTT video market share held by SVOD remained significant, but more flexible pricing and monetization formats are clearly capturing future expansion.
This shift matters because the premium OTT video market is now built around a monetization mix as much as subscriber scale. Large services are using multiple tiers to retain premium users while also attracting households that may hesitate to take another full-price subscription. That structure makes first-party data more valuable, and Netflix has shown how recommendation systems support viewing depth and retention at scale.[2]Netflix Technology Blog, “Measuring the Impact of Personalized Recommendations,” Netflix Technology Blog, medium.com In the premium OTT video industry, hybrid design is no longer seen as a transitional phase but as the standard commercial model.



By Content Genre:
TV Shows Lead By Volume, Movies Drive MonetizationTV Shows and Episodic Content accounted for 43.64% of the premium OTT video market in 2025, which made serial programming the largest content category by revenue contribution. This lead came from repeat engagement, because weekly episodes and multi-season viewing give users more reasons to stay subscribed between billing cycles. At the same time, Movies and Films are projected to grow at a 9.34% CAGR through 2031, giving this segment the fastest expansion rate in the premium OTT video market mix. The premium OTT video market, therefore, continues to rely on episodic content for retention while using films to drive release visibility and premium event viewing.
This balance is becoming more important because film and series content now play different roles inside platform economics. Ongoing series help stabilize user engagement, while films create strong bursts of attention that support promotion and perceived value. The premium over-the-top (OTT) video market is also broadening through non-English and locally resonant programming, and Netflix crossed the point where non-English original TV season releases made up the majority of its output in 2025. In the premium OTT video industry, genre strategy is increasingly tied to language expansion, regional reach, and more efficient use of library depth.
By Device Type:
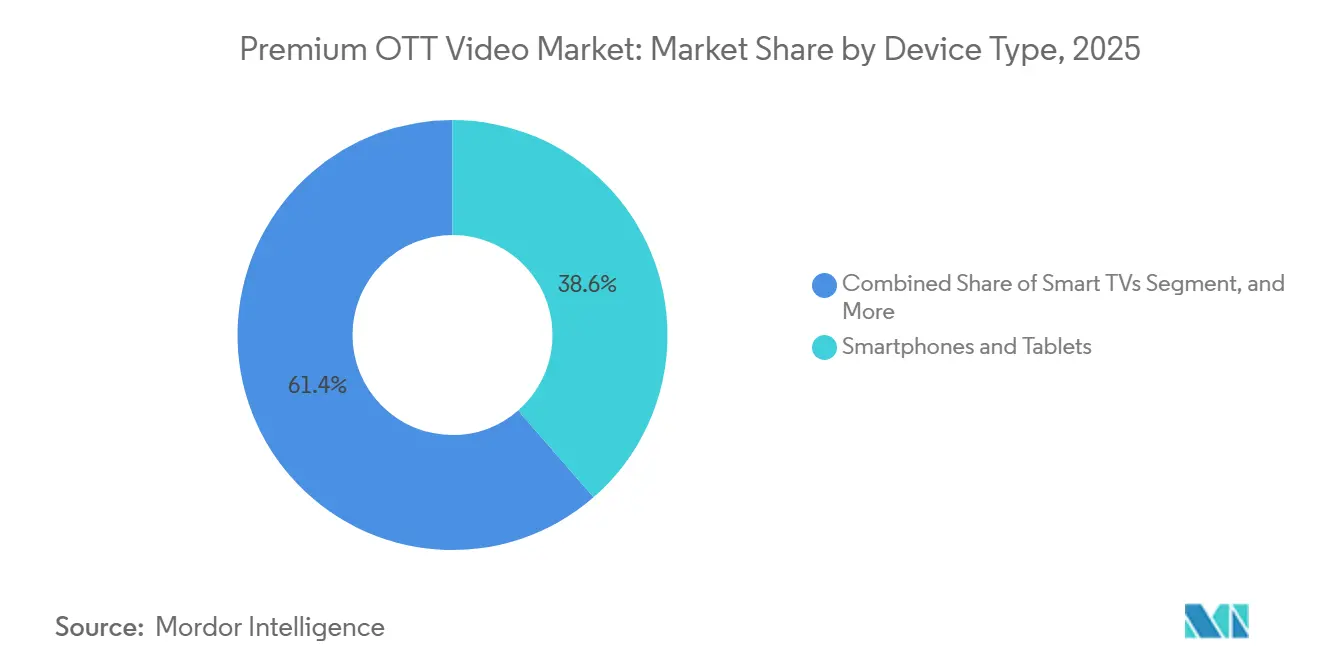
Smartphones Lead Share, But Smart TVs Are Winning The Living RoomSmartphones and Tablets accounted for 38.61% of revenue share in 2025, making mobile viewing the largest access path in the premium OTT video market. This reflected mobile-first streaming behavior across large parts of South Asia, Southeast Asia, and Africa, where handheld viewing still shapes discovery and everyday use. Smart TVs, however, are projected to grow at a 8.78% CAGR through 2031, making them the fastest-growing device category in the premium OTT video market. The premium OTT video market is therefore becoming more balanced between personal screens and shared household viewing environments.
The rise of larger-screen viewing changes competitive dynamics because discovery, subscription management, and ad delivery become more tied to operating systems and home interfaces. Zattoo reported that internet-based TV reached 54% of households in Germany in 2026, indicating that streaming has moved closer to the center of living room consumption. That shift matters because device control can influence visibility, usage patterns, and advertising value across the premium OTT video market. The premium OTT video industry is therefore paying closer attention to distribution through connected home screens, not just to app presence on mobile devices.
By End User:
Individual Consumers Dominate, Commercial Users AccelerateIndividual Consumers held 88.39% of the premium OTT video market in 2025, which kept household demand at the center of revenue generation. This segment remained dominant because direct consumer billing still drives most subscription revenue, and platform design continues to focus primarily on home entertainment needs. Commercial Users, however, are projected to expand at a 9.27% CAGR through 2031, making them the fastest-growing end-user segment in the premium OTT video market. The premium OTT video market share held by Individual Consumers remained overwhelming, but the growth rate of business use cases shows that the addressable base is widening.
Hospitality is one of the clearest examples of this shift, because modern streaming and casting tools are becoming part of the guest experience rather than an optional service layer. Streaming Hospitality introduced an Android TV-based in-room entertainment solution in June 2026, showing that a more defined business product ecosystem is taking shape. Similar use cases are extending into healthcare, retail, and enterprise settings where content supports entertainment, information, or training needs. The premium OTT video market is still consumer-led, but commercial demand is starting to add a second track of growth with different purchasing logic and lower churn expectations.
Geography Analysis
North America and Europe Premium OTT Video Market
North America held 37.28% of the premium OTT video market in 2025, maintaining its leading position in revenue. That lead reflected mature broadband access, long-standing subscription behavior, and the presence of the largest global platforms. The premium OTT video market in North America also remains the clearest example of how scale, brand strength, and monetization depth reinforce one another. Europe remains strategically important to the premium OTT video market, and Zattoo reported that 54% of households in Germany used internet-based TV in 2026, showing how streaming has overtaken older reception models in a major regional market.
APAC and South America Premium OTT Video Market
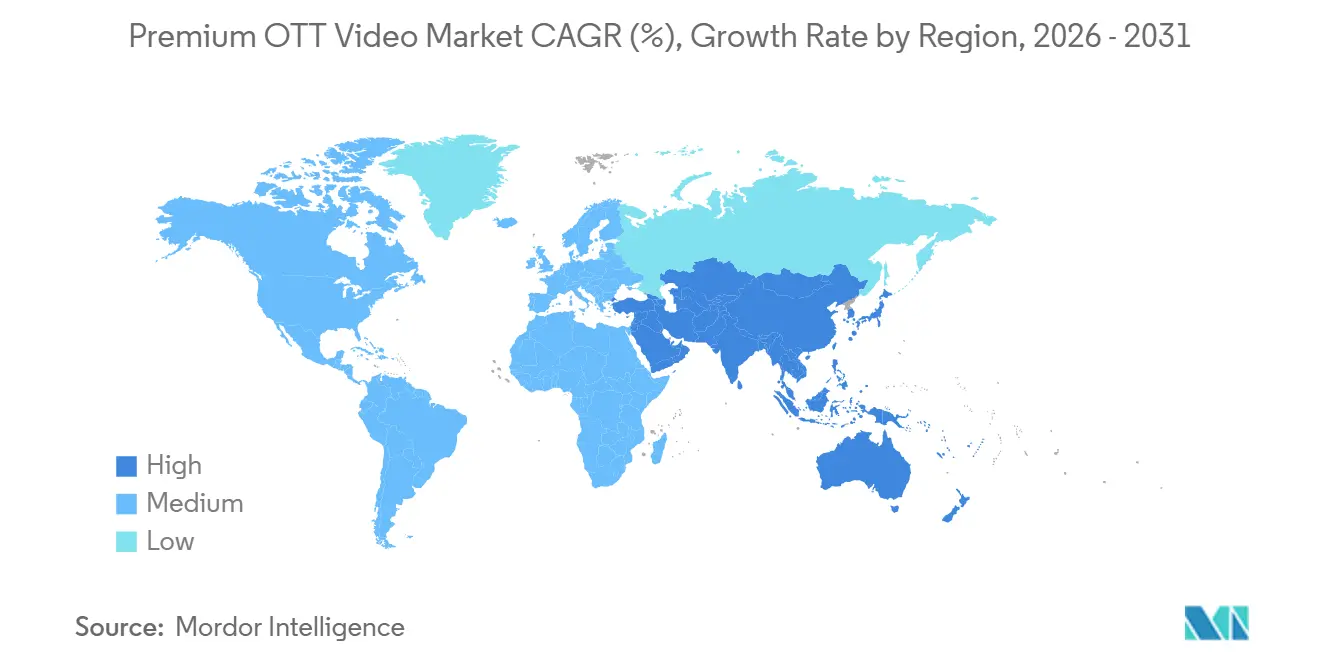
Asia-Pacific is projected to grow at a 9.53% CAGR through 2031, making it the fastest-growing region in the premium OTT video market. The premium OTT video market in this region combines very large audiences with uneven pricing power, so scale and monetization do not always move in the same direction. AVIA reported that India is on track to overtake China as the largest SVOD subscription market by 2030, reaching 358 million individual subscriptions, even though India’s premium VOD revenues will remain 4.5 times smaller than China’s due to a structurally lower ARPU. That contrast matters because the premium OTT video market in Asia-Pacific rewards reach, local relevance, and price discipline. iQIYI said its international viewership rose 130% year-on-year in the first half of 2026, while Indonesian subscriber revenue grew over 80% and Brazilian and Mexican subscriber revenues more than doubled in the first quarter of 2026.
MEA and South America Premium OTT Video Market
South America continues to offer room for growth in the premium OTT video market, as mobile viewing, local pricing, and entertainment demand continue to support adoption. The Middle East is gaining weight in the premium over-the-top (OTT) video market as digital infrastructure improves and younger audiences spend more time with app-based video services. Africa remains less developed, but the premium OTT video market, mobile-first delivery, lighter streaming formats, and flexible billing models are shaping it. Language accessibility is becoming increasingly important across these regions, and Disney+ expanded to 58 audio languages in January 2026, adding new languages and introducing a right-to-left interface.[3]The Walt Disney Company, “Disney+ Expands Language Support to 58 Audio Languages and Adds Right-to-Left Interface,” The Walt Disney Company, thewaltdisneycompany.com

Competitive Landscape
The premium OTT video market remains moderately concentrated at the top, with Netflix, Disney, and Amazon holding the strongest positions in the most valuable subscription environment. Their scale gives the premium OTT video market a clear leadership tier with stronger content budgets, deeper user data, and wider room for regional rollout. Even so, the premium OTT video market is not closed to regional specialists, as local-language depth, sports rights, and geography-specific programming still create defensible positions. Competition in the premium OTT video market is therefore shaped by both size and relevance, not by size alone.
Leading platforms are also defending their positions through product, access, and infrastructure choices. Netflix has treated personalization as core platform design, and its recommendation systems continue to shape viewing behavior at scale. Disney+ expanded audio support to 58 languages and added a right-to-left interface in January 2026, which strengthened accessibility and local fit across several regions.[4]The Walt Disney Company, “Disney+ Expands Language Support to 58 Audio Languages and Adds Right-to-Left Interface,” The Walt Disney Company, thewaltdisneycompany.com iQIYI launched Nadou Pro in April 2026, and the company said the platform had onboarded more than 10,000 active creators while aiming to reduce post-production costs by 35% through AI-assisted workflows. These moves show that the premium OTT video market is now competing through language coverage, production efficiency, and discovery quality as much as through catalog scale.
Regional and second-tier players still have space in the premium OTT video market, but their path is narrower than it was earlier in the cycle. The premium OTT video market now rewards sharper content identity, better distribution partnerships, and tighter spending discipline more than broad undifferentiated expansion. Commercial deployments, curated sports rights, and local originals can still create durable positions when they align with the right market structure. The premium OTT video market is therefore likely to remain active and competitive, but leadership will continue to favor companies that can combine scale, localization, and control over monetization.
Premium OTT Video Industry Leaders
Netflix, Inc.
Amazon.com, Inc.
The Walt Disney Company
Tencent Holdings Limited
Apple Inc.
- *Disclaimer: Major Players sorted in no particular order
Premium OTT Video Market Companies Covered in this Report
- Netflix, Inc.
- Amazon.com, Inc.
- The Walt Disney Company
- Apple Inc.
- Warner Bros. Discovery, Inc.
- Paramount Skydance Corporation
- Comcast Corporation
- Alphabet Inc.
- Tencent Holdings Limited
- iQIYI, Inc.
- Alibaba Group Holding Limited
- DAZN Group Limited
- JioHotstar
- Sony Group Corporation
- Zee Entertainment Enterprises Limited
- CANAL+ S.A.
- MBC Group
- Rakuten Group, Inc.
- Starz Entertainment Corp.
- Viaplay Group AB

Recent Industry Developments in Premium OTT Video Market
- June 2026: Streaming Hospitality launched a next-generation Android TV-based in-room entertainment solution designed for the hospitality industry, integrating live TV, streaming apps, casting, and hotel-branded content into a unified smart TV ecosystem.
- April 2026: iQIYI launched Nadou Pro, its AI-powered content creation platform, at World Conference 2026 in Beijing. The platform had onboarded over 10,000 active creators and targets a 35% reduction in post-production costs through AI-assisted scriptwriting, rendering, and localized subtitling.
- January 2026: Disney+ expanded its audio language support to 58 languages, adding 17 new languages including Arabic, Hindi, Tamil, Telugu, and Indonesian, alongside a right-to-left UI interface, representing a substantial accessibility and localization upgrade aimed at Asia-Pacific and Middle East and Africa markets.
- January 2026: Netflix and Warner Bros. Discovery amended their acquisition agreement to an all-cash transaction, simplifying the deal structure and accelerating the path to a stockholder vote. The revised all-cash deal was unanimously approved by both Boards and is subject to regulatory approval.


Global Premium OTT Video Market Report Scope
The Premium OTT Video Market comprises subscription- and transaction-based over-the-top (OTT) streaming services that deliver professionally produced premium video content directly to consumers over the internet, bypassing traditional cable, satellite, and broadcast television networks. These platforms provide access to high-quality movies, television series, documentaries, live events, and exclusive original programming, offering on-demand and premium viewing experiences across multiple internet-connected devices.
The Premium OTT Video Market Report is Segmented by Revenue Model (SVOD, AVOD, TVOD, and Hybrid Premium OTT), Content Genre (Movies and Films, TV Shows and Episodic Content, Documentaries, and Other Content Genres), Device Type (Smartphones and Tablets, Smart TVs, Laptops and Desktops, and Other Device Types), End User (Individual Consumers, and Commercial Users), and Geography (North America, South America, Europe, Asia-Pacific, Middle East, and Africa). The Market Forecasts are Provided in Terms of Value (USD).
| SVOD |
| AVOD |
| TVOD |
| Hybrid Premium OTT |
| Movies and Films |
| TV Shows and Episodic Content |
| Documentaries |
| Other Content Genres |
| Smartphones and Tablets |
| Smart TVs |
| Laptops and Desktops |
| Other Device Types |
| Individual Consumers |
| Commercial Users |
| North America | United States |
| Canada | |
| Mexico | |
| South America | Brazil |
| Argentina | |
| Chile | |
| Rest of South America | |
| Europe | Germany |
| United Kingdom | |
| France | |
| Italy | |
| Spain | |
| Rest of Europe | |
| Asia-Pacific | China |
| Japan | |
| India | |
| South Korea | |
| Australia | |
| Rest of Asia-Pacific | |
| Middle East | Saudi Arabia |
| United Arab Emirates | |
| Qatar | |
| Rest of Middle East | |
| Africa | South Africa |
| Egypt | |
| Nigeria | |
| Rest of Africa |
| By Revenue Model | SVOD | |
| AVOD | ||
| TVOD | ||
| Hybrid Premium OTT | ||
| By Content Genre | Movies and Films | |
| TV Shows and Episodic Content | ||
| Documentaries | ||
| Other Content Genres | ||
| By Device Type | Smartphones and Tablets | |
| Smart TVs | ||
| Laptops and Desktops | ||
| Other Device Types | ||
| By End User | Individual Consumers | |
| Commercial Users | ||
| By Geography | North America | United States |
| Canada | ||
| Mexico | ||
| South America | Brazil | |
| Argentina | ||
| Chile | ||
| Rest of South America | ||
| Europe | Germany | |
| United Kingdom | ||
| France | ||
| Italy | ||
| Spain | ||
| Rest of Europe | ||
| Asia-Pacific | China | |
| Japan | ||
| India | ||
| South Korea | ||
| Australia | ||
| Rest of Asia-Pacific | ||
| Middle East | Saudi Arabia | |
| United Arab Emirates | ||
| Qatar | ||
| Rest of Middle East | ||
| Africa | South Africa | |
| Egypt | ||
| Nigeria | ||
| Rest of Africa | ||


Key Questions Answered in the Report
What is the premium OTT video market size in 2026 and how fast is it expected to grow?
The premium OTT video market stood at USD 224.54 billion in 2026 and is projected to reach USD 332.74 billion by 2031 at 8.18% CAGR.
Which revenue model currently leads premium OTT video?
SVOD led with 48.12% share in 2025, but AVOD is projected to grow faster at 9.23% CAGR through 2031.
Which content segment is the largest in premium OTT video?
TV Shows and Episodic Content held the largest share at 43.64% in 2025 because serialized viewing supports stronger ongoing engagement.
Why are sports rights important in premium streaming?
Sports rights help platforms keep users active throughout the year and support both subscription revenue and premium advertising demand.
Which device category is shaping the next phase of viewing?
Smartphones and Tablets led with 38.61% share in 2025, while Smart TVs are projected to grow faster at 8.78% CAGR through 2031.
Which region is growing fastest in premium OTT video?
Asia-Pacific is the fastest-growing region, with a projected CAGR of 9.53% through 2031, supported by large subscription growth and strong local content demand.
Page last updated on:





