Pre-Press And Packaging Graphics Services Market Size and Share
Market Overview
| Study Period | 2019 - 2030 |
|---|---|
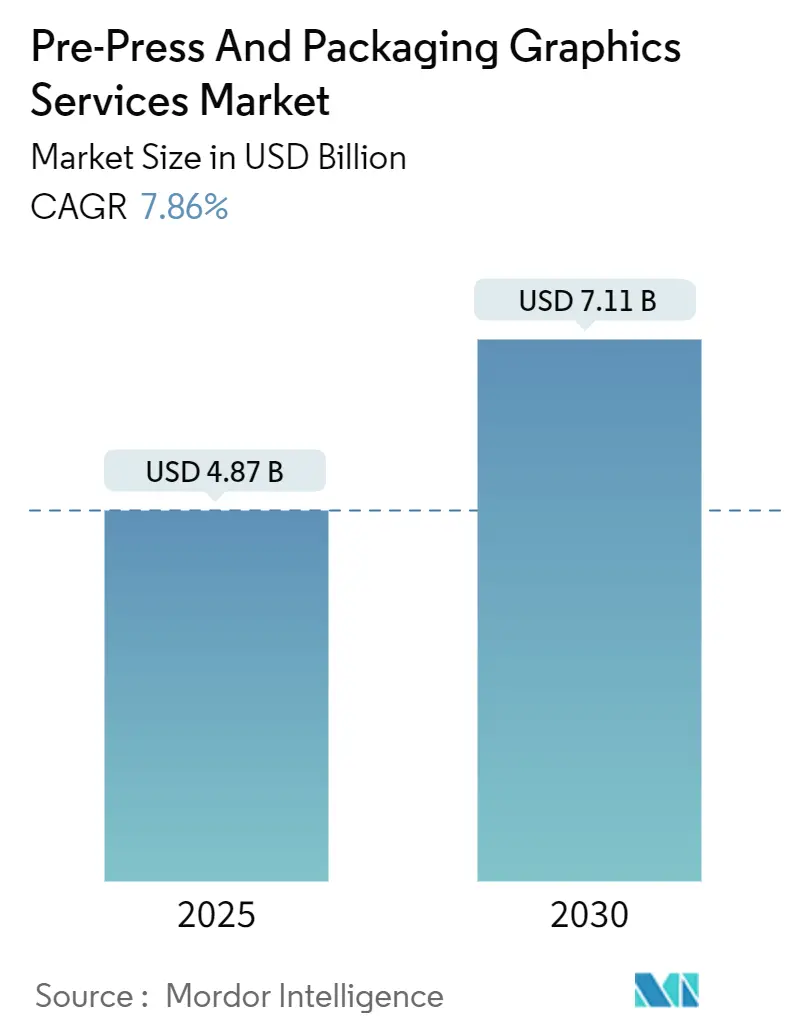
| Market Size (2025) | USD 4.87 Billion |
| Market Size (2030) | USD 7.11 Billion |
| Growth Rate (2025 - 2030) | 7.86% CAGR |
| Fastest Growing Market | Asia Pacific |
| Largest Market | Asia Pacific |
| Market Concentration | Medium |
Major Players *Disclaimer: Major Players sorted in no particular order Image © Mordor Intelligence. Reuse requires attribution under CC BY 4.0. | |
Pre-Press And Packaging Graphics Services Market Analysis by Mordor Intelligence
The pre-press and packaging graphics services market size is estimated at USD 4.87 billion in 2025 and is projected to reach USD 7.11 billion by 2030, growing at a 7.86% CAGR. Robust demand for rapid artwork adaptation, global color consistency, and cloud-based workflow automation anchors the expansion of the pre-press and packaging graphics services market. Shorter product-launch cycles in the consumer packaged goods industry, steady migration toward digital and hybrid printing lines, and a widening pool of small-to-medium converters adopting software-as-a-service tools further reinforce revenue visibility. The Asia-Pacific region leads the pre-press and packaging graphics services market as production shifts closer to regional consumer clusters, while North American converters maintain technological leadership through early adoption of extended-gamut color management and G7 certification. The industry’s shift from plate-centric processes to digitally integrated ecosystems reduces time-to-market, significantly lowers proofing waste, and enhances brand control across global supply chains.
Key Report Takeaways
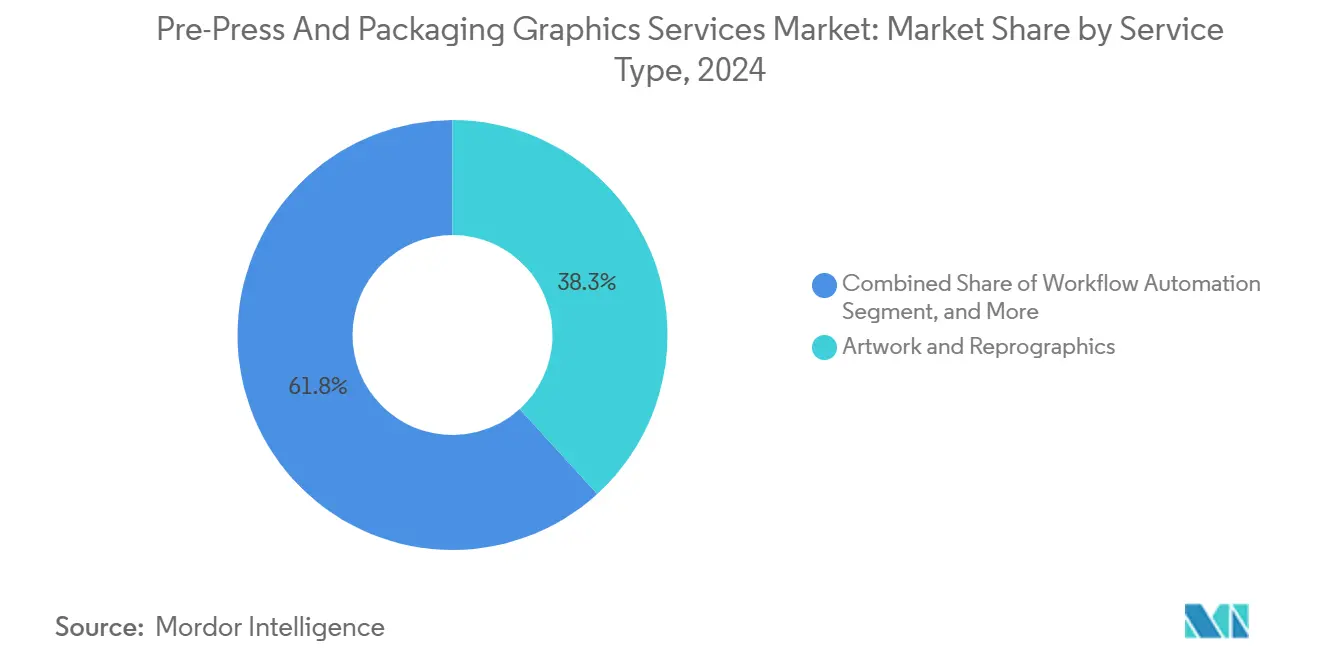
- By service type, artwork and reprographics captured 38.25% of the Pre-Press and Packaging Graphics Services Market share in 2024.
- By printing technology, Pre-Press and Packaging Graphics Services Market size for digital printing is projected to grow at 9.97% CAGR between 2020–2030.
- By end-user industry, food and beverage companies captured 40.62% of the Pre-Press and Packaging Graphics Services Market share in 2024.
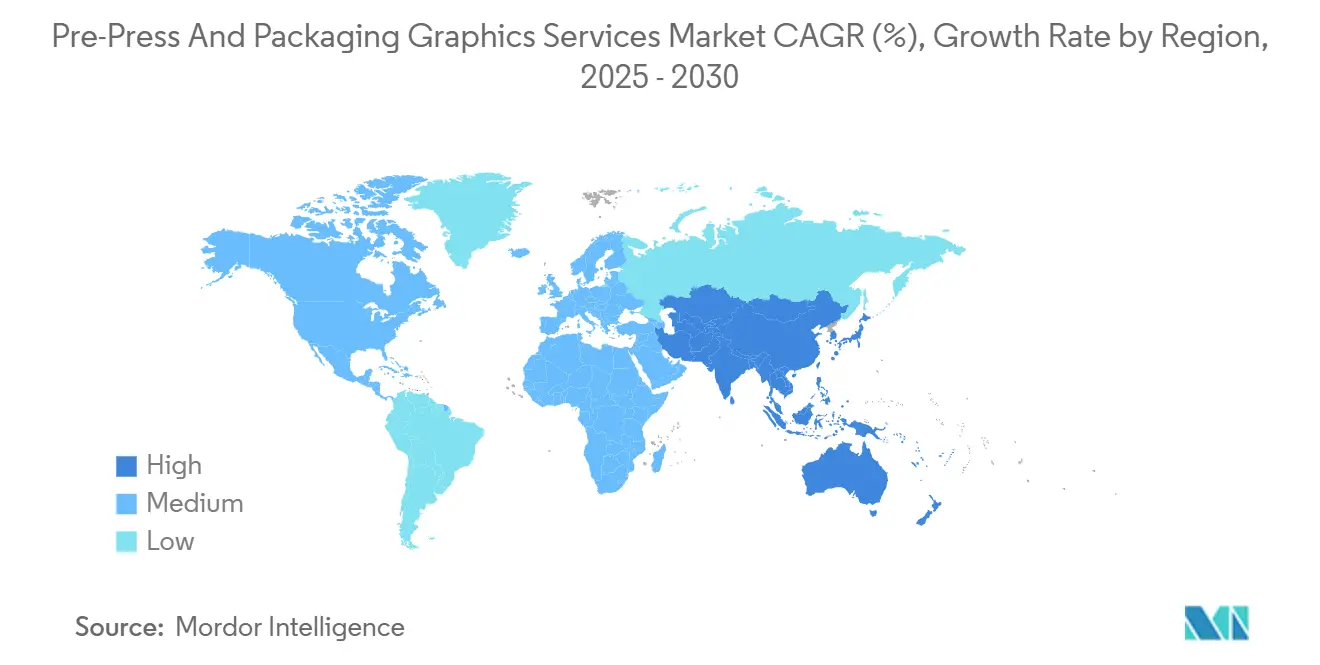
- By geography, the Pre-Press and Packaging Graphics Services Market size in Asia-Pacific is projected to grow at a 10.59% CAGR between 2025–2030.
Global Pre-Press And Packaging Graphics Services Market Trends and Insights
Drivers Impact Analysis*
| Driver | (~) % Impact on CAGR Forecast | Geographic Relevance | Impact Timeline |
|---|---|---|---|
| Rising SKU proliferation and shorter product-launch cycles | +1.8% | Global, strongest in North America and Asia-Pacific | Medium term (2-4 years) |
| Brand-owner demand for global color consistency | +1.5% | Global, especially multinational CPG networks | Long term (≥ 4 years) |
| Shift toward digital and hybrid print workflows | +1.2% | North America and Europe leading, Asia-Pacific following | Medium term (2-4 years) |
| Adoption of extended-gamut or spot-color simulations | +0.9% | Developed markets first, then global | Long term (≥ 4 years) |
| Growing e-commerce driven need for agile artwork updates | +1.1% | Global, linked to online retail penetration | Short term (≤ 2 years) |
| Emerging SaaS workflow-automation platforms for SMB converters | +0.7% | Asia-Pacific and South America SMB-dense areas | Medium term (2-4 years) |
| Source: Mordor Intelligence | |||
Rising SKU Proliferation and Shorter Product-Launch Cycles
Consumer packaged goods companies introduced 47% more product variants in 2024 than in 2019, condensing launch timelines from 18 months to 8 months. Each new SKU requires distinct artwork, plate preparation, and regulatory adaptation, thereby multiplying prepress tasks. Service providers respond by scaling cloud-based parallel workflows that triage hundreds of files in near real time. Automated approval loops and template libraries eliminate repetitive layout steps, allowing converters to maintain brand integrity across multiple substrates. The acceleration of promotional rotations intensifies baseline volumes in the pre-press and packaging graphics services market.
Brand-Owner Demand for Global Color Consistency
Tolerance limits have tightened from Delta E 3.0 to Delta E 1.5 since 2022, underscoring strict corporate identity controls. G7 Master Printer certifications increased by 23% in 2024, yet certified talent remains concentrated in developed regions. Advanced color workflows pair spectrophotometry with ICC profile optimization, so print output on flexible pouches in Vietnam matches cartons in Mexico. Pharmaceutical packaging, where hue misalignment can endanger patient safety, illustrates the high stakes. Pre-press partners that deliver repeatable color metrics win preferred-supplier status in global bid cycles.
Shift Toward Digital and Hybrid Print Workflows
Although digital presses produced only 1.1% of packaging volume in 2024, they generated 3.9% of segment value through premium short runs and personalization. Installations of HP Indigo presses climbed 18% year over year, targeting cosmetics and specialty food lines that require variable data serializations. Hybrid plants integrate inkjet embellishment bays onto conventional flexo lines, enabling on-press numbering without extra makeready time. These dynamics are pushing the pre-press and packaging graphics services market toward dynamic content management, replacing static file handoffs.
Adoption of Extended-Gamut or Spot-Color Simulations
OGV ink sets reproduce 90% of Pantone colors, compared to 75% for classic CMYK. Brand portfolios that once carried 6.2 spot colors per job have been reduced to 3.8 colors, resulting in smaller plate counts and fewer proofing loops.[1]Idealliance team, “Color Management Standards and Best Practices,” Idealliance, idealliance.org Procter & Gamble reported a 34% drop in color-management complexity after global OGV rollouts in 2024. Success requires specialist RIP software and fresh operator skills, setting a proficiency bar that divides advanced pre-press partners from basic repro houses.
Restraints Impact Analysis*
| Restraint | (~) % Impact on CAGR Forecast | Geographic Relevance | Impact Timeline |
|---|---|---|---|
| Capital-intensive color-management hardware and software | -1.3% | Global, strongest drag on SMB converters | Long term (≥ 4 years) |
| Fragmented converter base with low prepress digital maturity | -0.9% | Asia-Pacific and South America | Medium term (2-4 years) |
| Shortage of G7-certified operators | -0.7% | Global, most acute in emerging markets | Long term (≥ 4 years) |
| Security and IP concerns in cloud artwork collaboration | -0.5% | Global, heightened in regulated industries | Short term (≤ 2 years) |
| Source: Mordor Intelligence | |||
Capital-Intensive Color-Management Hardware and Software
A fully featured prepress color lab can cost USD 500,000, placing advanced spectral press controls out of reach for small converters. Essential devices, such as the X-Rite i1Pro 3 Plus, cost USD 8,500 each, while annual licenses for enterprise RIP suites exceed USD 50,000. Five-year depreciation cycles slow upgrade cadence, widening capability gaps between multinational hubs and regional shops. Consequently, regional converters often outsource complex color management, which restricts local responsiveness and blunts the overall momentum of the pre-press and packaging graphics services market.
Shortage of G7-Certified Operators
Global demand for calibration specialists outpaces supply, particularly in Southeast Asia and Latin America, where digital adoption is rising fastest. Training pathways can take 18 months, and many operators transition to OEM service roles, intensifying scarcity. Brands reluctant to risk color drift steer jobs to certified hubs, centralizing work but increasing logistical miles. The talent crunch limits service rollout speed at precisely the moment market volume is scaling.
*Our forecasts treat driver/restraint impacts as directional, not additive. The impact forecasts reflect baseline growth, mix effects, and variable interactions.
Segment Analysis
By Service Type: Workflow Automation Scales Artwork Throughput
Artwork and reprographics accounted for 38.25% of the pre-press and packaging graphics services market size in 2024, underscoring their foundational role in packaging supply chains. However, the next wave of investment is shifting toward subscription-based workflow automation, which is set to record the fastest growth at 9.67% CAGR through 2030. SaaS suites built for plate-room scheduling, automatic trapping, and online proof routing allow converters to collapse approval loops from days to hours. In addition, brand portals feed live SKU libraries directly into pre-media servers, dramatically reducing manual relinking and version-control errors.
The democratization of advanced automation tools energizes small and medium converters that previously lacked capital for on-premise systems. At monthly fees below USD 500 per site, platforms such as GelatoConnect extend enterprise-grade asset governance and real-time status dashboards across distributed production networks. Together, these capabilities expand job capacity without proportional payroll growth, supporting higher margins even on micro-batch runs. As a result, the pre-press and packaging graphics services market steadily migrates from project-based billing toward recurring software and managed-service revenues.


By Printing Technology: Digital Growth Outpaces Flexographic Dominance
Flexography retained 46.04% of the pre-press and packaging graphics services market share in 2024, driven by its versatility across labels, corrugated, and flexible substrates. Yet digital printing, while still emerging, is expected to post a 9.97% CAGR to 2030 as converters unlock new value in variable data, late-stage customization, and shorter makeready windows. Dynamic content management systems eliminate redundant file-rebuild steps and feed serialized data streams straight to the press. Consequently, demand for plate imaging and analog proofing is beginning to plateau within leading consumer-goods categories.
Hybrid plants are already configuring offset, flexo, and inkjet stations in a single line to combine economies of scale with fast switchovers. This integration requires pre-press partners to supply standardized color profiles that travel seamlessly between analog and digital units. Providers skilled in spectral fingerprinting and device-link ICC creation can therefore charge a premium for their expertise in complexity management. While flexography remains indispensable for very long runs, digital’s rising share signals a long-term shift in the mix that will underpin continued revenue expansion across the pre-press and packaging graphics services market.
By End-user Industry: Pharmaceutical Compliance Lifts High-Value Workflows
Food and beverage dominated the pre-press and packaging graphics services market with a 40.62% share in 2024, reflecting high SKU churn and intense merchandising pressure. However, pharmaceutical applications will log the fastest growth rate of 10.27%, propelled by serialization rules and dose-level tracking mandates. Each carton and blister now requires a unique identifier printed in precise color values to prevent counterfeits and dosage errors. Artwork versions have proliferated as regulations diverge across markets, increasing the average pre-media spending per job. The requirement for audit-trail transparency has likewise grown, placing new emphasis on secure cloud handoffs and immutable approval logs.
Personal care brands also contribute sizable volumes by refreshing seasonal lines and introducing specialty finishes, yet compliance-driven pharmaceutical work commands premium rates due to the need for risk mitigation. Pre-press partners offering 100% inspection reporting, GS1-ready barcodes, and locked-down role hierarchies can secure three-year preferred-supplier pacts. These dynamics collectively reinforce the value of advanced capabilities in the pre-press and packaging graphics services industry, as complexity rather than pure tonnage increasingly shapes revenue pools.

Geography Analysis
Asia-Pacific led the pre-press and packaging graphics services market with a 32.51% revenue share in 2024 and is forecast to grow at a 10.59% CAGR through 2030. Regional governments in China, India, and Vietnam subsidize Industry 4.0 investments, accelerating press upgrades and cloud workflow adoption. Converters in Guangdong and Zhejiang now offer an integrated service that bundles plate imaging, color management, and last-mile logistics, shortening lead times for regional brand owners.[2]Asian Development Bank analytics unit, “Manufacturing Digitalization in Southeast Asia,” Asian Development Bank, adb.org
North America accounts for the largest installed base of G7 Master Printer sites and hosts early pilots in extended-gamut process control. While market expansion moderates to mid-single digits, the region maintains premium pricing through high certification density and tight intellectual property safeguards. Europe emphasizes circular-economy labeling and premium customer-experience graphics, driving demand for rigorous ink coverage modeling and subscription tools for soft-proofing. Stable infrastructure and seasoned operator talent sustain above-average realization rates, compensating for slower headline growth.
Latin America and the Middle East and Africa together hold single-digit shares of the pre-press and packaging graphics services market size but present rising upside as consumer-goods assembly migrates closer to local buyers. E-commerce penetration in Brazil and the Gulf is prompting converters to install digital lines for late-stage regionalization. At the same time, skill gaps and fragmented plant footprints create consultancy opportunities for certification programs and hosted pre-media centers. Over the forecast window, both regions are expected to outpace global averages from a smaller revenue base, helping diversify growth sources beyond the traditional triad markets.

Competitive Landscape
The competitive field remains moderately fragmented, with the top five players controlling less than 25% of the global revenue. Propelis Group emerged in 2025 following the merger of SGK and SGS, creating a scaled platform with 70 global facilities and proprietary automation software. Janoschka AG continues to strengthen its European footprint through investments in automated gravure cylinder engraving and centralized color laboratories. Esko and HP anchor the ecosystem from a technology angle, licensing cloud-first pre-media orchestration and extended-gamut RIP modules.[3]United States Patent and Trademark Office bulletin, “Patent Activity in Packaging Workflow Automation,” USPTO, uspto.gov
Strategic postures increasingly revolve around vertical integration. Large converters build in-house pre-press studios while pure-play service bureaus broaden into pharma compliance audits. Specialized software vendors partner with regional pre-media houses, embedding their SaaS engines to secure recurring fees and drive data analytics upsells. Private equity interest remains high, evidenced by Crestview Partners’ 2025 purchase of Smyth Companies, which unlocked capital for new spectrophotometers and AI-assisted proofing lines.
Barriers to entry center on certification credentials, color science intellectual property, and secure data transfer infrastructure, rather than the physical plant alone. Smaller providers mitigate scale disadvantages by focusing on language localization, last-minute promotion swaps, or serving niche substrates like shrink sleeves. Patent filings now cluster around predictive color algorithms and automated plate-cell geometry optimization, foreshadowing the next wave of differentiation in the pre-press and packaging graphics services market.
Pre-Press And Packaging Graphics Services Industry Leaders
Propelis Group
Janoschka AG
Miller Graphics AB
Reproflex3 Ltd
Sun Branding Solutions Ltd
- *Disclaimer: Major Players sorted in no particular order

Recent Industry Developments
- October 2025: International Paper finalized a USD 9.9 billion acquisition of DS Smith, expanding integrated packaging graphics resources in Europe and North America.
- September 2025: UPM Raflatac acquired Metamark to enhance its specialty graphics capabilities for high-performance substrates.
- August 2025: SGK and SGS merged to form Propelis Group, establishing a worldwide packaging graphics services leader.
- July 2025: Crestview Partners purchased Smyth Companies for USD 150 million to enhance regional pre-press and digital printing capacity.


Global Pre-Press And Packaging Graphics Services Market Report Scope
| Pre-media Concept and Design |
| Artwork and Reprographics |
| Color Management and Proofing |
| Plate/Tooling Supply |
| Workflow Automation |
| Flexography |
| Gravure |
| Offset Lithography |
| Digital Printing |
| Screen Printing |
| Other Printing Technologies |
| Food and Beverage |
| Personal Care and Cosmetics |
| Pharmaceuticals |
| Household and Homecare |
| Electronics |
| Other End-user Industries |
| North America | United States | |
| Canada | ||
| Mexico | ||
| South America | Brazil | |
| Argentina | ||
| Chile | ||
| Rest of South America | ||
| Europe | United Kingdom | |
| Germany | ||
| France | ||
| Italy | ||
| Spain | ||
| Russia | ||
| Rest of Europe | ||
| Asia-Pacific | China | |
| India | ||
| Japan | ||
| South Korea | ||
| Australia | ||
| Rest of Asia-Pacific | ||
| Middle East and Africa | Middle East | Saudi Arabia |
| United Arab Emirates | ||
| Turkey | ||
| Rest of Middle East | ||
| Africa | South Africa | |
| Nigeria | ||
| Rest of Africa | ||
| By Service Type | Pre-media Concept and Design | ||
| Artwork and Reprographics | |||
| Color Management and Proofing | |||
| Plate/Tooling Supply | |||
| Workflow Automation | |||
| By Printing Technology | Flexography | ||
| Gravure | |||
| Offset Lithography | |||
| Digital Printing | |||
| Screen Printing | |||
| Other Printing Technologies | |||
| By End-user Industry | Food and Beverage | ||
| Personal Care and Cosmetics | |||
| Pharmaceuticals | |||
| Household and Homecare | |||
| Electronics | |||
| Other End-user Industries | |||
| By Geography | North America | United States | |
| Canada | |||
| Mexico | |||
| South America | Brazil | ||
| Argentina | |||
| Chile | |||
| Rest of South America | |||
| Europe | United Kingdom | ||
| Germany | |||
| France | |||
| Italy | |||
| Spain | |||
| Russia | |||
| Rest of Europe | |||
| Asia-Pacific | China | ||
| India | |||
| Japan | |||
| South Korea | |||
| Australia | |||
| Rest of Asia-Pacific | |||
| Middle East and Africa | Middle East | Saudi Arabia | |
| United Arab Emirates | |||
| Turkey | |||
| Rest of Middle East | |||
| Africa | South Africa | ||
| Nigeria | |||
| Rest of Africa | |||


Key Questions Answered in the Report
How fast is the pre-press and packaging graphics services market expected to grow between 2025 and 2030?
The market is projected to expand from USD 4.87 billion in 2025 to USD 7.11 billion by 2030, registering a 7.86% CAGR.
Which region contributes the largest revenue today?
The Asia-Pacific region led with 32.51% of global revenue in 2024, driven by its large manufacturing bases and rapid digital adoption.
What drives the surge in spending on pharmaceutical packaging graphics?
Serialization mandates and patient-safety tracking demand precise variable data printing and color-controlled graphics, supporting a 10.27% CAGR through 2030.
Why are small converters adopting SaaS workflow tools?
Subscription platforms lower entry costs, automate file preparation, and cut approval times, allowing smaller firms to compete on agility.
How are digital printing reshaping pre-press workflows?
Digital and hybrid presses require dynamic content management, eliminating plate-related delays and boosting demand for cloud-based asset orchestration.
What challenges limit faster market adoption of advanced color systems?
High upfront hardware and software spending, plus a global shortage of G7-certified operators, constrain rollout, especially in emerging economies.
Page last updated on:


