Power Supply And Charger Market Size and Share
Market Overview
| Study Period | 2019 - 2030 |
|---|---|
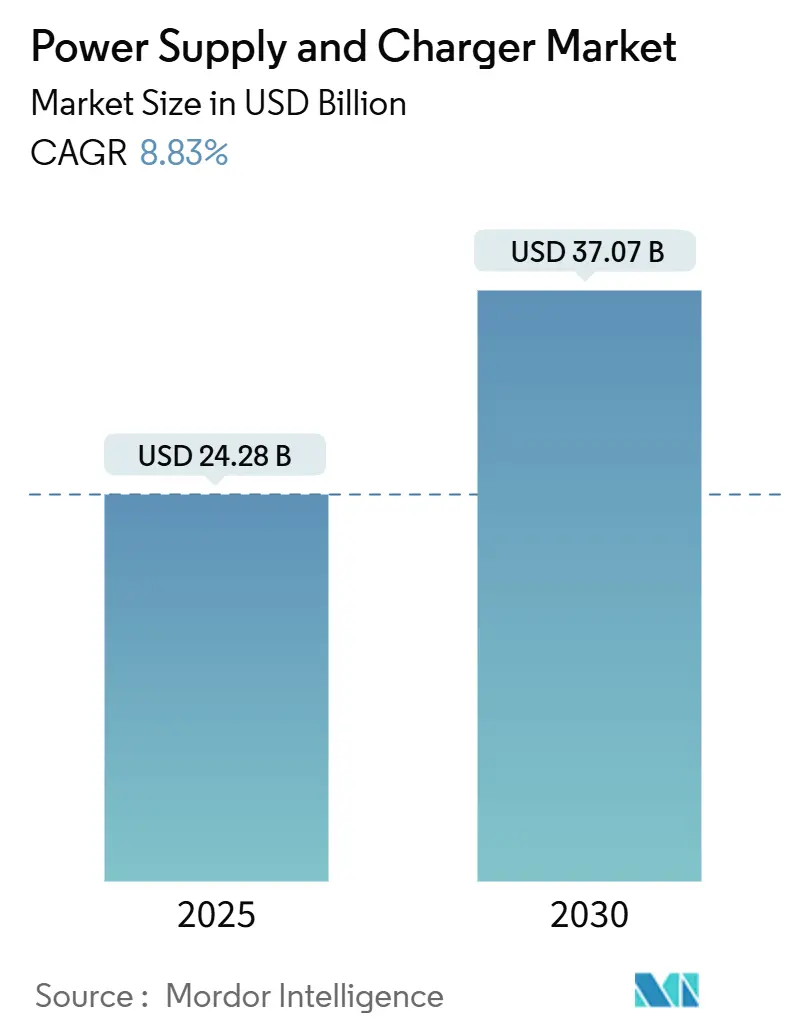
| Market Size (2025) | USD 24.28 Billion |
| Market Size (2030) | USD 37.07 Billion |
| Growth Rate (2025 - 2030) | 8.83% CAGR |
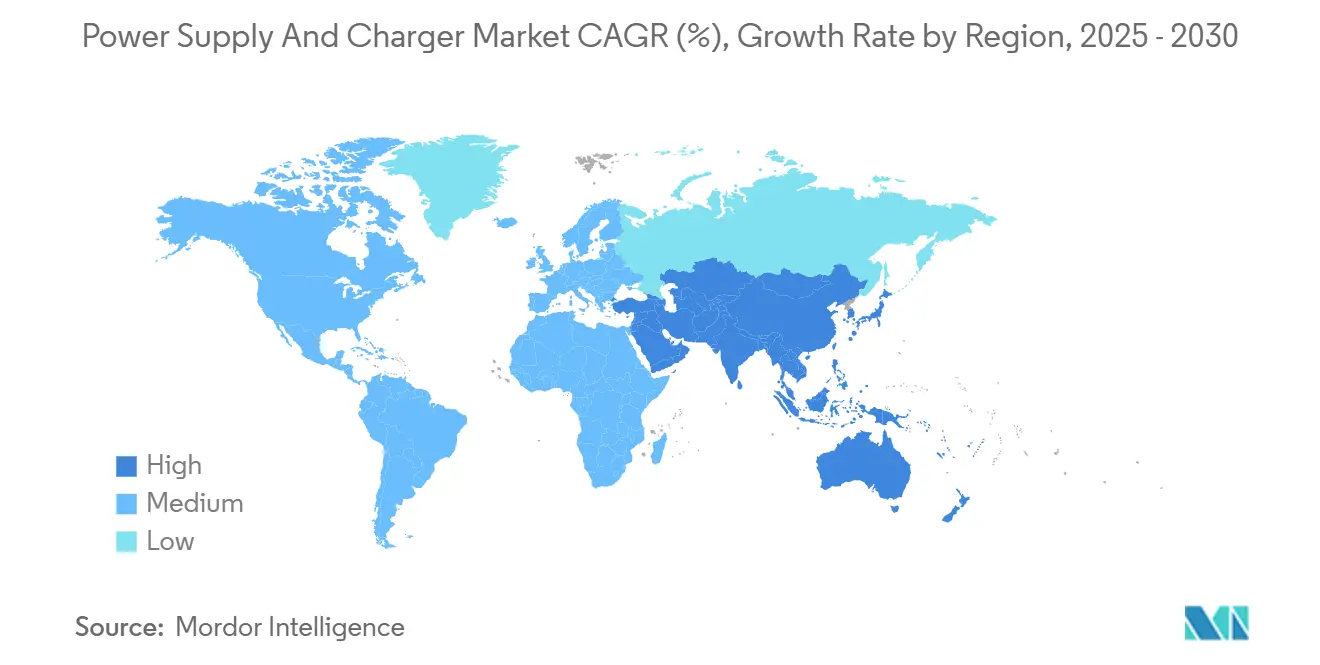
| Fastest Growing Market | Middle East |
| Largest Market | Asia Pacific |
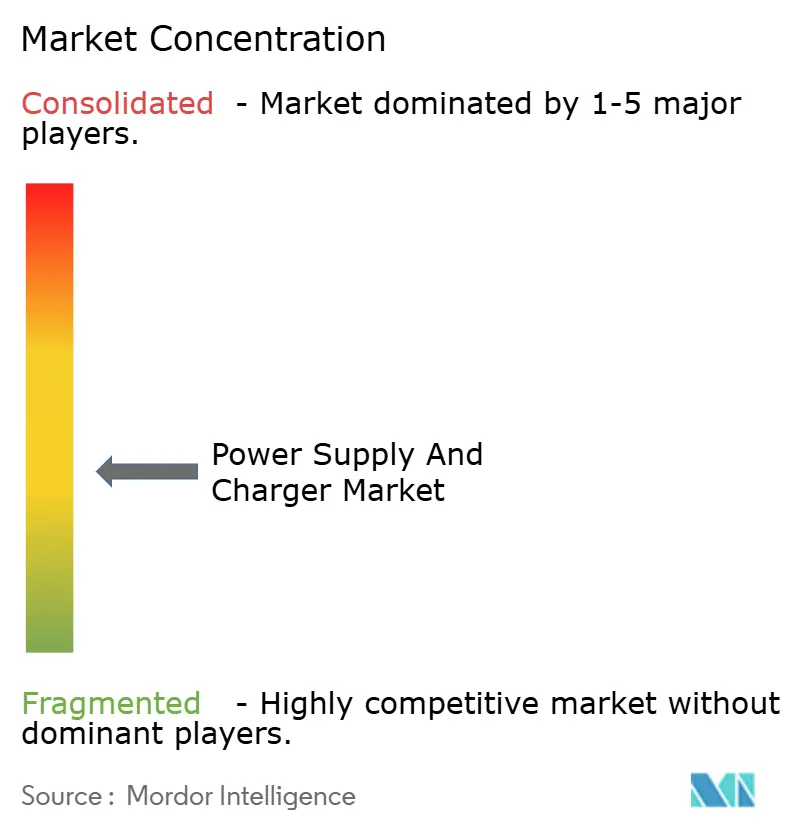
| Market Concentration | Medium |
Major Players *Disclaimer: Major Players sorted in no particular order Image © Mordor Intelligence. Reuse requires attribution under CC BY 4.0. | |
Power Supply And Charger Market Analysis by Mordor Intelligence
The Power Supply and Charger market was valued at USD 24.28 billion in 2025 and is projected to reach USD 37.07 billion by 2030, advancing at an 8.83% CAGR. This growth trajectory reflects buyers shifting toward high-efficiency gallium nitride and silicon carbide topologies, surging hyperscale data center buildouts, and the rapid electrification of automotive and industrial equipment. Medium-power units serving consumer electronics continue to generate high shipment volumes; however, enterprise infrastructure now provides the strongest incremental revenue, as operators prioritize power density and thermal performance. The Asia Pacific remains the revenue anchor due to China’s large-scale manufacturing and India’s incentive programs, whereas the Middle East delivers the fastest regional growth, as sovereign wealth funds bankroll data center and renewable energy projects. Competitive intensity remains elevated, although incumbents with automotive and medical certifications defend their margins by leveraging their deep regulatory expertise.
Key Report Takeaways
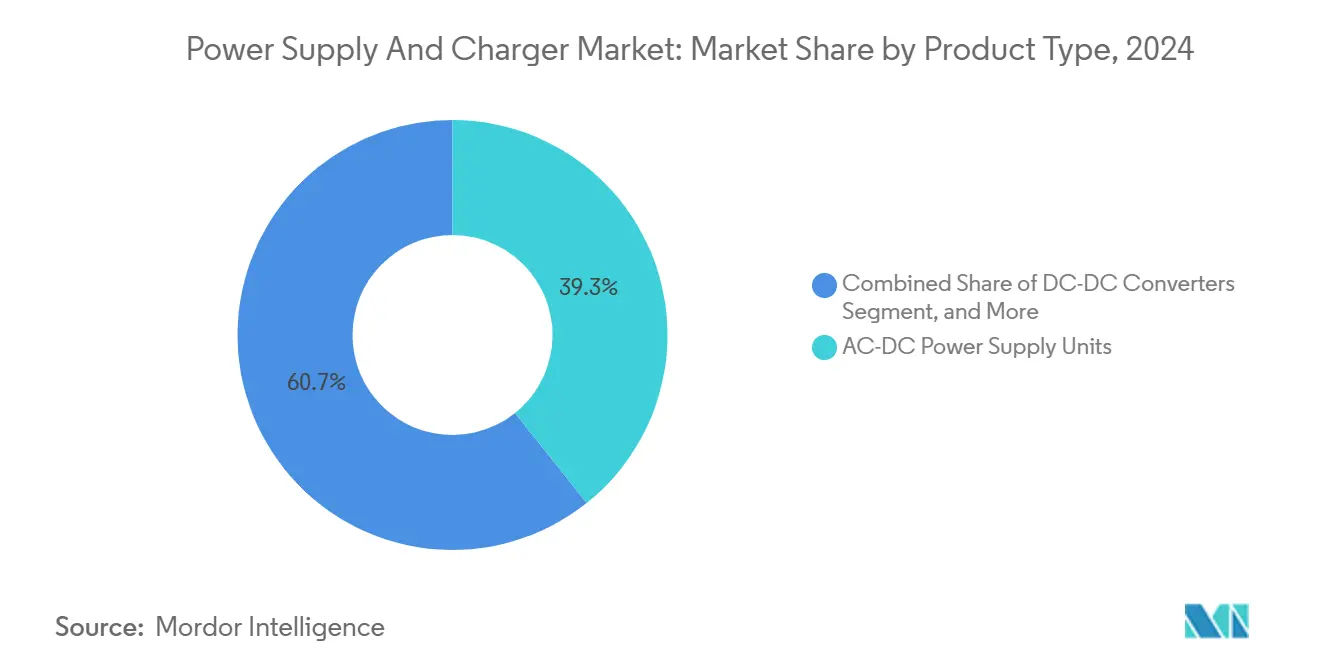
- By product type, AC-DC power supply units led with 39.27% market share of the power supply and charger market in 2024, while DC-DC converters are forecast to expand at a 9.83% CAGR through 2030.
- By power rating, medium-power devices captured 45.89% market share of the power supply and charger market in 2024, whereas high-power units above 1,000 watts are projected to grow at a 9.17% CAGR to 2030.
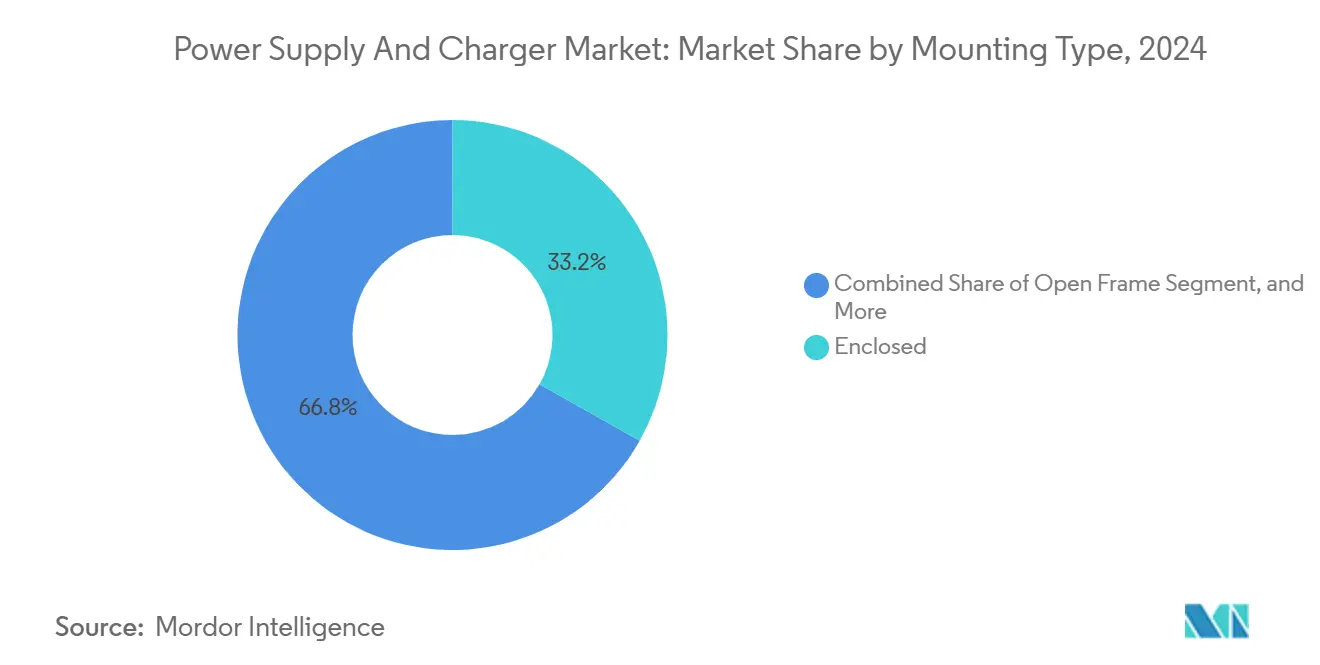
- By mounting type, enclosed configurations accounted for 33.19% market share of the power supply and charger market in 2024, while open-frame designs are poised to advance at a 9.89% CAGR through 2030.
- By application, consumer electronics accounted for a 33.76% share in 2024, and automotive applications are set to rise at a 10.13% CAGR through 2030.
- By geography, the Asia Pacific generated 49.68% of 2024 revenue, and the Middle East is expected to register the fastest regional CAGR at 9.91% through 2030.
Note: Market size and forecast figures in this report are generated using Mordor Intelligence’s proprietary estimation framework, updated with the latest available data and insights as of January 2026.
Global Power Supply And Charger Market Trends and Insights
Drivers Impact Analysis*
| Driver | (~) % Impact on CAGR Forecast | Geographic Relevance | Impact Timeline |
|---|---|---|---|
| Proliferation of Fast-Charging Protocols in Consumer Electronics | +1.8% | Global, concentrated in Asia Pacific and North America | Short term (≤ 2 years) |
| Electrification of Industrial Automation Equipment | +1.5% | Europe and Asia Pacific, spillover to North America | Medium term (2-4 years) |
| Adoption of Wide-Bandgap Semiconductors in Power Conversion | +1.6% | Global, led by North America and Europe | Medium term (2-4 years) |
| Surge in Data Center Investment and Edge Computing Nodes | +1.4% | North America and Middle East, expanding to Asia Pacific | Short term (≤ 2 years) |
| Stricter Energy Efficiency Mandates for External Power Supplies | +1.2% | North America and Europe, cascading to Asia Pacific | Long term (≥ 4 years) |
| Growth in Off-Grid Renewable Energy Storage Systems | +1.0% | Middle East and Africa, India, Latin America | Long term (≥ 4 years) |
| Source: Mordor Intelligence | |||
Proliferation of Fast-Charging Protocols in Consumer Electronics
USB Power Delivery 3.1 Extended Power Range, ratified in 2024, enables up to 240 watts over a single cable, eliminating the need for proprietary laptop bricks and reducing the bill-of-materials cost for gallium nitride chargers.[1]USB Implementers Forum, “USB Power Delivery Specification Revision 3.1,” usb.org Smartphone accessory penetration of gallium nitride devices increased from below 15% in 2023 to more than 30% by late 2024, as brands bundled compact 65-watt adapters. Qi2 magnetic alignment added 25-watt wireless charging for phones and 15-watt charging for wearables, yet uptake lags due to legacy Qi 1.3 receivers. Faster charging stresses lithium-ion cells, prompting battery management systems to adopt precision DC-DC converters with sub-1% load regulation. Collectively, these dynamics lift average selling prices, fuel differentiation, and reinforce momentum in the Power Supply and Charger market.
Electrification of Industrial Automation Equipment
Manufacturers replacing pneumatics and hydraulics with electric servo drives now specify 48-volt and 400-volt rails, elevating kilowatt-scale demand for regulated power.[2]International Electrotechnical Commission, “IEC 61131-2:2024,” iec.ch IEC 61131-2 tightened immunity thresholds in 2024, driving the addition of filtering components that raise unit costs yet ensure compliance in automotive and semiconductor fabrication lines. Collaborative robots and autonomous mobile robots require peak-to-average ratios above 5:1, favoring modular DC-DC converters for dynamic load profiles. Edge computing nodes embedded on factory floors underscore the need for ruggedized adapters that are approved for wide temperature and shock ranges. These requirements expand addressable revenue pools within Europe and the Asia Pacific during the medium term.
Adoption of Wide-Bandgap Semiconductors in Power Conversion
Gallium nitride and silicon carbide switches operate above 500 kilohertz, shrinking passive component footprints by up to 60% and improving efficiency by as much as 4% across the load curve. Data centers transitioned to 48-volt rack distribution in 2024 to support GPU clusters, which draw 1,000 watts per accelerator, relying on gallium nitride to sustain the required power density. Electric vehicle chargers have been upgraded to 11 kilowatt and 22 kilowatt silicon carbide modules, reducing Level 2 charging times from eight hours to under three hours and enabling bidirectional energy flow. Updated U.S. Department of Energy procedures that cap no-load consumption at 0.1 watts effectively encourage the adoption of wide-bandgap chargers. As a result, suppliers capable of integrating these materials gain pricing power and accelerate revenue growth in the Power Supply and Charger market.
Surge in Data Center Investment and Edge Computing Nodes
Hyperscale operators have earmarked more than USD 200 billion for capacity expansions in 2024, allocating significant funds to AI training clusters that require 96% efficiency at half-load to minimize cooling overhead.[3]IEEE, “IEEE 519-2024 Recommended Practice for Harmonic Control,” ieee.org Edge computing sites are proliferating to support latency-sensitive applications, yet grid conditioning at remote locations remains inconsistent, forcing power supplies to tolerate wider voltage swings and harmonic distortion. Open RAN infrastructure requires modular, hot-swap power systems with N+1 redundancy, a configuration that favors DIN-rail or board-mounted DC-DC converters. Middle East sovereign funds pledge USD 50 billion through 2030 for data center projects in high-temperature climates, driving demand for rectifiers and uninterruptible power systems designed to operate in ambient heat above 45 degrees Celsius. Together, these trends add urgency and scale to high-power design cycles across the Power Supply and Charger market.
Restraints Impact Analysis*
| Restraint | (~) % Impact on CAGR Forecast | Geographic Relevance | Impact Timeline |
|---|---|---|---|
| Volatility in Raw Material Prices for Magnetic Components | -0.8% | Global, acute in Asia Pacific manufacturing hubs | Short term (≤ 2 years) |
| Design Complexity of High-Density Power Architectures | -0.6% | North America and Europe, affecting premium segments | Medium term (2-4 years) |
| Regulatory Delays in Standardizing Wireless Charging Interoperability | -0.5% | Global, concentrated in consumer electronics | Medium term (2-4 years) |
| Competitive Price Pressure from Low-Cost Asian Manufacturers | -0.7% | Global, most severe in commodity segments | Short term (≤ 2 years) |
| Source: Mordor Intelligence | |||
Volatility in Raw Material Prices for Magnetic Components
London Metal Exchange copper prices oscillated between USD 8,200 and USD 10,400 per metric ton in 2024, eroding margins for suppliers without hedging programs. Ferrite core costs rose 18%–25% as Chinese producers consolidated capacity, compelling European and North American vendors to qualify alternative materials that offer lower saturation flux and higher losses. Designers have migrated to planar magnetics and printed circuit board-embedded inductors, which cut copper content by up to 40%. However, these approaches lengthen development cycles and require new tooling. Customers built larger inventories to mitigate price shocks, tying up working capital and increasing carrying costs. Margin volatility, therefore, constrains near-term growth and influences procurement strategy within the Power Supply and Charger market.
Design Complexity of High-Density Power Architectures
Achieving power densities exceeding 30 watts per cubic inch while meeting CISPR 32 Class B emissions requirements of below 40 dBµV/m at 30 MHz necessitates multilayer boards with controlled impedance and precise component placement. Thermal management for gallium nitride stages operating near 150 degrees Celsius requires sophisticated modeling and expensive prototypes, which can pressure budgets at smaller vendors. Medical-grade isolation, as per IEC 60601-1, requires a 4,000-volt AC withstand capability, which limits layout density and extends qualification time. Digital control loops add firmware development and cybersecurity overhead, while automotive ISO 26262 and industrial IEC 61508 certifications require extensive documentation. These complexities delay time to revenue and raise barriers to entry.
*Our forecasts treat driver/restraint impacts as directional, not additive. The impact forecasts reflect baseline growth, mix effects, and variable interactions.
Segment Analysis
By Product Type: DC-DC Converters Extend Reach in Distributed Architectures
AC-DC units held 39.27% of 2024 revenue, underpinned by their role in isolating industrial equipment and telecom racks from mains electricity. In that year, the segment accounted for the largest slice of the Power Supply and Charger market size. These supplies exceed 200,000 hours mean time between failures, which justifies premium pricing in factory automation and base station deployments. DC-DC converters, however, are poised to expand at a 9.83% CAGR as hyperscale data centers adopt intermediate bus topologies and electric vehicles integrate 48-volt and 400-volt rails. Chargers that support USB-C Power Delivery above 65 watts spur growth on the consumer flank, although regulatory efficiency targets slim margins for low-power wall adapters.
Growth momentum favors DC-DC modules leveraging gallium nitride, which achieve 95% full-load efficiency, thereby trimming cooling costs and unlocking higher rack density. The European Union’s 2025 Ecodesign Tier 2 mandate tightens idle power limits, encouraging external adapters to adopt synchronous rectification. Wireless chargers adopting Qi 2 magnetic alignment are entering automotive cabins and furniture, while legacy devices continue to cap volume in the near term. These cross-currents reshape product mix yet reinforce a sizeable opportunity set across the broader Power Supply and Charger market.


By Power Rating: High-Power Units Benefit from EV and AI Demand
Medium-power devices, ranging from 100 watts to 1,000 watts, accounted for 45.89% of the 2024 Power Supply and Charger market share, serving notebooks, routers, and small industrial loads. High-power supplies exceeding 1,000 watts are projected to grow at a 9.17% CAGR through 2030, as electric vehicles require 22-kilowatt onboard chargers and data center racks adopt 3,000-watt redundant units. Low-power adapters, those below 100 watts, remain volume leaders yet face price pressure due to the standardization of the USB-C standard.
Liquid-cooled AI servers increase unit ratings and boost average selling prices. Off-grid solar systems in the Middle East and Africa require 5-kilowatt to 10-kilowatt inverters with bidirectional capability for battery storage, thereby broadening the high-power addressable market. Telecommunications carriers expanded the power budgets of remote radio units to 400 watts for massive MIMO, doubling the thermal load in outdoor enclosures. Compliance with IEC 62368-1 hazard-based safety engineering incurs additional costs for all power classes, yet disproportionately burdens commodity, low-power supplies, tilting the profit pools toward medium and high tiers within the Power Supply and Charger market.
By Mounting Type: Open-Frame Designs Secure OEM Integration Wins
Enclosed supplies captured 33.19% of 2024 revenue owing to ingress protection up to IP67 and integrated electromagnetic shielding. Open-frame units are expected to advance at a 9.89% CAGR as consumer electronics and automotive platforms adopt board-level integration to reduce weight and costs. DIN-rail devices serve as Industry 4.0 retrofits, while external and wall-plug adapters dominate the smartphone accessories market despite commoditization.
Automotive zonal architectures feature open-frame converters qualified for operation from −40 degrees Celsius to 125 degrees Celsius, meeting ISO 16750-3 vibration metrics. Medical devices specify enclosed models that deliver two means of patient protection and leakage below 100 microamperes. Industrial OEMs value DIN-rail supplies for their tool-free hot swap capabilities, paying premiums of 20%–30% for added redundancy. The spread of USB-C in laptops and monitors fuels the development of compact external bricks exceeding 100 watts, where gallium nitride reduces volume relative to legacy silicon while enhancing margins in the Power Supply and Charger market.
By Application: Automotive Electrification Outpaces Legacy Segments
Consumer electronics produced 33.76% of 2024 revenue, yet growth moderates as handset replacement cycles lengthen. Automotive applications are expected to rise at a 10.13% CAGR, driven by electric vehicles that captured 18% of light-vehicle sales in 2024 and require redundant 11-kilowatt and 22-kilowatt chargers. Industrial automation remains resilient due to its ruggedized requirements and lengthy qualification cycles. Medical equipment demands IEC 60601-1 compliance, creating a defensible niche with gross margins above 40%. Telecommunications infrastructure requires carrier-grade reliability with a mean time between failures exceeding 500,000 hours.
Regulators now propose mandatory advanced driver assistance functions by 2029, forcing vehicle OEMs to install backup power for safety-critical sensors. Collaborative robots require peak-to-average ratios of above 5:1, while portable medical devices are shifting toward integrated battery charging circuits to reduce size and weight. Open RAN rollouts specify software-defined power modules for remote monitoring. Collectively, these factors reallocate capital toward transportation and industrial verticals, diversifying revenue across the Power Supply and Charger market.
Geography Analysis
The Asia Pacific region produced 49.68% of 2024 revenue, as China maintained its manufacturing leadership and India attracted USD 2.5 billion in electronics investments under production-linked incentives. Regional suppliers benefit from the advantages of scale and proximity to component ecosystems, which enable them to maintain shorter lead times and more competitive cost structures. Policy makers also ratchet local efficiency and safety requirements, raising compliance thresholds and adding value for certified vendors.
The Middle East is the fastest-growing region, with a 9.91% CAGR through 2030. Sovereign wealth funds earmarked more than USD 50 billion for data centers and renewable energy, creating demand for high-power rectifiers and bidirectional inverters capable of operating in ambient temperatures above 45 degrees Celsius. Energy regulators in Saudi Arabia and the United Arab Emirates have introduced standards that limit the no-load draw to 0.3 watts and mandate an active efficiency of above 87%, aligning with global best practices and elevating technical barriers for importers.
North America benefits from nearshoring and the CHIPS and Science Act, which allocates USD 52 billion for semiconductor fabs requiring ultra-clean power with millivolt ripple. Europe emphasizes circular economy principles and will enforce the Ecodesign Tier 2 thresholds in 2025, boosting adoption of synchronous rectification and burst-mode control. South America scales solar and wind capacity, relying on power electronics to interconnect distributed generation and battery storage. These diverse regional programs collectively sustain demand and shape specification roadmaps within the Power Supply and Charger market.

Competitive Landscape
Market concentration remains moderate, with the top ten suppliers holding roughly 45%–50% of global revenue. Taiwanese leaders, such as Delta Electronics, Lite-On, and Mean Well, leverage the vertical integration of magnetics and semiconductor packaging to undercut their peers by 10%–15% in commodity segments. Chinese vendors, including FSP Technology and Shenzhen Megmeet, extend their reach beyond original design manufacturing to launch branded products, competing on lead times and customization flexibility. Japanese incumbents TDK Lambda, Murata, and Cosel dominate high-reliability medical and aerospace segments where decades of field data reinforce switching costs. European specialists such as Traco Electronic cater to DIN-rail and open-frame niches with extended temperature and hazardous-location ratings.
Strategic focus shifts toward wide-bandgap integration. Several firms introduced gallium nitride chargers with power densities exceeding 30 watts per cubic inch in 2024, enabling 65-watt smartphone adapters that are slimmer than older 45-watt silicon models. Vicor disrupts incumbents with factorized architectures, achieving 98% efficiency that reduces cooling overhead by up to 40%. Opportunities emerge in bidirectional vehicle-to-grid supplies, although regulatory ambiguity slows mass commercialization. IEEE has extended Power over Ethernet to 90 watts per port, creating new demand for isolated DC-DC converters that align with networking applications. Collectively, these moves redefine competitive positions while reinforcing the technology intensity of the Power Supply and Charger market.
Power Supply And Charger Industry Leaders
Delta Electronics Inc.
Lite-On Technology Corporation
TDK Lambda Corporation
Murata Manufacturing Co., Ltd.
Mean Well Enterprises Co., Ltd.
- *Disclaimer: Major Players sorted in no particular order

Recent Industry Developments
- April 2025: XP Power opened a USD 50 million gallium nitride research hub in Singapore to accelerate development of high-density power modules, targeting commercial production in early 2026 for AI and edge computing applications.
- March 2025: Delta Electronics committed USD 180 million to expand its Taoyuan, Taiwan facility by 200,000 square feet, adding gallium nitride charger capacity for electric vehicle and data center clients with shipments slated for Q4 2025.
- February 2025: Murata Manufacturing finalized the EUR 120 million (USD 128 million) purchase of a European power supply specialist, securing DIN-rail product lines and a broad industrial automation customer base.
- January 2025: Vicor Corporation released a 48-volt-to-1-volt DC-DC converter module delivering 98% efficiency and 2,000 watts per cubic inch, aimed at AI server racks that struggle with thermal limits.


Global Power Supply And Charger Market Report Scope
The Power Supply and Charger Market Report is Segmented by Product Type (AC-DC Power Supply Units, DC-DC Converters, Chargers, Power Adapters, Other Product Type), Power Rating (Low Power, Medium Power, High Power), Mounting Type (Open Frame, Enclosed, DIN Rail, External/Desktop, Wall Plug), Application (Consumer Electronics, Industrial Equipment, Medical Devices, Automotive, Telecommunications, Other Application), and Geography (North America, Europe, Asia Pacific, Middle East and Africa, South America). The Market Forecasts are Provided in Terms of Value (USD).
| AC-DC Power Supply Units |
| DC-DC Converters |
| Chargers |
| Power Adapters |
| Other Product Type |
| Low Power (Below 100 W) |
| Medium Power (100–1000 W) |
| High Power (Above 1000 W) |
| Open Frame |
| Enclosed |
| DIN Rail |
| External/Desktop |
| Wall Plug |
| Consumer Electronics |
| Industrial Equipment |
| Medical Devices |
| Automotive |
| Telecommunications |
| Other Application |
| North America | United States | |
| Canada | ||
| Mexico | ||
| Europe | Germany | |
| United Kingdom | ||
| France | ||
| Russia | ||
| Rest of Europe | ||
| Asia-Pacific | China | |
| Japan | ||
| India | ||
| South Korea | ||
| Australia | ||
| Rest of Asia-Pacific | ||
| Middle East and Africa | Middle East | Saudi Arabia |
| United Arab Emirates | ||
| Rest of Middle East | ||
| Africa | South Africa | |
| Egypt | ||
| Rest of Africa | ||
| South America | Brazil | |
| Argentina | ||
| Rest of South America | ||
| By Product Type | AC-DC Power Supply Units | ||
| DC-DC Converters | |||
| Chargers | |||
| Power Adapters | |||
| Other Product Type | |||
| By Power Rating | Low Power (Below 100 W) | ||
| Medium Power (100–1000 W) | |||
| High Power (Above 1000 W) | |||
| By Mounting Type | Open Frame | ||
| Enclosed | |||
| DIN Rail | |||
| External/Desktop | |||
| Wall Plug | |||
| By Application | Consumer Electronics | ||
| Industrial Equipment | |||
| Medical Devices | |||
| Automotive | |||
| Telecommunications | |||
| Other Application | |||
| By Geography | North America | United States | |
| Canada | |||
| Mexico | |||
| Europe | Germany | ||
| United Kingdom | |||
| France | |||
| Russia | |||
| Rest of Europe | |||
| Asia-Pacific | China | ||
| Japan | |||
| India | |||
| South Korea | |||
| Australia | |||
| Rest of Asia-Pacific | |||
| Middle East and Africa | Middle East | Saudi Arabia | |
| United Arab Emirates | |||
| Rest of Middle East | |||
| Africa | South Africa | ||
| Egypt | |||
| Rest of Africa | |||
| South America | Brazil | ||
| Argentina | |||
| Rest of South America | |||


Key Questions Answered in the Report
How large is the Power Supply and Charger market in 2025?
The market stands at USD 24.28 billion in 2025 and is forecast to reach USD 37.07 billion by 2030.
Which segment is expanding fastest by power rating?
High-power units above 1,000 watts show the strongest outlook, growing at a 9.17% CAGR through 2030.
What drives automotive demand for power supplies?
Electric vehicles require 11 kilowatt and 22 kilowatt onboard chargers and redundant power for advanced driver assistance systems, propelling a 10.13% CAGR.
Why is Asia Pacific the largest regional market?
China’s manufacturing scale and India’s incentive schemes anchor 49.68% of 2024 revenue, ensuring regional leadership.
How are wide-bandgap semiconductors changing design priorities?
Gallium nitride and silicon carbide switches improve efficiency by up to 4% and shrink passive components, enabling higher power density in chargers and converters.
What impact do new energy efficiency mandates have?
Tier 2 Ecodesign rules require external power supplies to limit no-load draw to 0.1 watts, pushing suppliers toward synchronous rectification and wide-bandgap devices.
Page last updated on:


