Poland Global Capability Centers Market Size and Share
Market Overview
| Study Period | 2020 - 2031 |
|---|---|
| Forecast Data Period | 2026 - 2031 |
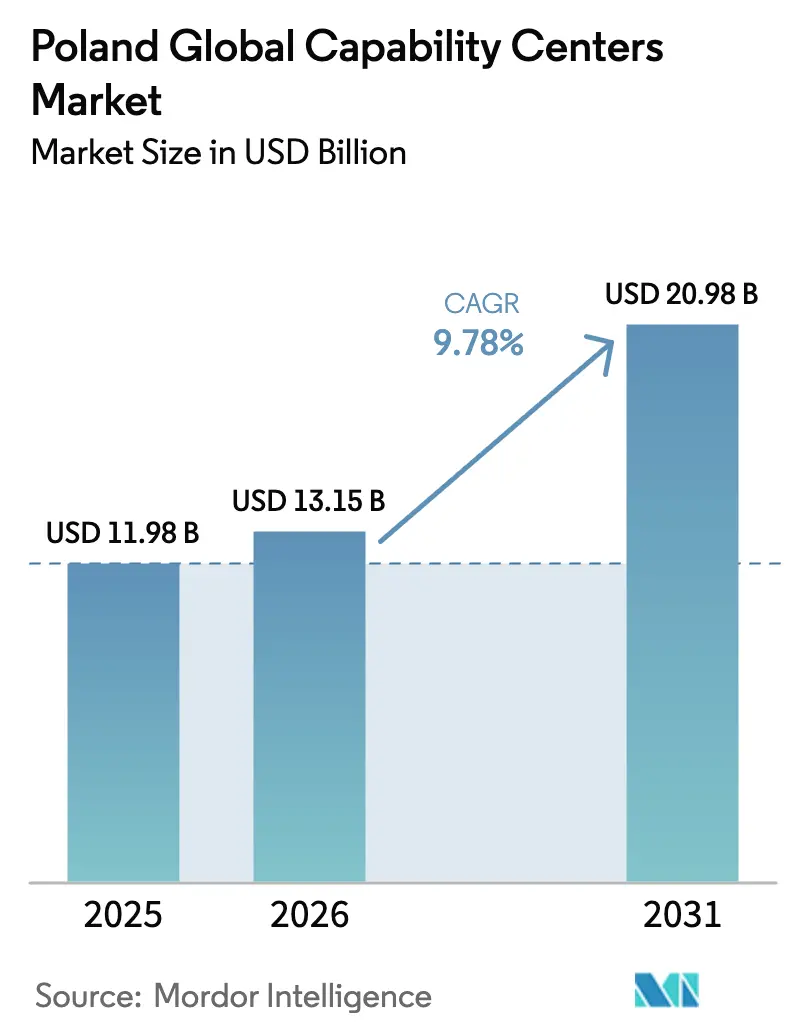
| Base Year Market Size (2025) | USD 11.98 Billion |
| Market Size (2026) | USD 13.15 Billion |
| Market Size (2031) | USD 20.98 Billion |
| Growth Rate (2026 - 2031) | 9.78% CAGR |
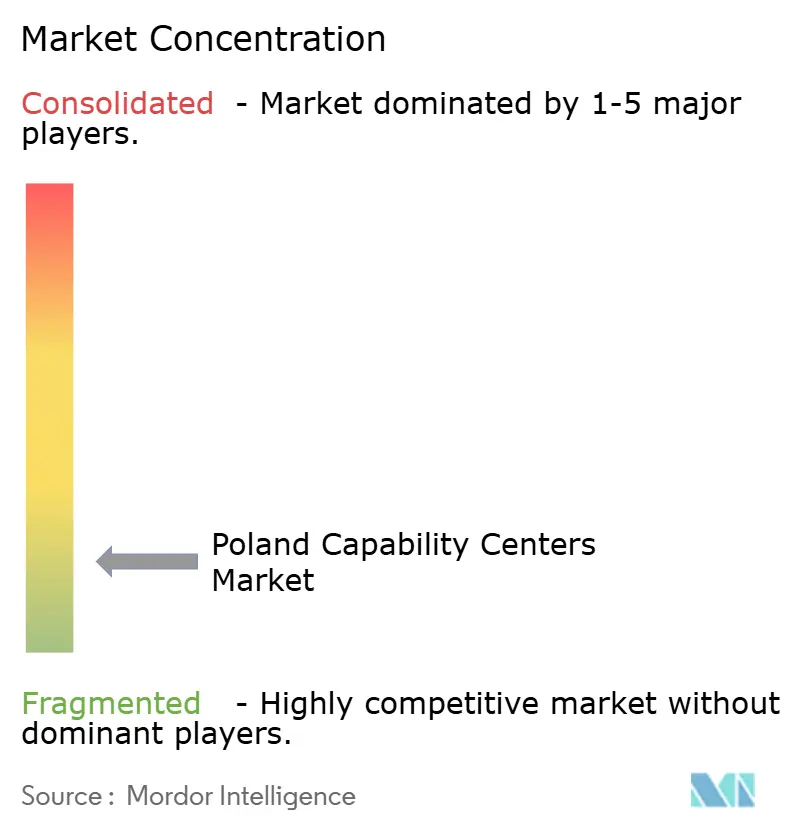
| Market Concentration | Low |
Major Players *Disclaimer: Major Players sorted in no particular order Image © Mordor Intelligence. Reuse requires attribution under CC BY 4.0. | |
Poland Global Capability Centers Market Analysis by Mordor Intelligence
The Poland Global Capability Centers market size is expected to grow from USD 11.98 billion in 2025 to USD 13.15 billion in 2026 and is forecast to reach USD 20.98 billion by 2031 at 9.78% CAGR over 2026-2031. This trajectory highlights the transformation of the Poland Global Capability Centers market from a cost-arbitrage back-office destination to a strategic European services hub. Growth is supported by Microsoft’s PLN 3 billion (USD 700 million) data center investment, a deep pool of science, technology, engineering, and mathematics graduates, and regulatory certainty within the European Union.[1]Chancellery of the Prime Minister, “Microsoft Invests PLN 3 Billion in a New Data Center in Poland,” GOV.PL Post-Brexit nearshoring, accelerating automotive electrification, and policy-backed research incentives further solidify Poland's Global Capability Centers market as Central Europe’s most dynamic location for capability centers. The functional mix is shifting toward information technology and digital engineering, while demand from small and medium enterprises widens the customer base, helping the Poland Global Capability Centers market sustain double-digit growth.
Key Report Takeaways
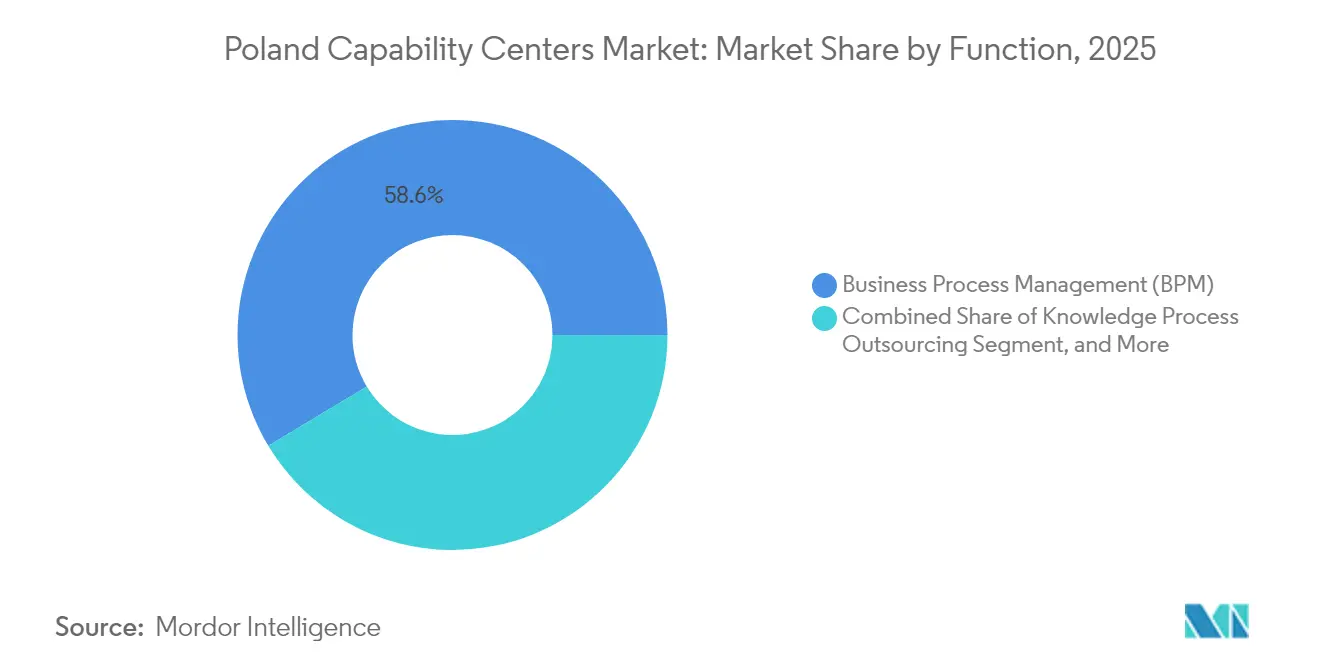
- By function, business process management led with 58.62% of Poland's Global Capability Centers market share in 2025, while information technology and digital services are projected to post a 9.96% CAGR through 2031.
- By engagement model, captive centers accounted for 60.69% of the Poland Global Capability Centers market size in 2025, while hybrid build-operate-transfer formats are forecast to expand at a 9.93% CAGR to 2031.
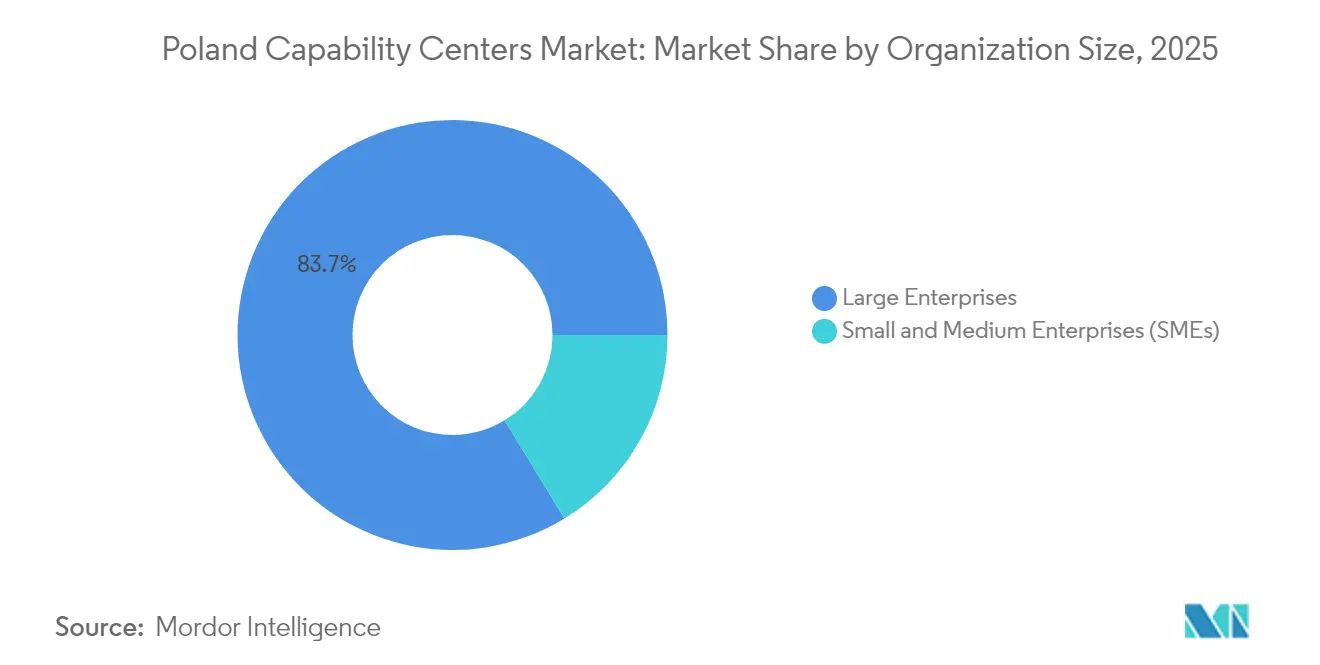
- By organization size, large enterprises captured 83.72% of the Poland Global Capability Centers market size in 2025, while small and medium enterprises are expected to advance at a 10.89% CAGR to 2031.
- By industry vertical, banking, financial services, and insurance commanded 32.27% revenue share of the Poland Global Capability Centers market in 2025, whereas manufacturing, automotive, and industrial operations are set to rise at a 10.25% CAGR through 2031.
Note: Market size and forecast figures in this report are generated using Mordor Intelligence’s proprietary estimation framework, updated with the latest available data and insights as of 2026.
Poland Global Capability Centers Market Trends and Insights
Drivers Impact Analysis*
| Driver | (~) % Impact on CAGR Forecast | Geographic Relevance | Impact Timeline |
|---|---|---|---|
| Cost-Effective Skilled STEM Talent Pool | +2.1% | National, concentrated in Warsaw, Krakow, Wroclaw | Long term (≥ 4 years) |
| Expansion of EU Nearshoring Demand Post-Brexit | +1.8% | EU-wide, primary impact in Poland | Medium term (2-4 years) |
| Growing Digital Engineering Focus of Western OEMs | +1.5% | National, strongest in automotive clusters | Medium term (2-4 years) |
| Polish Government's R&D Tax Relief Expansion | +1.2% | National | Short term (≤ 2 years) |
| Supply-Side Consolidation Toward Centers of Excellence | +0.9% | Tier-1 cities, spillover to Tier-2 | Long term (≥ 4 years) |
| National AI Strategy Funding for Corporate Labs | +0.8% | National, concentrated in tech hubs | Medium term (2-4 years) |
| Source: Mordor Intelligence | |||
Cost-Effective Skilled STEM Talent Pool
Roughly 500,000 graduates complete tertiary education each year, and 39% of adults aged 25-34 hold university degrees, forming the backbone of the Poland Global Capability Centers market.[2]Cushman and Wakefield, “Where in the World - BPO and Shared Service Location Index 2,” cushmanwakefield.com Mid-level information technology professionals earn PLN 17,000-23,000 (USD 4,250-5,750) per month, a discount to Western European peers while maintaining quality. Universities such as the Krakow University of Economics have introduced dedicated global business services programs that attracted nearly five applications per seat in 2024. These academic initiatives expand the skilled pool, enabling centers to handle mid-office banking processes and advanced analytics. Talent availability, combined with cultural proximity to Western Europe, supports long-run scalability of the Poland Global Capability Centers market.
Expansion of EU Nearshoring Demand Post-Brexit
Brexit altered sourcing strategies, driving regulated industries to maintain European Union market access by scaling Polish operations. Goldman Sachs and other banks expanded their headcount in Warsaw, while the European Investment Bank established a digital hub in 2024. Poland’s GDPR alignment and single-market passporting remove cross-border compliance risk, factors that Asian outsourcing hubs cannot replicate. Time-zone congruence and language familiarity further reinforce Poland’s nearshore edge. These structural benefits are expected to sustain EU-centric client inflows into the Poland Global Capability Centers market over the medium term.
Growing Digital Engineering Focus of Western OEMs
Automotive and industrial manufacturers are increasingly establishing engineering centers in Poland to accelerate the adoption of electrification and digitalization. Volvo leased a 10,000 square-meter technology hub in Krakow Brain Park, and Compal Electronics set up advanced driver-assistance systems production in Silesia.[3]CTP, “CTP launches 16th industrial and logistics park in the country,” ctp.eu Poland’s status as Europe’s largest vehicle producer creates domain depth in embedded software and electronics unavailable in many traditional business-process locations. Engineering mandates deliver higher value per employee and deepen client stickiness, thereby boosting the resilience of the Poland Global Capability Centers market.
Polish Government R&D Tax Relief Expansion
To offset impending minimum-tax rules, the government initiated consultations in 2025 aimed at preserving the 100-200% deduction on qualifying research expenses, complementing a 5% intellectual property box regime. An additional EUR 1.114 billion (USD 1.26 billion) from the EU Recovery and Resilience Plan funds research infrastructure, co-financing laboratories that multinational capability centers can leverage. These fiscal levers keep Poland cost-competitive even as wage inflation accelerates, supporting the sustained expansion of the Poland Global Capability Centers market.
Restraints Impact Analysis*
| Restraint | (~) % Impact on CAGR Forecast | Geographic Relevance | Impact Timeline |
|---|---|---|---|
| Intensifying Wage Inflation in Tier-1 Cities | -1.4% | Warsaw, Krakow, Wroclaw | Short term (≤ 2 years) |
| Competition from Romania and the Baltics for New Global Capability Centers Mandates | -0.8% | Regional CEE competition | Medium term (2-4 years) |
| Persistent Regulatory Uncertainty Around Digital Nomad Contracts | -0.5% | National, EU-wide implications | Medium term (2-4 years) |
| Limited Senior-Level Product Management Talent | -0.6% | National, concentrated in tech hubs | Long term (≥ 4 years) |
| Source: Mordor Intelligence | |||
Intensifying Wage Inflation in Tier-1 Cities
Average monthly gross wages in major capability-center cities increased to PLN 15,127 (USD 3,782) in 2024, representing an 8% year-over-year gain.[4]Hays Poland, “Hays Poland Salary Guide 2025,” hays.pl Unemployment sits at 2.7% while 86% of employers plan to hire in 2025, pushing salaries up and tightening vacancy periods. Executive total-cost packages exceed EUR 224,138, and professional pay averages EUR 37,469, the highest jump among Central and Southeast European peers. Rising office rents in Warsaw and Krakow compound the pressure, risking erosion of short-run cost advantages in the Poland Global Capability Centers market.
Competition from Romania and the Baltics for New Global Capability Centers Mandates
Romania hosts 280 service centers that employ 131,000 professionals, while the Baltic states offer lower labor expenses and a strong digital infrastructure. Estonia’s e-governance capabilities and Latvia’s niche financial-services talent attract functions once earmarked for Poland. While Poland retains ecosystem scale with 1,510 centers and 338,000 staff, fresh mandates may consider emerging alternatives unless Poland moves up the value chain. Continuous productivity gains and automation will be essential to preserve Poland's Global Capability Centers market momentum amid regional rivalry.
*Our forecasts treat driver/restraint impacts as directional, not additive. The impact forecasts reflect baseline growth, mix effects, and variable interactions.
Segment Analysis
By Function / Capability: BPM Leadership Faces Digital Disruption
Business process management contributed 58.62% of Poland's Global Capability Centers market revenue in 2025, yet it confronts digital-automation headwinds. Information technology and digital services should log a 9.96% CAGR to 2031, reflecting client demand for cloud platforms and analytics. The Poland Global Capability Centers market size for engineering and research functions is widening as Western OEMs delegate complex development projects. Knowledge-process outsourcing attracts premium pricing but remains a niche market.
Shifts in work mix require continuous reskilling. TCS expanded its Warsaw development center to over 1,200 professionals, providing artificial-intelligence solutions to European customers. Centers are integrating low-code platforms, reducing manual effort and lifting margins. Poland’s EU jurisdiction eases compliance for banking data, helping knowledge-heavy tasks migrate from offshore sites. The pivot from transactional processes to insight-rich services underpins long-term diversification of the Poland Global Capability Centers market.


By Engagement Model: Hybrid Formats Gain Traction
Captive entities held 60.69% of the 2025 Poland Global Capability Centers market share due to their control of intellectual property and strategic alignment. Hybrid build-operate-transfer models are projected to compound at 9.93% through 2031, providing new entrants with the flexibility to trial Poland without full ownership. Pure build-operate-transfer arrangements remain viable for firms seeking asset-light expansion.
Hybrid success depends on local insight. Concentrix opened a permanent site in Katowice, adding 500 jobs, and showcasing how service providers can incubate and later transfer operations to clients. The arrangement aligns capital outlay with performance, aiding smaller firms entering the Poland Global Capability Centers market. Providers with deep in-country expertise and multicultural leadership gain an edge over remote offshore competitors.
By Organization Size: SME Adoption Accelerates
Large enterprises still account for 83.72% of 2025 revenue due to their procurement sophistication, but small and medium enterprises form the fastest-growing buyer pool, with a 10.89% CAGR. Cloud-native tools and subscription pricing reduce the minimum scale. Service chains now offer modular finance and human resources solutions tailored for companies with a revenue of less than USD 1 billion.
SMEs show agility in adopting automation and data analytics, often leapfrogging legacy systems. Providers craft shorter contracts and flexible seat-based pricing, democratizing entry into the Poland Global Capability Centers market. This broadening of demand lowers concentration risk and stabilizes revenue through economic cycles. Government grants for innovative SMEs complement the trend, reinforcing Poland’s knowledge economy.
By Industry Vertical: Manufacturing Momentum Builds
Banking, financial services, and insurance accounted for 32.27% of Poland's Global Capability Centers market revenue in 2025, driven primarily by regulatory outsourcing. Manufacturing, automotive, and industrial clients are expected to post a 10.25% CAGR to 2031, propelled by Industry 4.0 rollouts. As Europe accelerates the adoption of electrified transport, Poland’s production base aligns with digital engineering mandates.
Compal Electronics’ advanced driver-assistance module plant highlights this convergence. Engineering knowledge feeds back into support functions such as warranty analytics and supply-chain visibility. Healthcare and life sciences draw on harmonized EU rules, while telecommunications benefits from the nation’s 5G rollout. Vertical diversification enriches service portfolios and strengthens the foundation of the Poland Global Capability Centers market.
Geography Analysis
Poland’s central European geography enables same-day travel to major capitals and alignment with Western business hours, advantages that elevate the Poland Global Capability Centers market. Warsaw, the financial hub, recorded 301,400 square meters of office leases in the first half of 2025 and hosts companies such as Goldman Sachs, UBS, and the European Investment Bank's digital hub. The depth of financial talent and robust connectivity position the city for complex risk and compliance work.
Kraków remains the largest single capability center cluster, with 101,000 employees across 288 sites, accounting for 55% of the city's office take-up. The local university network supplies multilingual graduates, while a high quality of life draws expatriate staff. Wroclaw hosts 60,000 employees in 208 centers, aided by its technical universities and proximity to Germany. Office stock of 1.4 million square meters and rental bands of EUR 9-14.50 per square meter sustain cost competitiveness.
Tier-2 locales are expanding. Katowice houses 26,600 employees in 105 centers and leverages industrial heritage for engineering mandates. Rzeszów, supported by the new 49,600-square-meter CTPark, offers initial European footholds for mid-sized entrants. Microsoft’s hyperscale data-center campus near Warsaw signals trust in national digital infrastructure and underpins cloud workloads across the Poland Global Capability Centers market. Geographic diversification mitigates talent saturation risk in prime cities while providing clients with multiple delivery options.
Competitive Landscape
The Poland Global Capability Centers market comprises 1,510 service centers that employ 338,000 professionals, resulting in moderate fragmentation and intense competition. Accenture, IBM, and TCS exploit global scale but face competition from regionally specialized vendors and captive centers. Differentiation is migrating from wage arbitrage toward domain expertise, automation maturity, and cultural fluency.
Investment in artificial intelligence distinguishes leaders. TCS’s Warsaw site focuses on predictive analytics platforms for banking clients, while Accenture pilots generative-AI code-generation tools in Krakow. Captive operations in banking deploy proprietary data models under EU jurisdiction, creating barriers to relocation. Collaborations between EIB’s Warsaw hub and fintech scale-ups could disrupt traditional outsourcing lines, rewarding agile providers in the Poland Global Capability Centers market.
Regulatory alignment with the GDPR and the EU Digital Operational Resilience Act enhances Poland’s stance, especially compared to non-EU nearshores. Wage inflation and tight labor markets require automation to protect margins. Vendors with strong employer brands and university partnerships attract scarce talent, sustaining service quality despite rising costs.
Poland Global Capability Centers Industry Leaders
Accenture plc
IBM Corp.
Capgemini SE
Cognizant Technology Solutions Corporation
Tata Consultancy Services
- *Disclaimer: Major Players sorted in no particular order

Recent Industry Developments
- May 2025: Compal Electronics has switched on the first phase of its new plant in Czeladź, producing advanced driver-assistance and ECU modules for European carmakers. The site will reach full capacity between 2028 and 2029.
- March 2025: Concentrix opened a permanent office in Katowice’s Global Office Park, its fourth Polish city, adding more than 500 jobs and underscoring Poland’s draw for business-services investors.
- February 2025: Microsoft pledged PLN 3 billion (USD 700 million) to enlarge its Polish data-center region, with go-live slated for summer 2026. The expansion will meet local cloud demand and host Polish-language AI models, including Bielik and PLLuM.
- January 2025: Warsaw’s office market logged 301,400 square meters of leasing in H1 2025, driven largely by shared-service and BPO tenants, indicating the GCC sector’s continued growth in the capital.


Poland Global Capability Centers Market Report Scope
The scope of the global capability center study for the market segmentation by the Function/Capability for (i) Information Technology (IT) and Digital Services segment is limited to Software Development, Cloud and Infrastructure Management, Cybersecurity, Data Analytics and AI/ML; (ii) Engineering / ER&D segment is limited to Product Design and Testing, Embedded Systems, Digital Twin / Simulation; (iii) Business Process Management (BPM) segment is limited to Finance and Accounting, HR, Payroll and Talent Management, Procurement, Customer Service; and (iv)Knowledge Process Outsourcing (KPO) segment is limited to Market Research and Insights, Risk and Compliance, Legal and Regulatory Support, Strategy and Consulting Support. Similarly, for segmentation by the Engagement Model, scope for (i) Hybrid Build-Operate-Transfer (BOT) is limited to Joint Venture / Strategic Partnership and Virtual Captive Model. The rest of the segment scope is as specified for the listed segment.
| Information Technology (IT) and Digital Services |
| Engineering / ER&D |
| Business Process Management (BPM) |
| Knowledge Process Outsourcing (KPO) |
| Captive (Self-Build) / In-house |
| Build-Operate-Transfer (BOT) |
| Hybrid Build-Operate-Transfer (BOT) |
| Large Enterprises |
| Small and Medium Enterprises (SMEs) |
| Banking, Financial Services, and Insurance (BFSI) |
| Telecom and IT |
| Healthcare and Life Sciences |
| Manufacturing, Automotive and Industrial |
| Retail and Consumer Goods |
| Other Industry Verticals |
| By Function / Capability | Information Technology (IT) and Digital Services |
| Engineering / ER&D | |
| Business Process Management (BPM) | |
| Knowledge Process Outsourcing (KPO) | |
| By Engagement Model | Captive (Self-Build) / In-house |
| Build-Operate-Transfer (BOT) | |
| Hybrid Build-Operate-Transfer (BOT) | |
| By Organization Size | Large Enterprises |
| Small and Medium Enterprises (SMEs) | |
| By Industry Vertical | Banking, Financial Services, and Insurance (BFSI) |
| Telecom and IT | |
| Healthcare and Life Sciences | |
| Manufacturing, Automotive and Industrial | |
| Retail and Consumer Goods | |
| Other Industry Verticals |


Key Questions Answered in the Report
What is the expected value of the Poland Global Capability Centers market by 2031?
The Poland Global Capability Centers market is projected to reach USD 20.98 billion by 2031.
How fast is the Poland Global Capability Centers market growing?
The market is forecast to expand at a 9.78% CAGR between 2026 and 2031.
Which function is growing the fastest within Polish capability centers?
Information technology and digital services are set to post a 9.96% CAGR through 2031.
Why are Western manufacturers selecting Poland for engineering centers?
Poland combines deep automotive production expertise with a skilled engineering workforce, supporting initiatives for electrification and Industry 4.0.
What challenges could hinder the growth of the Poland Global Capability Centers market in the near future?
Rising wage inflation in Warsaw, Krakow, and Wroclaw, as well as competition from Romania and the Baltics, could temper short-term cost advantages.
Which engagement model is gaining momentum in Poland?
Hybrid build-operate-transfer structures are accelerating at a 9.93% CAGR as firms seek flexible entry options.
Page last updated on:


