PM2.5 Sensors Market Size and Share
Market Overview
| Study Period | 2019 - 2030 |
|---|---|
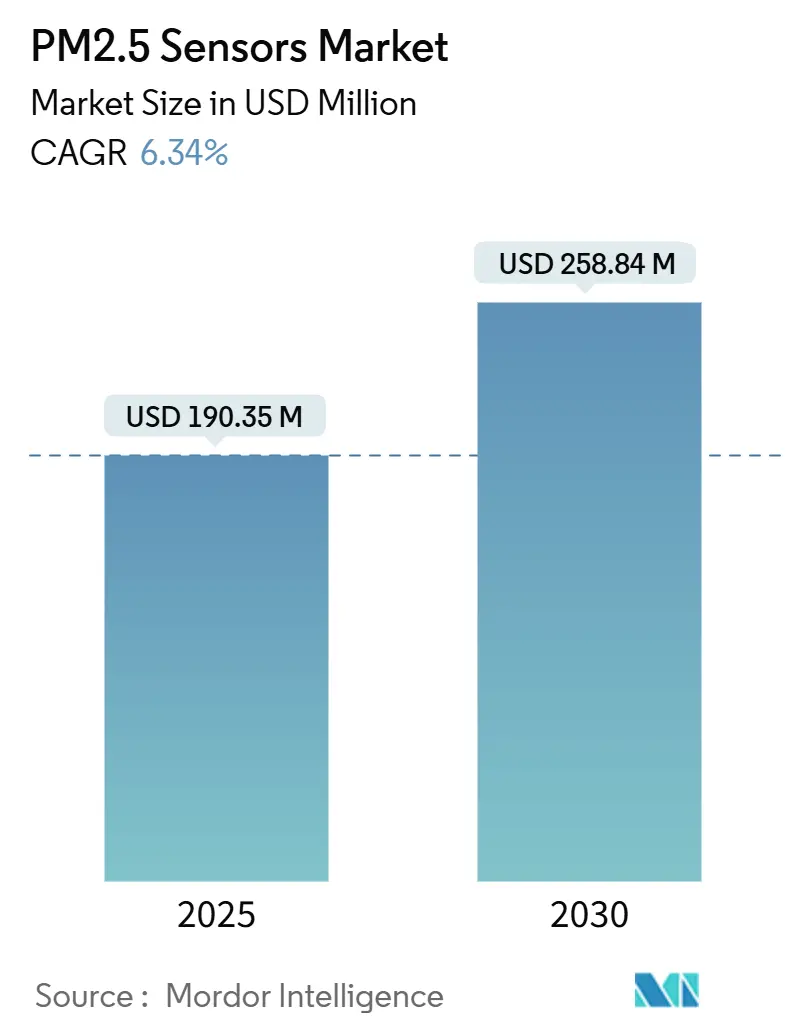
| Market Size (2025) | USD 190.35 Million |
| Market Size (2030) | USD 258.84 Million |
| Growth Rate (2025 - 2030) | 6.34% CAGR |
| Fastest Growing Market | Asia Pacific |
| Largest Market | North America |
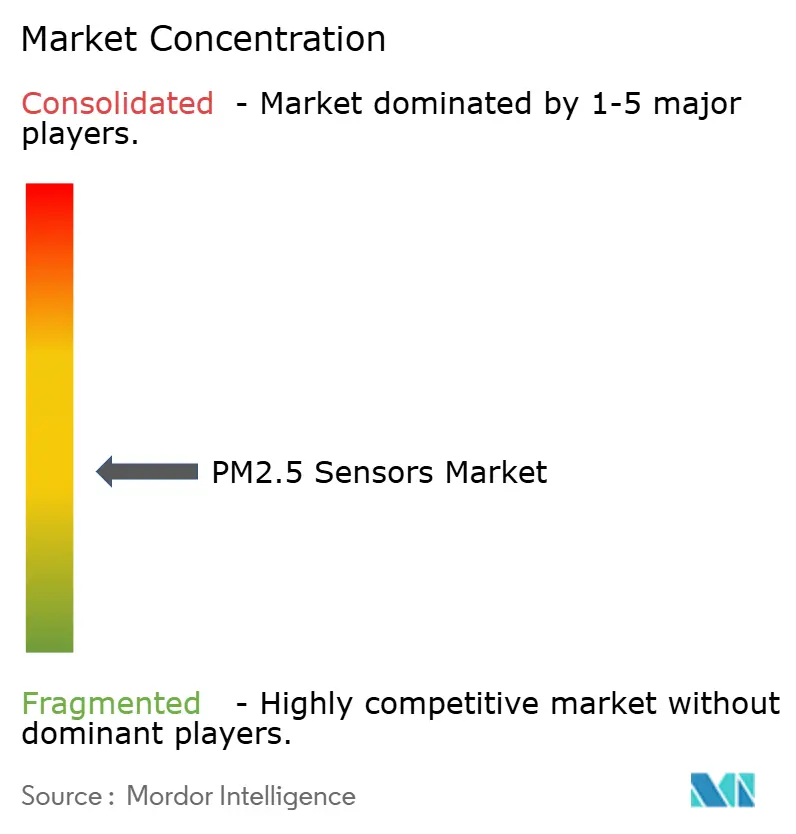
| Market Concentration | Medium |
Major Players *Disclaimer: Major Players sorted in no particular order Image © Mordor Intelligence. Reuse requires attribution under CC BY 4.0. | |
PM2.5 Sensors Market Analysis by Mordor Intelligence
The PM2.5 sensors market size stands at USD 190.35 million in 2025 and is forecast to reach USD 258.84 million by 2030, reflecting a 6.34% CAGR. Tightening global particulate-matter regulations, rapid sensor miniaturization, and growing adoption in automotive cabin-air systems are the primary growth catalysts. Building owners seek continuous indoor monitoring to meet WELL and RESET criteria, while industrial operators install round-the-clock networks to secure ESG-linked financing. Sensor makers differentiate through multi-parameter integration, cloud analytics, and documented calibration chains that satisfy ISO/IEC 17025 audit trails. North American subsidy programs and China’s new vehicle rules further accelerate deployments.
Key Report Takeaways
- By product type, optical laser-scattering solutions led with 46.83% of PM2.5 sensors market share in 2024, and hybrid and others are advancing at a 7.23% CAGR through 2030
- By technology, light-scattering (Mie) led with 53.74% of the PM2.5 sensors market, integrated gas-particle is projected to expand at a 7.55% CAGR through 2030.
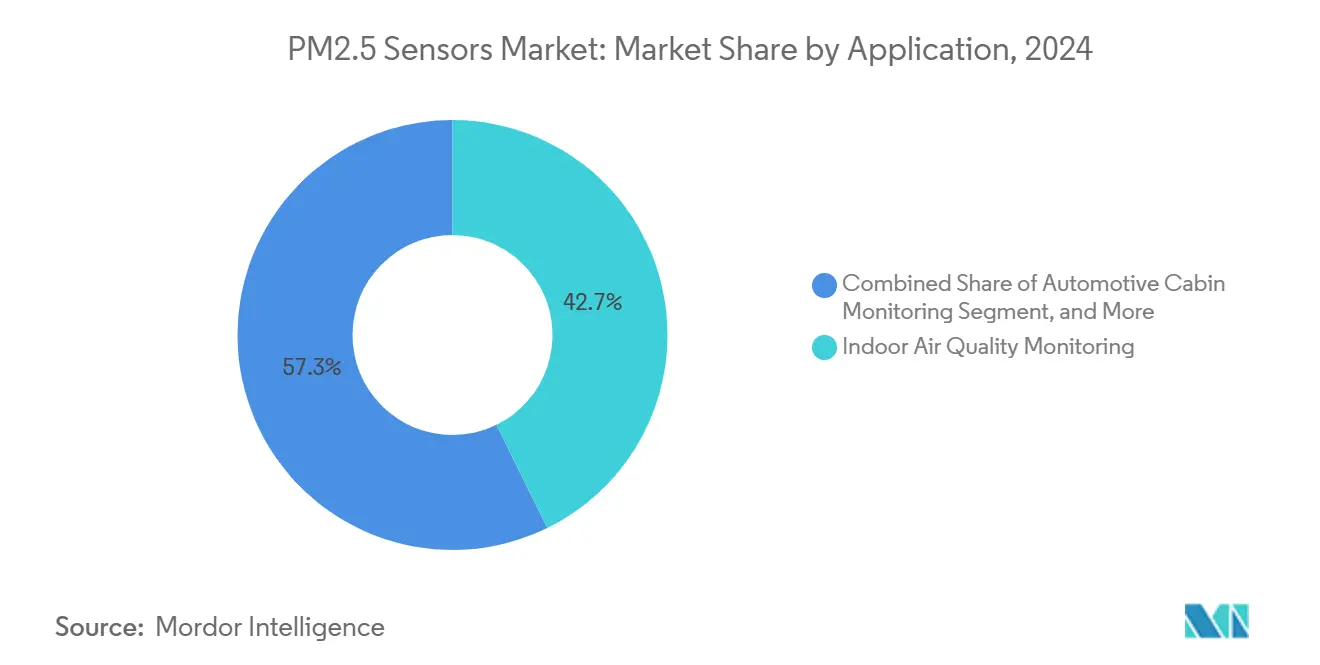
- By application, indoor monitoring commanded 42.74% of the PM2.5 sensors market size in 2024, wearables and smart appliances are advancing at a 7.18% CAGR through 2030.
- By end-user, residential and commercial buildings led with 38.63% of PM2.5 sensors market, and automotive OEMs and Tier-1 suppliers are advancing at a 7.22% CAGR through 2030.
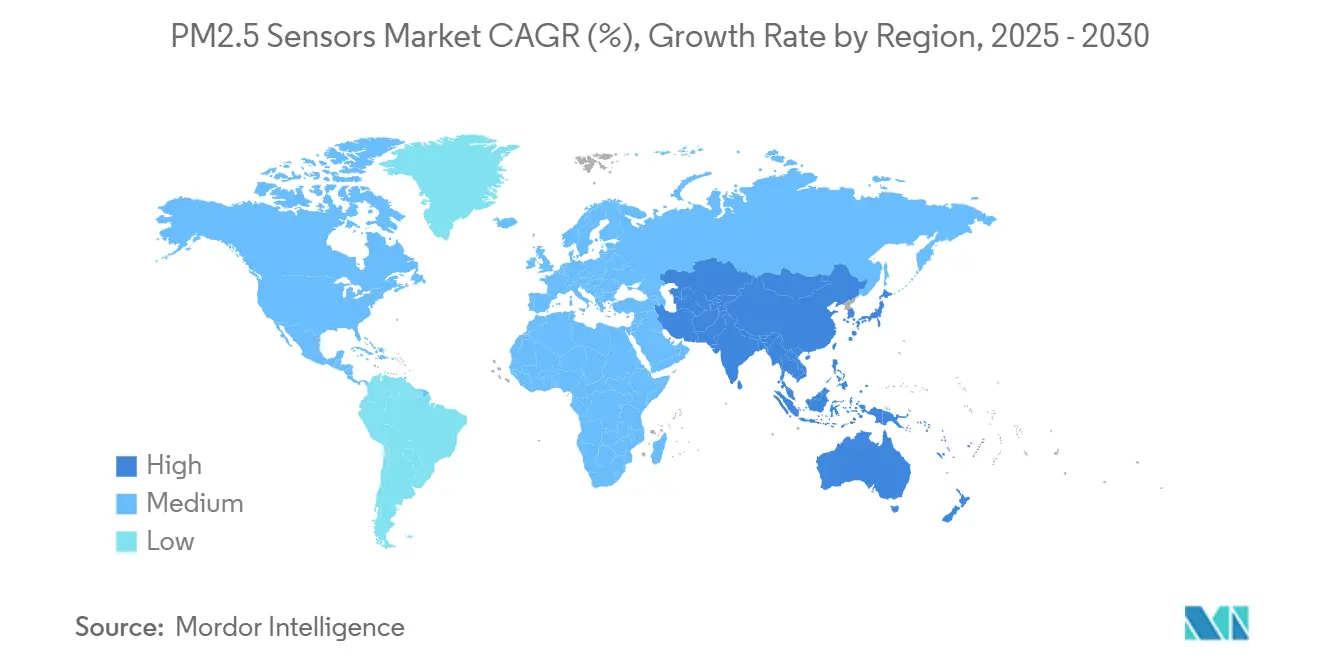
- By geography, North America led with 39.83% of PM2.5 sensors market, and Asia-Pacific is poised for the fastest 7.25% CAGR between 2025 and 2030.
Global PM2.5 Sensors Market Trends and Insights
Drivers Impact Analysis*
| Driver | (~) % Impact on CAGR Forecast | Geographic Relevance | Impact Timeline |
|---|---|---|---|
| Tightening WHO and national PM2.5 limits | +1.5% | Global, with early adoption in EU and North America | Medium term (2-4 years) |
| Subsidies for indoor air-quality sensors in public buildings | +0.8% | North America and EU, expanding to Asia-Pacific | Short term (≤ 2 years) |
| Shift toward smart HVAC/IAQ ecosystems | +1.2% | Global, led by commercial building sector | Medium term (2-4 years) |
| Automotive cabin-air regulations (Euro 7, China 7) | +0.9% | EU and China core, spillover to global automotive | Short term (≤ 2 years) |
| Emergence of low-cost IoT micro-laser arrays | +0.6% | Asia-Pacific manufacturing base, global deployment | Long term (≥ 4 years) |
| ESG-linked lending requiring plant-level PM reporting | +0.9% | Global, concentrated in industrial regions | Medium term (2-4 years) |
| Source: Mordor Intelligence | |||
Tightening WHO and National PM2.5 Limits
Updated WHO annual and 24-hour PM2.5 limits drive mandatory monitoring in offices, factories, and homes.[1]World Health Organization, “What Are the WHO Air Quality Guidelines,” WHO.INT RESET and WELL programs translate these limits into continuous-sensor requirements, nudging building operators toward certified devices with traceable calibration paths. Industrial permits now specify real-time particulate thresholds, replacing quarterly grab-samples. Compliance labs accredited under ISO/IEC 17025 prefer sensors that ship with full metrological documentation, shifting demand away from unvalidated low-cost units.[2]International Organization for Standardization, “ISO/IEC 17025:2017,” ISO.ORG The resulting pull-through effect enlarges the installed base across public and private spaces.
Subsidies for Indoor Air-Quality Sensors in Public Buildings
State-funded initiatives subsidize large volumes of PM2.5 sensors. California’s CalSHAPE scheme placed 5,000 devices in K-12 classrooms, triggering follow-on orders for maintenance contracts. Similar programs in the EU blend installation grants with multi-year service reimbursements, steering buyers toward proven suppliers able to guarantee long-term data accuracy. Domestic-content clauses, however, limit overseas entrants, reinforcing regional vendor advantages. These projects foster recurring revenue through calibration and software subscriptions embedded in tender requirements.
Shift Toward Smart HVAC/IAQ Ecosystems
Building-automation vendors integrate PM2.5 data into demand-controlled ventilation. Sensor inputs modulate fan speeds, optimizing indoor comfort while trimming energy spend. Open protocols such as BACnet and Modbus become baseline requirements, rewarding manufacturers fluent in industrial networking. Cloud platforms analyze multi-parameter data for predictive maintenance, offering new monetization layers beyond hardware. System integrators favor sensors bundled with APIs and analytics licenses, pushing the market toward holistic IAQ solutions rather than standalone probes.
Automotive Cabin-Air Regulations (Euro 7, China 7)
Euro 7 mandates particulate monitoring down to 10 nm, compelling automakers to embed PM2.5 and ultrafine particle sensors inside HVAC ducts. China 7 introduces comparable limits on local production volumes that dwarf European output, creating immediate scale demand. Sensirion and Bosch have secured design wins by adapting industrial-grade optics to automotive temperature and vibration profiles. Tier-1 suppliers lock in multi-year agreements, offering volume certainty for qualified sensor makers.
Restraints Impact Analysis*
| Restraint | (~) % Impact on CAGR Forecast | Geographic Relevance | Impact Timeline |
|---|---|---|---|
| Cross-sensitivity and accuracy drift in low-cost sensors | -0.7% | Global, particularly affecting consumer and wearable segments | Short term (≤ 2 years) |
| Price pressure from commoditization | -0.4% | Asia-Pacific manufacturing regions, global market impact | Medium term (2-4 years) |
| Lack of calibration standards for wearable form factors | -0.3% | Global, concentrated in consumer electronics | Long term (≥ 4 years) |
| Data-privacy hurdles for building-level IAQ analytics | -0.2% | EU and North America, GDPR compliance regions | Medium term (2-4 years) |
| Source: Mordor Intelligence | |||
Cross-Sensitivity and Accuracy Drift in Low-Cost Sensors
Field tests show humidity swings introduce above 50% error in uncalibrated optical modules, limiting suitability for compliance use.[3]U.S. Environmental Protection Agency, “Performance Testing Protocols for PM Sensors,” EPA.GOV VOC cross-talk further distorts readings in mixed-pollutant environments. Without robust self-calibration, sensor drift undermines long-term data reliability. Regulatory inspectors increasingly reject consumer-grade devices for permit reporting, curbing volume in price-sensitive segments until performance improves.
Price Pressure from Commoditization
Sub-USD 10 sensor modules from Shenzhen suppliers compress margins across the PM2.5 sensors market.[4]Beijing Plantower Co., “Particulate Matter Sensor Solutions,” PLANTOWER.COM Brand leaders must cut cost without sacrificing accuracy, diverting R&D toward ASIC integration and automated calibration to maintain competitiveness. Commodity pricing squeezes investment capacity for next-generation platforms, potentially slowing innovation if value shifts entirely to cloud services.
*Our forecasts treat driver/restraint impacts as directional, not additive. The impact forecasts reflect baseline growth, mix effects, and variable interactions.
Segment Analysis
By Product Type: Optical Technologies Retain Commanding Position
Optical laser-scattering sensors held 46.83% of PM2.5 sensors market share in 2024, confirming their supremacy in real-time particulate detection. The segment benefits from zero-consumable operation, stable calibration intervals, and straightforward integration into HVAC and ambient stations. Hybrid platforms, blending optical and gas-sensing capabilities, are expanding at a 7.23% CAGR as OEMs demand multi-parameter diagnostics. Electrochemical and gravimetric methods serve niche calibration or selective-chemical scenarios but lack broad scalability.
Advances such as Panasonic’s SN-GCQB1 fold PM, humidity, temperature, and TVOC into a 15 mm package, delivering a decade of service life. The integration lowers BOM and wiring complexity, attracting appliance makers who need compact, all-in-one boards. As buildings migrate toward consolidated IAQ dashboards, hybrid sensors position vendors to upsell analytics and subscription services, sustaining revenue beyond initial hardware sales.


By Technology: Light-Scattering Maintains Market Leadership
Light-scattering technology captured 53.74% of 2024 revenue. Proven optical paths and low-noise photodiodes deliver high resolution at consumer-grade price points. Beta attenuation remains the gold standard for regulatory baselines but is costly and power-hungry, confining it to stationary reference stations. Integrated gas-particle modules, led by Sensirion’s SEN6x, are slated for a 7.55% CAGR as building codes shift toward holistic air-quality metrics.
The SEN6x platform bundles PM1, PM2.5, PM4, PM10, and VOC indices, giving device manufacturers a shortcut to WELL and RESET compliance. The modular architecture trims development cycles, an attractive proposition when time-to-certification determines commercial success. As real-estate portfolios commit to net-zero-ready retrofits, integrated sensors that feed directly into cloud dashboards will dominate purchase specifications.
By Application: Indoor Monitoring Drives Majority Demand
Indoor air-quality systems accounted for 42.74% of the PM2.5 sensors market size in 2024, reflecting occupant-health priorities and pandemic-era ventilation upgrades. Building managers embed sensors at return-air grills to trigger fan overrides when particulate levels breach setpoints. Outdoor ambient networks continue to secure municipal funding, but growth has plateaued relative to indoor rollouts. Wearables and smart appliances, however, are set to climb at a 7.18% CAGR as consumers track personal exposure in real time.
Atmotube and AirBeam bracelets broadcast AQI data to smartphones, empowering route optimization for sensitive populations. Calibration discrepancies between wrist-worn and stationary monitors persist, yet ongoing MEMS improvements promise parity within the forecast horizon. Appliance OEMs integrate PM2.5 sensors directly into purifier feedback loops, converting air-quality metrics into tangible filtration-speed adjustments that resonate with health-conscious buyers.
By End-User: Buildings Dominate While Automotive Surges
Residential and commercial sites represented 38.63% of 2024 shipments. Facility managers leverage sensor analytics to align ventilation runtimes with occupancy, locking in energy savings while meeting WELL thresholds. Industrial plants adopt continuous networks to satisfy ESG lending covenants, shifting upgrades from capex to finance-driven obligations. Automotive OEMs, buoyed by Euro 7 and China 7 deadlines, post a 7.22% CAGR, transforming cabins into managed microclimates.
BMW’s partnership with Vaisala Xweather showcases demand for predictive cabin environment management. Sensor feedback syncs with HVAC, window, and filtration systems to precondition cabins before passengers enter. Luxury adoption sets expectations for mass-market models, expanding the addressable sensor volume substantially by 2030.
Geography Analysis
North America captured 39.83% of global revenue in 2024. State incentives, especially CalSHAPE installations in schools, inject public funding into sensor procurements. Mature HVAC infrastructure facilitates plug-and-play retrofits, and widespread WELL certification drives multi-sensor nodes per floor. Domestic sensor makers leverage local service networks, securing higher ASPs by bundling calibration contracts. GDPR-style privacy rules are lighter, easing cloud analytics rollouts that add subscription revenue.
Asia-Pacific is the fastest-growing region at a 7.25% CAGR through 2030. China’s China 7 automotive rulebook alone demands millions of in-cabin sensors annually. Local fabs supply optical engines at competitive costs, creating vertical integration advantages. India’s National Clean Air Programme funds citywide monitors and mandates IAQ audits in public offices. Japanese electronics giants embed MEMS PM sensors into smart-home ecosystems, capitalizing on tech-savvy consumers who equate indoor air metrics with wellness.
Europe maintains stringent standards that favor premium sensors with traceable calibration. Euro 7 establishes PN10 detection, pushing vendors toward higher-resolution optics. Building owners retrofit sensors to comply with Energy Performance of Buildings Directive revision, balancing airtight construction with mandatory air-quality verification. GDPR restrictions spur on-premise analytics solutions, boosting demand for gateway devices with edge-processing capabilities that limit cloud data exposure.

Competitive Landscape
The PM2.5 sensors market features moderate fragmentation. Top industrial vendors like Sensirion, Bosch Sensortec, Panasonic Industry, and Honeywell dominate regulated sectors through quality systems and global support footprints. IoT specialists such as Plantower and Cubic Sensor serve commodity smart-home channels with aggressive pricing. Automotive Tier-1s integrate captive designs, creating semi-closed ecosystems that limit third-party entry.
Strategic moves emphasize full-stack offerings. Sensirion’s SEN6x launch positions the firm as a one-stop supplier of hardware, firmware, and cloud dashboards. Panasonic pairs its SN-GCQB1 with self-learning calibration to reduce lifetime service cost. Bosch leverages semiconductor capacity to scale BMV080 volumes, aiming to seed OEM design kits for wearables. Partnerships grow in prominence: BMW-Vaisala sets a precedent for vehicle-centric air-quality services, while CabinAir secures placements with Volvo, Polestar, and Lucid.
Price competition intensifies in consumer IoT, but industrial and automotive segments defend margins via qualification barriers and audit trails. Vendors that furnish ISO/IEC 17025 calibration certificates and meet AEC-Q100 stress tests gain procurement preference. As ESG disclosure gains legal weight, buyers favor suppliers that provide cryptographically signed data logs, signaling a shift from pure sensor specifications toward secure data ecosystems.
PM2.5 Sensors Industry Leaders
Honeywell International Inc.
Sensirion AG
Robert Bosch GmbH
ams-OSRAM AG
Sharp Corporation
- *Disclaimer: Major Players sorted in no particular order

Recent Industry Developments
- March 2025: Panasonic Industry unveiled SN-GCQB1, a 10-year life ultra-compact PM1.0/2.5/10 sensor with auto-calibration.
- November 2024: Sensirion released SEN6x, a nine-parameter modular air-quality platform aligned with healthy-building standards.
- September 2024: Bosch Sensortec introduced the BMV080, the world’s smallest PM2.5 sensor, enabling smartphone integration.
- August 2024: BMW Group partnered with Vaisala Xweather to integrate real-time air-quality data into cabin controls.


Global PM2.5 Sensors Market Report Scope
The PM2.5 Sensors Market Report is Segmented by Product Type (Optical, Electrochemical, Gravimetric and Beta-attenuation, Hybrid and Others), Technology (Light-Scattering, Beta Attenuation, MEMS, Integrated Gas-Particle Modules), Application (Indoor Air Quality, Ambient Monitoring, Automotive Cabin, Wearables and Smart Appliances, Other Applications), End-User (Residential and Commercial Buildings, Industrial Facilities, Automotive OEMs and Tier-1s, Government and Research, Other End-Users), and Geography (North America, South America, Europe, Asia-Pacific, Middle East and Africa). The Market Forecasts are Provided in Terms of Value (USD).
| Optical (Laser/LED) |
| Electrochemical |
| Gravimetric and Beta-attenuation |
| Hybrid and Others |
| Light-Scattering (Mie) |
| Beta Attenuation |
| Micro-electro-mechanical (MEMS) |
| Integrated Gas-Particle Modules |
| Indoor Air Quality Monitoring |
| Ambient / Outdoor Monitoring Stations |
| Automotive Cabin Monitoring |
| Wearables and Smart Appliances |
| Other Applications |
| Residential and Commercial Buildings |
| Industrial Facilities |
| Automotive OEMs and Tier-1s |
| Government and Research |
| Other End-Users |
| North America | United States | |
| Canada | ||
| Mexico | ||
| South America | Brazil | |
| Argentina | ||
| Chile | ||
| Rest of South America | ||
| Europe | Germany | |
| United Kingdom | ||
| France | ||
| Italy | ||
| Spain | ||
| Rest of Europe | ||
| Asia-Pacific | China | |
| India | ||
| Japan | ||
| South Korea | ||
| ASEAN | ||
| Rest of Asia-Pacific | ||
| Middle East and Africa | Middle East | Saudi Arabia |
| United Arab Emirates | ||
| Rest of Middle East | ||
| Africa | South Africa | |
| Nigeria | ||
| Rest of Africa | ||
| By Product Type | Optical (Laser/LED) | ||
| Electrochemical | |||
| Gravimetric and Beta-attenuation | |||
| Hybrid and Others | |||
| By Technology | Light-Scattering (Mie) | ||
| Beta Attenuation | |||
| Micro-electro-mechanical (MEMS) | |||
| Integrated Gas-Particle Modules | |||
| By Application | Indoor Air Quality Monitoring | ||
| Ambient / Outdoor Monitoring Stations | |||
| Automotive Cabin Monitoring | |||
| Wearables and Smart Appliances | |||
| Other Applications | |||
| By End-User | Residential and Commercial Buildings | ||
| Industrial Facilities | |||
| Automotive OEMs and Tier-1s | |||
| Government and Research | |||
| Other End-Users | |||
| By Geography | North America | United States | |
| Canada | |||
| Mexico | |||
| South America | Brazil | ||
| Argentina | |||
| Chile | |||
| Rest of South America | |||
| Europe | Germany | ||
| United Kingdom | |||
| France | |||
| Italy | |||
| Spain | |||
| Rest of Europe | |||
| Asia-Pacific | China | ||
| India | |||
| Japan | |||
| South Korea | |||
| ASEAN | |||
| Rest of Asia-Pacific | |||
| Middle East and Africa | Middle East | Saudi Arabia | |
| United Arab Emirates | |||
| Rest of Middle East | |||
| Africa | South Africa | ||
| Nigeria | |||
| Rest of Africa | |||


Key Questions Answered in the Report
What is the current global value of the PM2.5 sensors market?
The PM2.5 sensors market size is USD 190.35 million in 2025.
How fast is demand for PM2.5 sensors expanding in Asia-Pacific?
Asia-Pacific revenue is forecast to grow at a 7.25% CAGR from 2025 to 2030.
Which sensor technology holds the largest share today?
Light-scattering optical sensors lead with 53.74% of 2024 revenue.
Why are automakers installing PM2.5 sensors in new vehicles?
Euro 7 and China 7 rules require particulate monitoring, driving a 7.22% CAGR for automotive installations.
What challenge limits adoption of low-cost PM2.5 sensors?
Cross-sensitivity and humidity-induced accuracy drift can exceed 50% error without proper calibration.
Page last updated on:


