Physical AI Market Size and Share
Market Overview
| Study Period | 2020 - 2031 |
|---|---|
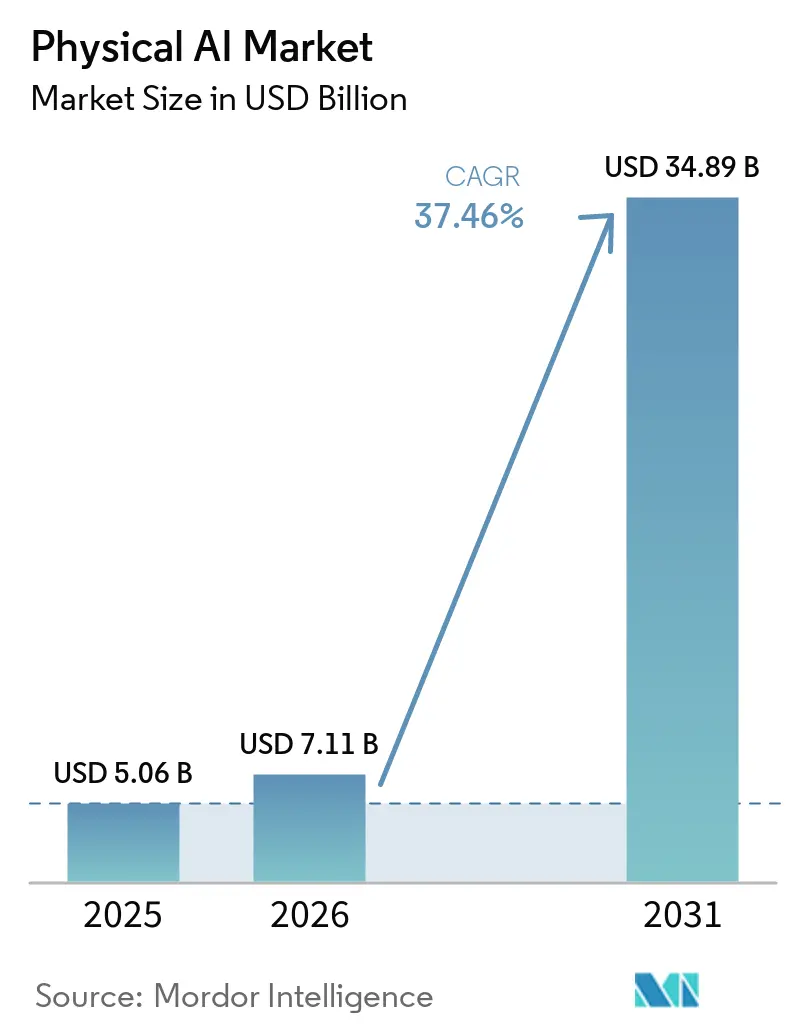
| Market Size (2026) | USD 7.11 Billion |
| Market Size (2031) | USD 34.89 Billion |
| Growth Rate (2026 - 2031) | 37.46% CAGR |
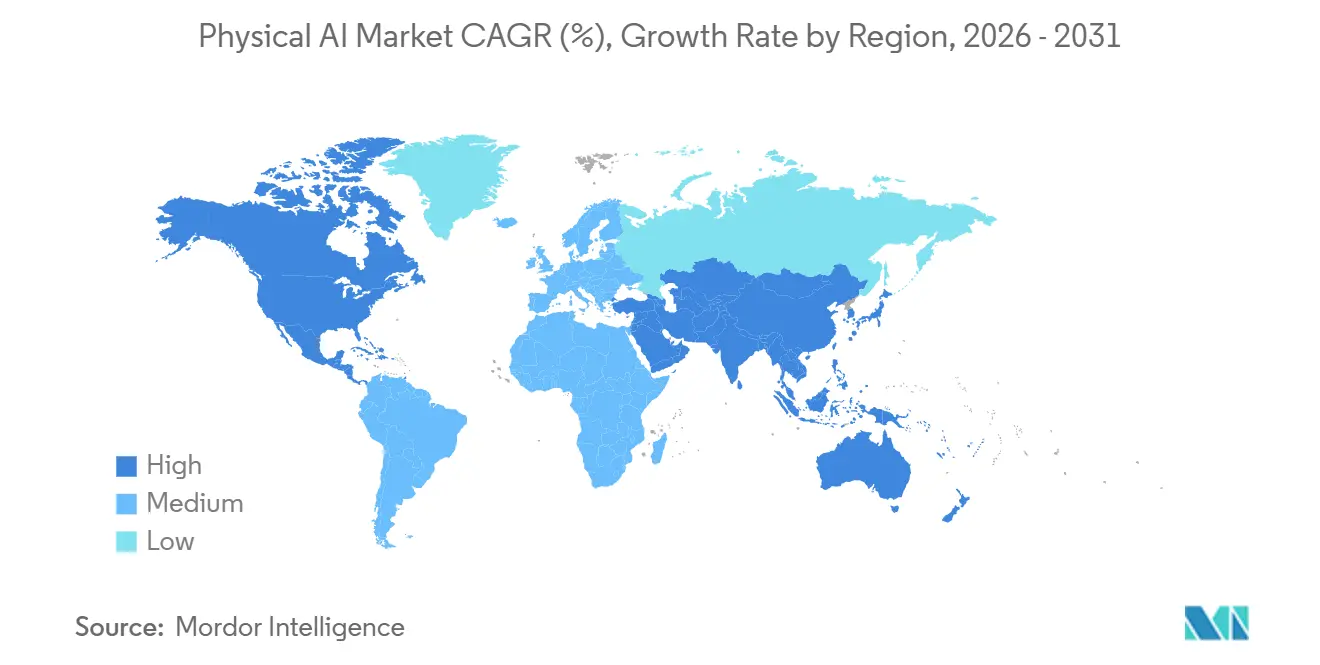
| Fastest Growing Market | Asia-Pacific |
| Largest Market | North America |
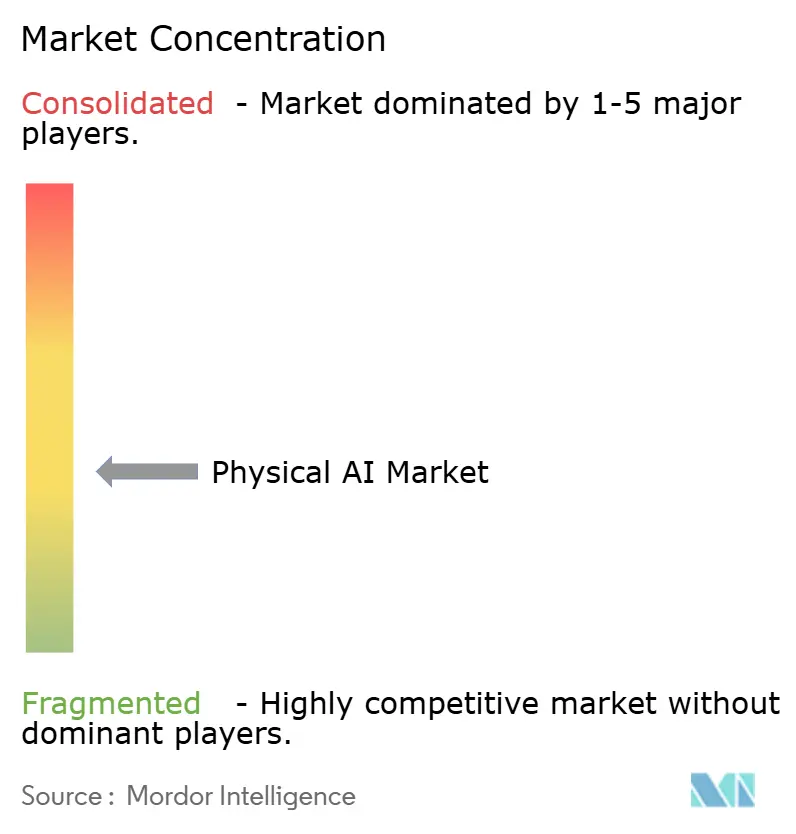
| Market Concentration | Medium |
Major Players *Disclaimer: Major Players sorted in no particular order Image © Mordor Intelligence. Reuse requires attribution under CC BY 4.0. | |
Physical AI Market Analysis by Mordor Intelligence
The physical AI market size is projected to expand from USD 5.06 billion in 2025 and USD 7.11 billion in 2026 to USD 34.89 billion by 2031, registering a CAGR of 37.46% between 2026 to 2031. Growth is being shaped by the move from pilot programs into real operating settings where buyers now weigh deployment speed, integration effort, and payback with much more discipline. Demand is also rising because low-latency decision making, safety requirements, and data control needs are pushing more intelligence onto machines rather than into distant cloud environments. The physical AI market is also being lifted by labor shortages in logistics, manufacturing, and other repetitive work settings where automation is no longer viewed as optional capacity support. Competitive behavior is changing as established robot makers add AI layers to proven hardware while newer companies build full stacks that link models, simulation tools, and robot platforms. This leaves the physical AI market with room to grow through software licensing, fleet orchestration, hybrid deployment models, and sim-to-real workflows that shorten commissioning time and reduce rollout risk.
Key Report Takeaways
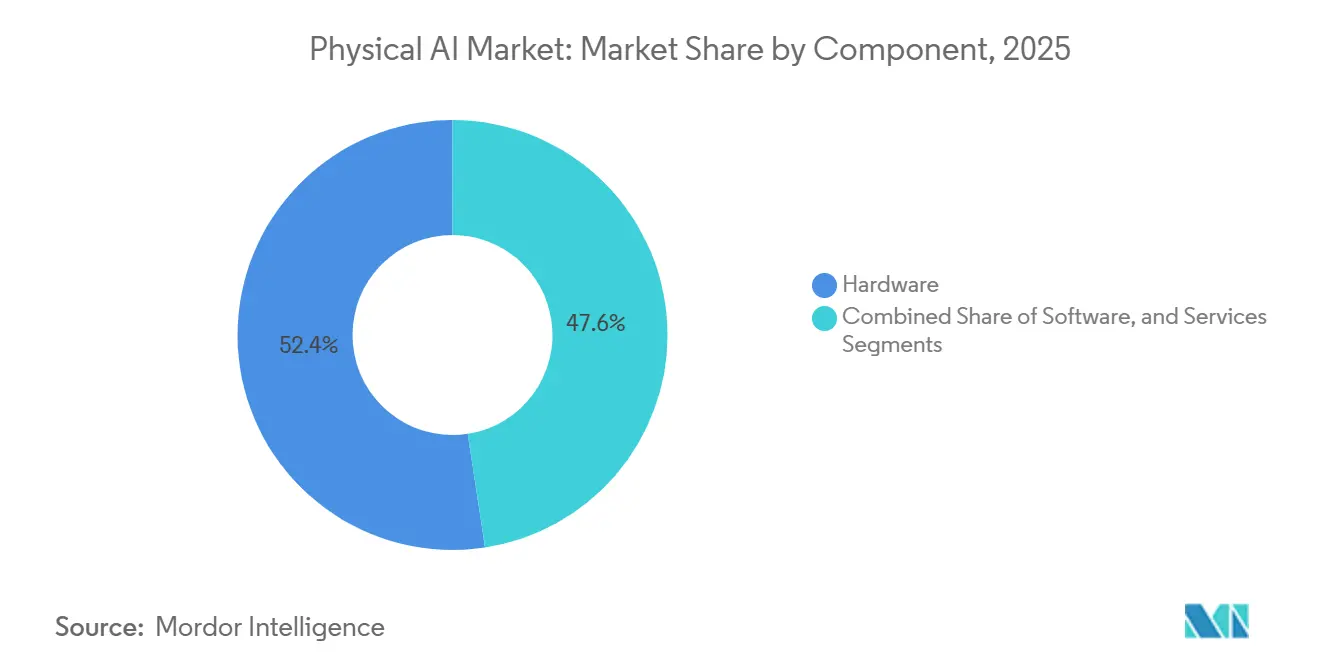
- By component, hardware led with 52.42% of the physical AI market share in 2025, while software is projected to expand at a 40.43% CAGR through 2031.
- By robot type, industrial robots held a 58.23% share in 2025, while professional service robots are expected to grow at a 39.72% CAGR through 2031.
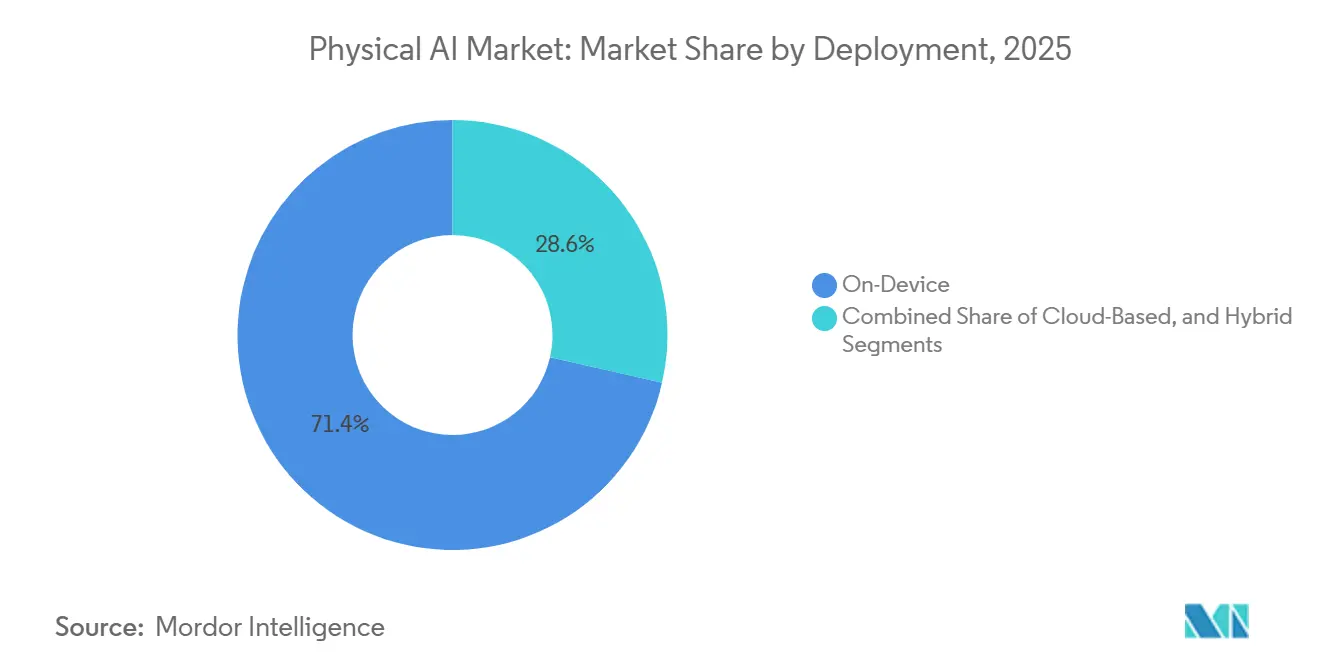
- By deployment, on-device compute accounted for 71.43% of the physical AI market share in 2025, while hybrid deployment is projected to grow at a 42.61% CAGR through 2031.
- By end-user verticals, logistics and supply chain captured 21.46% share in 2025, while healthcare is expected to advance at a 44.17% CAGR through 2031.
- By geography, North America held 31.82% share in 2025, while Asia-Pacific is projected to expand at a 43.04% CAGR through 2031.
Note: Market size and forecast figures in this report are generated using Mordor Intelligence’s proprietary estimation framework, updated with the latest available data and insights as of January 2026.
Global Physical AI Market Trends and Insights
Drivers Impact Analysis*
| Driver | (~) % Impact on CAGR Forecast | Geographic Relevance | Impact Timeline |
|---|---|---|---|
| Rising Demand for Real-World Automation in Logistics and Manufacturing | +8.2% | Global | Short term (≤ 2 years) |
| Edge AI Inference Maturity for Low-Latency Robot Decision-Making | +7.1% | North America and Asia-Pacific | Medium term (2-4 years) |
| Human-Robot Collaboration in High-Variability Workflows | +5.8% | Global | Medium term (2-4 years) |
| Labor Scarcity In Unstructured Physical Work Environments | +4.9% | North America, Europe, and the Asia-Pacific | Short term (≤ 2 years) |
| Sim-To-Real Digital Twin Pipelines Lower Deployment Risk | +3.6% | North America and Europe | Medium term (2-4 years) |
| Safety-Critical Autonomy Demand in Defense and Security | +2.8% | North America and Middle East, and Africa | Long term (≥ 4 years) |
| Source: Mordor Intelligence | |||
Rising Demand for Real-World Automation in Logistics and Manufacturing
Industrial robot installations in the United States rose 11% year over year to 38,000 units in 2025, showing that buyers were still adding automation capacity even outside a purely automotive cycle. The food industry alone posted a 30% increase to 3,000 installations, which showed that sectors with lower historical automation density were also moving faster. In the physical AI market, that matters because demand is no longer tied only to fixed factory robots; it is now spreading into mixed fleets that combine mobile systems, robot arms, and more adaptive control layers. Once operators pursue full workflow orchestration instead of isolated hardware purchases, software coordination and fleet management become more central to buying decisions. That shift supports the physical AI market because each new deployment increasingly depends on perception, planning, and control software that can work across different machine types.
Edge AI Inference Maturity for Low-Latency Robot Decision-Making
The release of the Jetson AGX Thor into general availability shows how quickly embedded compute capabilities are improving for robots that need immediate local reasoning.[1]NVIDIA Corporation, “NVIDIA Jetson Thor Unlocks Real-Time Reasoning for General Robotics and Physical AI,” NVIDIA Blog, blogs.nvidia.com NVIDIA stated that the platform delivers 2,070 FP4 teraflops and 7.5 times the AI compute of its predecessor, which supports real-time multimodal processing at the machine level. Boston Dynamics is integrating the platform into Atlas, and Agility Robotics has adopted it for the sixth generation of Digit, which shows how silicon choices are becoming strategic design decisions rather than replaceable components. In the physical AI market, this creates long-term vendor relationships because edge processors selected during design often remain in place throughout an operating life. The result is a more defined split between hardware that executes time-critical decisions locally and software layers that continue to gain value through updates, orchestration, and model improvements.
Human-Robot Collaboration in High-Variability Workflows
High-variability settings such as electronics assembly, food handling, and unscripted warehouse picking are becoming more suitable for robots because newer models can respond to changing objects and task sequences with less manual programming. That makes the physical AI market more relevant in workflows where fixed industrial automation had limited value because too much variability reduced utilization. FANUC shipped more than 1,000 robots for physical AI applications in the months following its commercial system launch at the International Robot Exhibition in December 2024, demonstrating early commercial pull for more adaptive machines. FANUC also moved to deepen its collaboration with Google, showing that established OEMs increasingly prefer to combine proven hardware with outside AI capability rather than build every model layer themselves. As this pattern spreads, the physical AI market benefits from a wider range of use cases in which robots must work closer to people and handle greater variation without compromising safety or productivity.
Labor Scarcity in Unstructured Physical Work Environments
Labor pressure remains a direct support for the physical AI market because shortages are concentrated in settings that are repetitive, physically demanding, and difficult to staff consistently. A Descartes survey cited in the input found that 76% of supply chain and logistics operations experienced workforce shortages, with 37% rating them as high to extreme, suggesting a persistent operating issue rather than a short-cycle. The same source noted more than 320,000 U.S. job postings for skilled hourly warehouse roles between December 2024 and April 2025, alongside annual turnover near 45%, which kept hiring and training costs elevated. In that setting, robot fleets are being evaluated as stable labor substitutes for tasks that previously relied on constant recruitment and retraining. The physical AI market benefits from this because unstructured work cannot be addressed by hardware alone; it requires systems that can perceive their surroundings, adapt in motion, and improve over time.
Restraints Impact Analysis*
| Restraint | (~) % Impact on CAGR Forecast | Geographic Relevance | Impact Timeline |
|---|---|---|---|
| High System Integration Cost and Long Commissioning Cycles | -3.8% | Global | Short term (≤ 2 years) |
| Certification, Liability, and Functional Safety Complexity | -2.9% | North America and Europe | Medium term (2-4 years) |
| Interoperability Gaps across Heterogeneous Robot Fleets | -1.8% | Global | Medium term (2-4 years) |
| Edge Case Reliability Limits in Unstructured Environments | -1.2% | Global | Long term (≥ 4 years) |
| Source: Mordor Intelligence | |||
High System Integration Cost and Long Commissioning Cycles
High deployment costs still slow the physical AI market even as robot hardware economics improve, because the full project typically includes tooling, safety systems, integration labor, infrastructure updates, and training. The input placed a mid-range collaborative robot cell at USD 50,000 to USD 90,000 before operators even begin to judge repeatability at scale. Integration labor of USD 100 to USD 140 per hour, added safety spending of USD 10,000 to USD 25,000, and training expense of USD 12,000 to USD 20,000 show why installation still feels like a system project rather than a product purchase. The problem becomes more serious when issues escape factory testing and appear during site acceptance, because every delay can disrupt line output or go-live schedules. This keeps the physical AI market from moving as fast as end demand alone would suggest, especially when buyers want a predictable time-to-value before expanding from one site to many.
Certification, Liability, and Functional Safety Complexity
Safety compliance is a major restraint because autonomous systems must fit within standards that were not designed for machines that perceive, reason, and act in changing environments. The input pointed to ANSI/RIA R15.06, IEC 61508, and ISO 10218 as overlapping benchmarks, indicating that deployers still face a fragmented compliance path rather than a single framework. NVIDIA announced Halos for Robotics in June 2026 as an open full-stack safety system recognized through accredited inspection pathways, which showed that suppliers are trying to create a practical structure before regulators fully define one. Liability also remains difficult because legal exposure can sit with the robot maker, model provider, integrator, and operator simultaneously. In the physical AI market, that uncertainty tends to favor larger enterprises that can more easily absorb insurance, compliance, and legal overhead than smaller operators.
*Our forecasts treat driver/restraint impacts as directional, not additive. The impact forecasts reflect baseline growth, mix effects, and variable interactions.
Segment Analysis
By Component: Hardware Anchors the Stack, Software Commands the Margin
Hardware held a 52.42% share in 2025, giving it the largest position in the physical AI market, as every deployment still starts with compute modules, actuators, sensors, and the robot body itself. The installed hardware base matters because it determines which models can run locally, how quickly a system can respond, and how much redesign is needed as capabilities improve. The physical AI market size at the component level still leaned toward hardware in 2025, reflecting the capital-intensive nature of robots that must operate in real environments rather than solely in software. Boston Dynamics integrated NVIDIA Jetson AGX Thor into Atlas, and Agility Robotics adopted the same platform for the sixth generation of Digit, demonstrating how early hardware decisions shape long-term supplier relationships. These design choices also affect serviceability, power consumption, thermal limits, and upgrade paths, meaning hardware still sets the operating boundaries for the rest of the stack.
Software is projected to grow at a 40.43% CAGR through 2031, indicating where more of the long-run value in the physical AI market is likely to shift. The shift is tied to world foundation models, simulation frameworks, and fleet management tools that improve performance across deployed machines without replacing physical assets. NVIDIA released GR00T N1.7 in early commercial access at GTC 2026, pointing to software licensing as a real revenue stream rather than only a feature embedded inside hardware sales.[2]NVIDIA Corporation, “NVIDIA and Global Robotics Leaders Take Physical AI to the Real World,” NVIDIA Newsroom, nasdaq.com Services remain important because integration, commissioning, training, and optimization become more complex as fleets spread across sites and include machines from different OEMs. The physical AI industry is therefore moving toward a structure where hardware opens the door, but software and service layers capture more of the recurring value as performance improves through updates and orchestration.


By Robot Type: Industrial Scale Meets Service Robot Ambition
Industrial robots held a 58.23% share in 2025, reflecting the large installed base already operating in automotive, electronics, and semiconductor settings. That position gave the physical AI market a strong foundation, as buyers could add smarter perception and control layers to proven hardware rather than replace entire systems. The established installed base also meant that even incremental AI upgrades could influence a wide set of production environments where throughput, quality, and labor flexibility matter. At the same time, the line between industrial and service robots is becoming less rigid, as warehouses and fulfillment sites now need machines that combine mobility, manipulation, and situational response. This is changing how suppliers define product categories, because a machine working in a warehouse aisle may now share traits with both an industrial arm and a service robot.
Professional service robots are projected to grow at a 39.72% CAGR through 2031, making them the fastest-growing robot type in the physical AI market. Growth is being driven by logistics, healthcare, and retail applications where operators want robots that can handle changing layouts, moving objects, and tasks that once required human judgment. The input also noted that humanoid and mobile manipulator platforms are moving into mixed-material handling, which explains why professional service robots have become a favored commercial entry point for general-purpose systems. Funding concentration around this category reinforces the view that suppliers and investors expect broader use beyond narrow pilots, even though the source-backed figures for some transactions were excluded here for source hygiene reasons. The physical AI industry is therefore balancing a mature industrial base with a faster-moving service robot segment that is expanding the addressable use case range well beyond fixed factory work.
By Deployment: On-Device Compute Defines the Baseline
On-device deployment held 71.43% share in 2025, showing that local inference remained the default architecture for the physical AI market, where immediate control, collision avoidance, and force feedback are essential. That share reflected engineering constraints more than preference, because round-trip cloud latency is not suitable for dynamic physical tasks that require millisecond response times. NVIDIA stated that Jetson AGX Thor supports real-time multimodal reasoning at the robot, reinforcing the importance of local compute in many deployments. When edge silicon is selected at the design stage, it often stays in place for years because changing it later can require hardware redesign and new validation work. This provides the physical AI market with a stable on-device foundation even as higher-level software models continue to evolve rapidly.
Hybrid deployment is projected to grow at a 42.61% CAGR through 2031, making it the fastest-growing deployment model in the physical AI market. In this structure, local systems handle time-sensitive control while connected environments support model updates, telemetry aggregation, workflow planning, and broader learning loops. NVIDIA also highlighted Omniverse-based digital twin workflows for robot training and commissioning, demonstrating how simulation and production can operate within a single connected architecture. This two-tier model helps operators separate what must stay local from what benefits from centralized coordination, and that improves both performance and operational visibility. As a result, the physical AI market is moving toward architectures where edge and cloud roles are not competing choices, but connected layers serving different parts of the same deployment lifecycle.
By End-User Verticals: Logistics Leads, Healthcare Pulls Fast
Logistics and supply chain held 21.46% share in 2025, giving it the largest vertical position in the physical AI market. That lead came from e-commerce volume growth, labor shortages, and the rising complexity of fulfillment centers that manage large footprints and very high SKU counts. In these settings, buyers are moving past isolated automation tools and seeking coordinated fleets that can move goods, pick items, and adapt to changing operational conditions. The physical AI market share at the vertical level remained concentrated enough for logistics to lead, yet not so concentrated that other use cases lacked room to expand. Manufacturing followed as the second-largest vertical, with automotive and electronics continuing to build on existing industrial robot infrastructure while adding smarter software layers over time.
Healthcare is projected to grow at a 44.17% CAGR through 2031, making it the fastest-growing vertical in the physical AI market. Growth comes from several separate adoption paths, including surgical assistance, rehabilitation, pharmacy automation, and patient monitoring, each with different integration demands and regulatory conditions. That spread matters because it reduces dependence on any one product category and gives suppliers multiple ways to enter the healthcare environment. The input also identified agriculture, defense and security, and automotive as additional verticals, which suggests that physical AI adoption is being shaped by several parallel demand streams rather than one dominant use case. This gives the physical AI market a wider growth base, but it also means vendors must support very different performance, safety, and operating conditions across customer groups.
Geography Analysis
North America held a 31.82% share in 2025, making it the largest regional market for physical AI. That lead reflected the concentration of AI infrastructure suppliers, strong commercial deployment sectors, and a defense environment that continues to support autonomy spending. U.S. industrial robot installations rose 11% to 38,000 units in 2025, reinforcing the region's broad automation momentum beyond software headlines. The Association for Advancing Automation has also pushed for a Federal Robotics Office and a national robotics strategy, indicating that policy discussions are moving toward deployment support, procurement alignment, and updated safety standards. Canada and Mexico add to the regional base through automotive and electronics production, and they benefit when cross-border deployment models spread from early adopters into broader supply chains.
Asia-Pacific is projected to grow at a 43.04% CAGR through 2031, making it the fastest-growing region in the physical AI market. The region combines manufacturing scale, robotics density, and policy support in a way that gives suppliers both local demand and production depth. The input linked this acceleration to China's 15th Five-Year Plan for 2026 to 2030 and to South Korea's robot density of 1,220 units per 10,000 manufacturing workers in 2026, which framed growth as structural rather than temporary. China also recorded 295,000 industrial robot installations in 2024 and held a 54% global share in that year, showing the scale of the regional robot base supporting future AI layering. For the physical AI market, this means Asia-Pacific is not only a demand center, it is also increasingly shaping supply economics, component ecosystems, and deployment speed.
Europe, South America, and Middle East and Africa show more varied adoption paths in the physical AI market, with performance tied to industrial structure, investment conditions, and standards maturity. Germany had 278,900 active industrial robots in 2024, or 40% of the EU factory robot base, yet the input also pointed to a projected 10% robotics and automation revenue decline in 2025 before a later recovery.[3]International Federation of Robotics, “World Robotics Report 2025, Zusammenfassung,” Roboterforum.de, roboterforum.de Europe appears more deliberate because reliability and standards still weigh heavily on commercial rollout decisions in advanced settings. South America and Middle East and Africa remain earlier-stage opportunities, where logistics automation and inspection robotics are acting as the main entry points for wider physical AI adoption.

Competitive Landscape
The physical AI market remains moderately fragmented, with competition spread across robot OEMs, AI platform providers, simulation software providers, and a growing group of startups building integrated systems. FANUC, ABB, Yaskawa Electric, and KUKA AG still hold significant market share in the installed base of industrial robots, while companies such as Figure AI, NEURA Robotics, Agility Robotics, and Dexterity are competing more directly in professional service robots and AI-heavy platform layers. This creates a two-track structure in which incumbents bring hardware scale, channel reach, and reliability, while newer firms push vertically integrated stacks that start with model design and move outward into deployment. In the physical AI market, that structure keeps strategic positions fluid because no single layer yet controls the full value chain across hardware, software, and real-world operations. It also means buyers can mix proven machinery with external AI platforms, which prevents concentration from becoming too high too early.
NVIDIA is strengthening its horizontal position in the physical AI market through the Isaac, Cosmos, and Omniverse stack and partnerships with multiple OEMs, rather than pursuing an exclusive hardware path. At GTC 2026, ABB Robotics, FANUC, KUKA AG, Universal Robots, and Yaskawa Electric were all named as integration partners, showing how one platform can sit across several competing robot brands. ABB also deepened its Omniverse work with NVIDIA for industrial-scale sim-to-real deployment, which showed how digital twin infrastructure is becoming part of competitive positioning. FANUC's collaboration with Google was another notable move because it confirmed that major OEMs are willing to import AI capability from outside rather than build every layer alone.[4]The Robot Report, “FANUC Partners With Google to Advance Physical AI in Its Robots,” The Robot Report, therobotreport.com Competition is also moving into standards and safety architecture because compliance can influence who wins enterprise deployment programs first.
NVIDIA's Halos for Robotics, announced in June 2026, was designed to shape safety workflows before regulators settle on a fully unified framework, which makes safety tooling part of competitive advantage. White-space opportunities remain visible in agriculture, smaller manufacturing operations, and rehabilitation settings where adoption is still early and platform control is not settled. The physical AI market is therefore competitive enough to reward scale, but still open enough for new entrants, software-heavy models, and robotics-as-a-service approaches to change rankings over the forecast period.
Physical AI Industry Leaders
NVIDIA Corporation
ABB Ltd
FANUC Corporation
Yaskawa Electric Corporation
KUKA AG
- *Disclaimer: Major Players sorted in no particular order

Recent Industry Developments
- June 2026: Kawasaki Robotics and Dexterity, Inc. expanded their collaboration at Automate 2026, pairing Kawasaki's RL030N, the industry's first 8-degree-of-freedom robot arm platform designed specifically for physical AI, with Dexterity's Mech super humanoid for warehouse logistics, targeting new categories of industrial automation in dynamic, confined environments.
- June 2026: Genesis AI and LG CNS announced a long-term strategic partnership to validate and deploy Genesis's general-purpose Eno robot across LG manufacturing and logistics operations in the United States, with planned global expansion. The partnership combines Genesis's GENE-26.5 robotics foundation model with LG CNS's system integration expertise across LG Group's operational infrastructure.
- June 2026: Unitree Robotics announced the H2 Plus, the first humanoid robot reference design built on the NVIDIA Isaac GR00T development platform, combining Unitree's H2 humanoid hardware with Sharpa five-fingered hands and NVIDIA Jetson Thor compute. The H2 Plus is expected to be commercially available in late 2026.
- March 2026: NVIDIA unveiled Isaac Lab 3.0 in early access, enabling large-scale robot learning on DGX-class infrastructure, released NVIDIA Isaac Sim 6.0 early developer access, and launched GR00T N1.7 in commercial early access, covering advanced dexterous control. Partners including ABB Robotics, FANUC, KUKA AG, Universal Robots, Figure AI, Agility Robotics, AGIBOT, and Yaskawa Electric were announced as adopters of the expanded platform.


Global Physical AI Market Report Scope
The physical AI market covers artificial intelligence systems integrated with physical devices, machines, and environments to perceive, analyze, decide, and act in the real world. The scope of the report includes AI-enabled robotics, autonomous systems, smart machines, industrial automation solutions, and embedded AI applications across end-user industries. The report analyzes market trends, growth drivers, restraints, opportunities, competitive landscape, and key developments during the study period.
The Physical AI Market Report is Segmented by Component (Hardware, Software, and Services), Robot Type (Industrial Robots, Professional Service Robots, Personal and Household Service Robots, and Other Robot Types), Deployment (On-Device, Cloud-Based, and Hybrid), End-User Verticals (Logistics and Supply Chain, Manufacturing, Healthcare, Defense and Security, Automotive, Agriculture, and Other End-User Verticals), and Geography (North America, Europe, Asia-Pacific, South America, and Middle East and Africa). The Market Forecasts are Provided in Terms of Value (USD).
| Hardware |
| Software |
| Services |
| Industrial Robots |
| Professional Service Robots |
| Personal and Household Service Robots |
| Other Robot Types |
| On-Device |
| Cloud-Based |
| Hybrid |
| Logistics and Supply Chain |
| Manufacturing |
| Healthcare |
| Defense and Security |
| Automotive |
| Agriculture |
| Other End-User Verticals |
| North America | United States |
| Rest of North America | |
| Europe | Germany |
| France | |
| Rest of Europe | |
| Asia-Pacific | China |
| Japan | |
| South Korea | |
| India | |
| Rest of Asia-Pacific | |
| South America | |
| Middle East and Africa |
| By Component | Hardware | |
| Software | ||
| Services | ||
| By Robot Type | Industrial Robots | |
| Professional Service Robots | ||
| Personal and Household Service Robots | ||
| Other Robot Types | ||
| By Deployment | On-Device | |
| Cloud-Based | ||
| Hybrid | ||
| By End-User Verticals | Logistics and Supply Chain | |
| Manufacturing | ||
| Healthcare | ||
| Defense and Security | ||
| Automotive | ||
| Agriculture | ||
| Other End-User Verticals | ||
| By Geography | North America | United States |
| Rest of North America | ||
| Europe | Germany | |
| France | ||
| Rest of Europe | ||
| Asia-Pacific | China | |
| Japan | ||
| South Korea | ||
| India | ||
| Rest of Asia-Pacific | ||
| South America | ||
| Middle East and Africa | ||


Key Questions Answered in the Report
What is the current and forecast value of the physical AI market?
The physical AI market reached USD 5.06 billion in 2025, stands at USD 7.11 billion in 2026, and is projected to reach USD 34.89 billion by 2031 at a 37.46% CAGR.
Which component leads revenue in physical AI?
Hardware led in 2025 with a 52.42% share because robots still require significant spending on compute modules, sensors, actuators, and physical platforms.
Which deployment model is most widely used in physical AI systems?
On-device deployment led with a 71.43% share in 2025 because many robotic tasks need immediate local inference for safe and stable control.
Which robot category is growing the fastest?
Professional service robots are projected to grow at a 39.72% CAGR through 2031 as logistics, healthcare, and retail operators adopt more adaptive mobile and manipulation systems.
Which end-user area offers the strongest growth potential?
Healthcare is expected to post the fastest growth at a 44.17% CAGR through 2031, supported by applications in surgery, rehabilitation, pharmacy automation, and patient monitoring.
Which region is expanding the fastest in physical AI adoption?
Asia-Pacific is projected to grow at a 43.04% CAGR through 2031, supported by manufacturing scale, robotics density, and policy focus across key countries.
Page last updated on:


