Pharmacokinetics Services Market Size and Share
Market Overview
| Study Period | 2020 - 2031 |
|---|---|
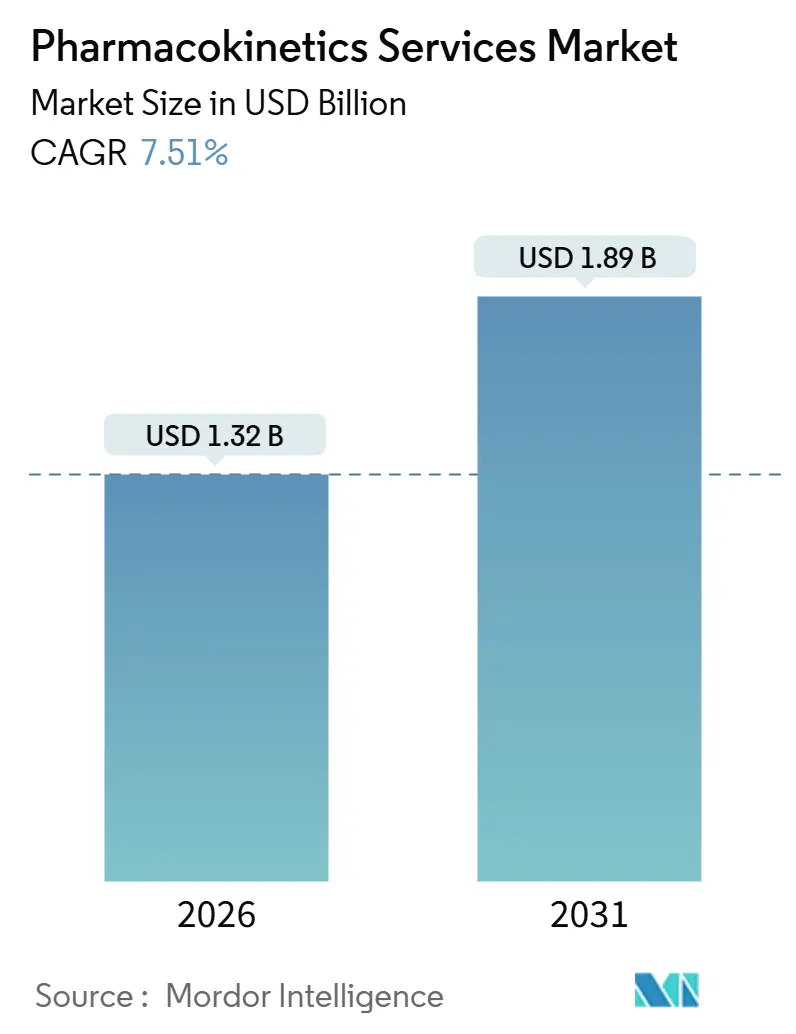
| Market Size (2026) | USD 1.32 Billion |
| Market Size (2031) | USD 1.89 Billion |
| Growth Rate (2026 - 2031) | 7.51% CAGR |
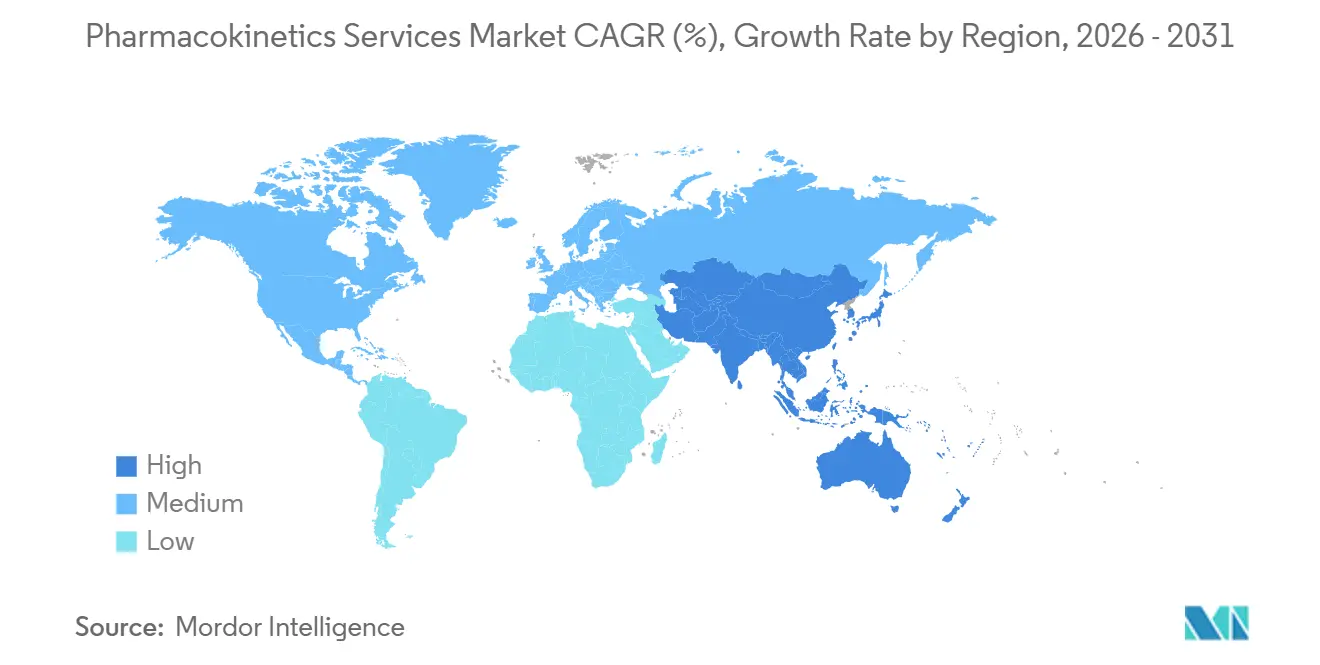
| Fastest Growing Market | Asia Pacific |
| Largest Market | North America |
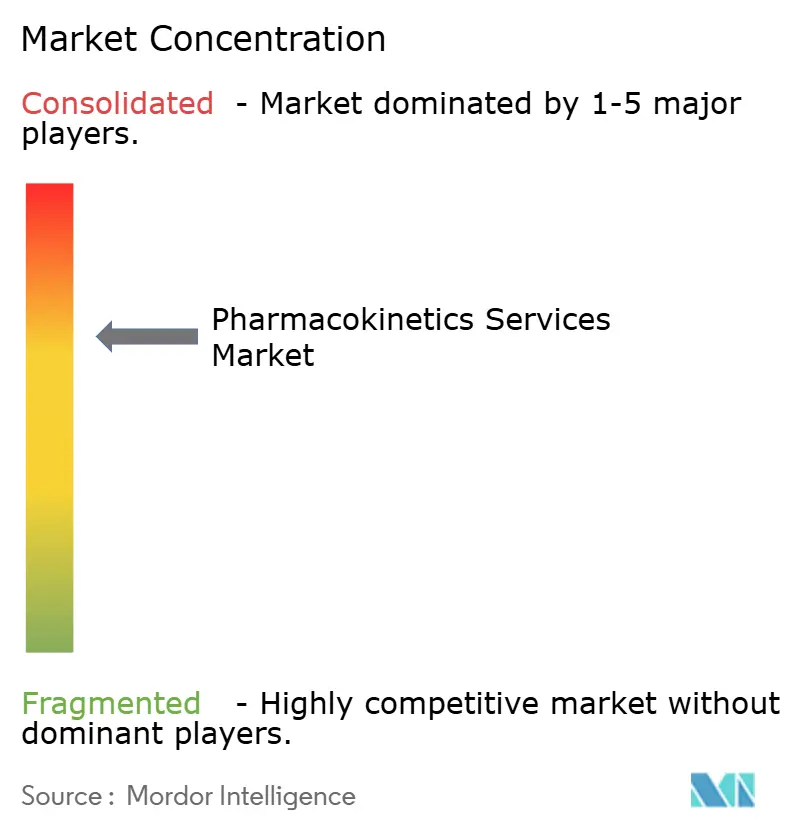
| Market Concentration | Medium |
Major Players *Disclaimer: Major Players sorted in no particular order Image © Mordor Intelligence. Reuse requires attribution under CC BY 4.0. | |
Pharmacokinetics Services Market Analysis by Mordor Intelligence
The Pharmacokinetics Services Market size is estimated at USD 1.32 billion in 2026, and is expected to reach USD 1.89 billion by 2031, at a CAGR of 7.51% during the forecast period (2026-2031).
Momentum stems from sponsors shifting toward model-informed drug development, rapid adoption of cloud collaboration platforms, and the use of organ-on-chip systems that shorten preclinical timelines. Large pharmaceutical companies continue to outsource routine bioanalysis while reserving capital for core discovery, and small biotechs gravitate to fixed-price, full-service packages that compress contracting cycles. Competitive intensity is heightened by software-led vendors integrating AI into population-PK workflows and by global CROs expanding GLP-certified laboratories in Asia to capture cost-sensitive demand. Regulatory convergence between the FDA and EMA around quantitative pharmacology further accelerates the uptake of end-to-end pharmacokinetics services that can withstand multi-region inspections.
Key Report Takeaways
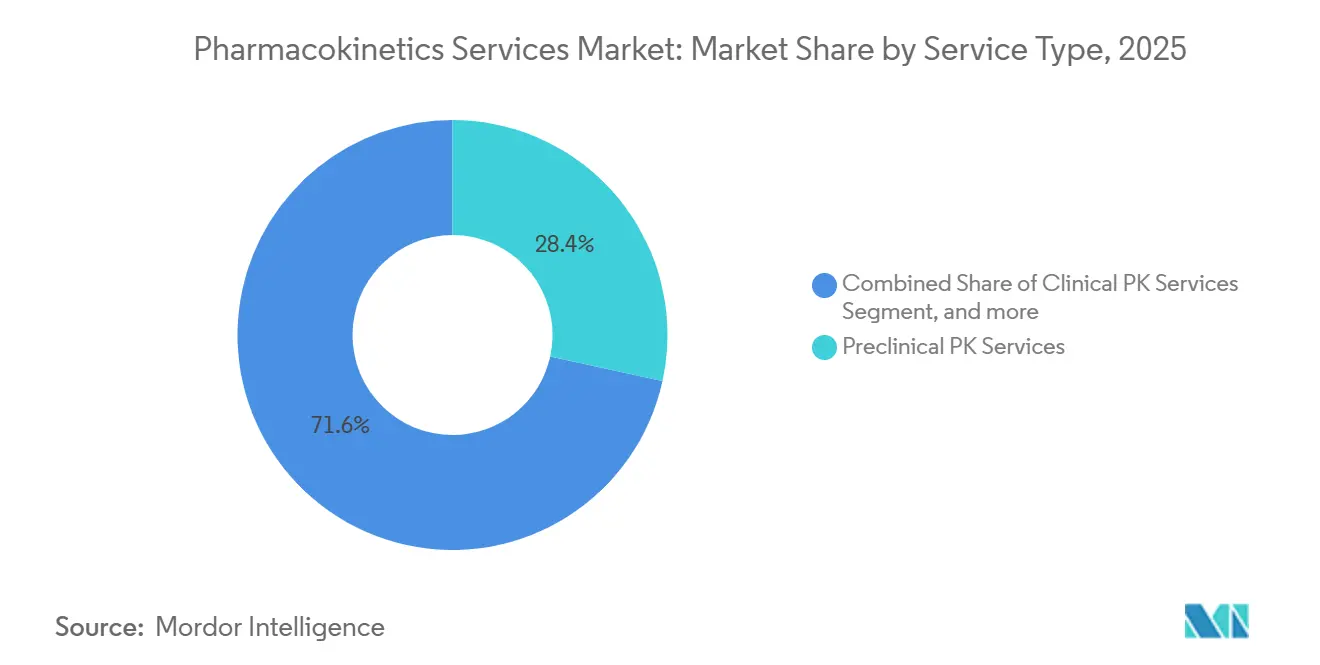
- By service type, preclinical PK services held 28.43% of the pharmacokinetics services market share in 2025, whereas bioanalytical services are forecast to expand at a 9.54% CAGR to 2031.
- By drug type, small molecules accounted for 57.54% of revenue in 2025, while large molecules are expected to grow at a 9.32% CAGR through 2031.
- By study phase, post-approval and lifecycle-management work is advancing at a 9.67% CAGR, outpacing Phase I–III activities, which contributed 29.64% of revenue in 2025.
- By therapeutic area, oncology generated 32.76% of revenue in 2025, yet infectious diseases are poised for a 10.67% CAGR on the back of antimicrobial resistance programs.
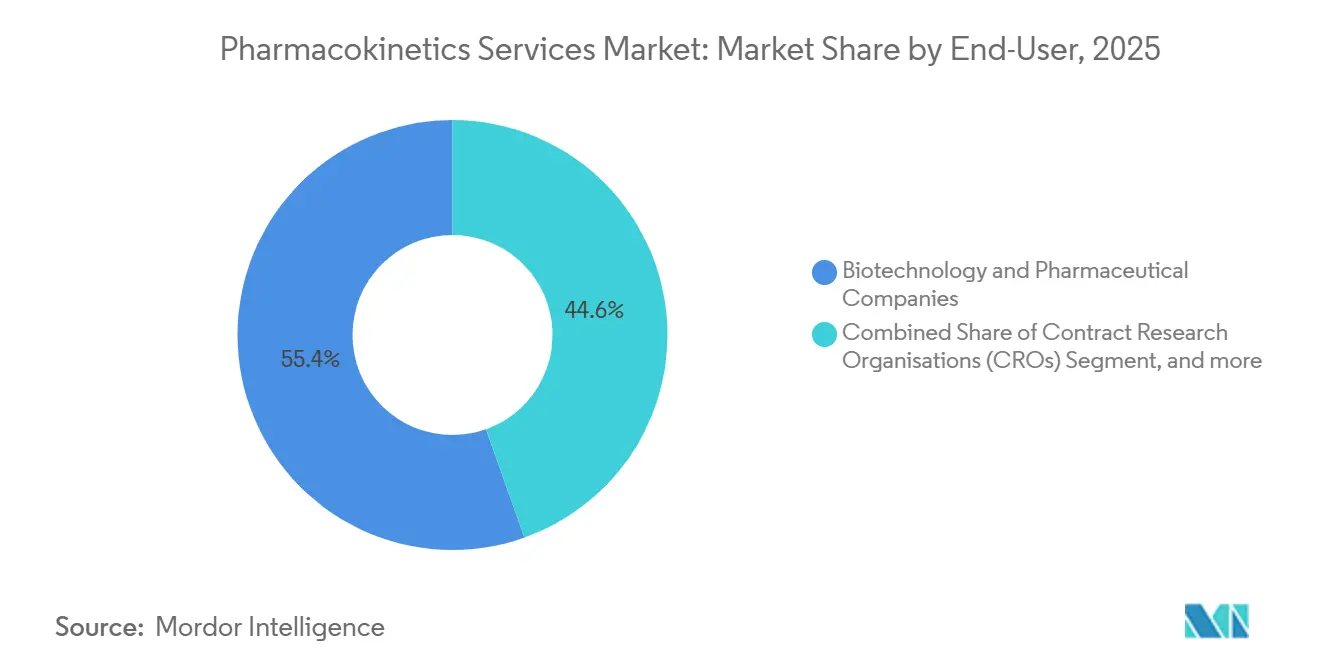
- By end user, contract research organizations recorded the fastest growth at a 10.54% CAGR, though biotechnology and pharmaceutical companies still accounted for 55.43% of spending in 2025.
- By geography, Asia-Pacific is projected to lead expansion with an 8.54% CAGR through 2031, despite North America accounting for 42.65% of revenue in 2025.
Note: Market size and forecast figures in this report are generated using Mordor Intelligence’s proprietary estimation framework, updated with the latest available data and insights as of January 2026.
Global Pharmacokinetics Services Market Trends and Insights
Drivers Impact Analysis*
| Driver | (~) % Impact on CAGR Forecast | Geographic Relevance | Impact Timeline |
|---|---|---|---|
| Rising Biopharmaceutical R&D Expenditure | +1.8% | Global, led by North America & Europe | Medium term (2–4 years) |
| Increasing Clinical Trial Volume Worldwide | +1.5% | Global, with APAC acceleration | Short term (≤ 2 years) |
| Shift Toward Model-Informed Drug Development Mandates | +2.1% | North America & Europe, spillover to APAC | Long term (≥ 4 years) |
| Adoption of Microphysiological Systems for Early PK Screening | +0.9% | North America & Europe | Medium term (2–4 years) |
| Growing Outsourcing Preference Among Small Biotechs | +1.4% | Global, concentrated in North America | Short term (≤ 2 years) |
| Cloud-Based PK Data Platforms Enabling Real-Time Collaboration | +0.8% | Global | Medium term (2–4 years) |
| Source: Mordor Intelligence | |||
Rising Biopharmaceutical R&D Expenditure
Global pharmaceutical R&D spending surpassed USD 240 billion in 2025 and is tilting toward biologics and precision medicines that need complex PK packages. The FDA’s population-PK guidance calls for exposure-response modeling, prompting sponsors to channel more budget to external modeling and high-throughput assays. Large companies reported double-digit growth in outsourced PK spend in their 2025 filings, favoring variable costs over internal headcount. Bigger budgets also support organ-on-chip adoption, helping replace selected animal studies. The cycle is reinforcing—premium PK services reduce late-stage attrition and free capital for additional pipeline assets.
Increasing Clinical Trial Volume Worldwide
ClinicalTrials.gov listed more than 480,000 active studies by end-2025, up 12% from 2023, and each study includes multiple PK sampling points, which swell laboratory demand. EMA guidance on adaptive trials encourages real-time PK monitoring, lifting sample counts per protocol[1]European Medicines Agency, “Adaptive Pathways Reflection Paper,” ema.europa.eu. Asia accounted for 28% of new trial starts in 2025, directing bioanalytical capacity toward Shanghai, Hyderabad, and Seoul. Decentralized designs add shipping complexity and favor vendors with validated cold-chain and dried-blood workflows. Faster recruitment and richer data together raise the volume and value of outsourced PK contracts.
Shift Toward Model-Informed Drug Development Mandates
The FDA logged 217 sponsor requests for its MIDD Paired Meeting Program by September 2025, confirming that quantitative pharmacology is now mainstream. Draft guidance stresses the use of physiologically based models for pediatric dosing and drug-interaction predictions, and the EMA has issued a companion concept paper that narrows regional divergence. CROs able to run NONMEM and Monolix models bill premium rates, while pure bioanalytical labs face pressure unless they partner with software vendors. Sponsors adopting MIDD early report 15-20% Phase II sample-size reductions and accelerated timelines. These regulatory incentives continue to expand the addressable market for pharmacokinetics services.
Adoption of Microphysiological Systems for Early PK Screening
The FDA Modernization Act 2.0 eliminated mandatory animal testing for certain INDs in 2024, catalyzing uptake of liver-, kidney-, and gut-on-chip devices. Early data show 80-85% accuracy for human clearance predictions, comparable to allometric scaling yet delivered faster. Partnerships such as Certara and Emulate allow chip data to feed directly into PBPK simulators, answering dose questions before first-in-human enrollment. Sponsors pursuing rare-disease assets find the approach especially valuable because patient samples are scarce. Although EMA guidance trails the FDA, cost and ethical benefits sustain momentum.
Restraints Impact Analysis*
| Restraint | (~) % Impact on CAGR Forecast | Geographic Relevance | Impact Timeline |
|---|---|---|---|
| High Cost of Advanced PK Studies and Infrastructure | -1.2% | Global, most acute in emerging markets | Short term (≤ 2 years) |
| Shortage of Skilled PK Modeling Talent | -0.9% | Global, most severe in North America & Europe | Long term (≥ 4 years) |
| Fragmented Bioanalytical Data Standards Limiting Interoperability | -0.6% | Global, with heightened impact on cross-region trials | Medium term (2–4 years) |
| Rising Data-Privacy Compliance Burdens in Multiregional Trials | -0.5% | Europe, APAC, and any study involving GDPR-like laws | Medium term (2–4 years) |
| Source: Mordor Intelligence | |||
High Cost of Advanced PK Studies and Infrastructure
Building a GLP bioanalytical lab with LC-MS/MS platforms can cost more than USD 5 million, deterring new entrants. Single-assay validation often costs USD 100,000, a hurdle for venture-backed biotechs. Price pressures push some sponsors toward Asian labs that charge 40–50% less, yet concerns about data integrity and IP protection keep high-value programs in Western facilities. Regulatory requirements for full validation mean sponsors cannot abandon traditional workflows mid-program. The result is a bifurcated market where established providers maintain pricing power.
Shortage of Skilled PK Modeling Talent
Industry surveys count fewer than 3,000 senior pharmacokineticists worldwide capable of leading regulatory-grade population analyses, while universities graduate roughly 200 new PhDs per year[2]Certara, “2025 Quantitative Pharmacology Workforce Survey,” certara.com. Certara’s 2025 report showed a 22% salary increase for experienced modelers, highlighting demand–supply imbalance. APAC CROs frequently relocate experts from North America or Europe or fund long apprenticeships, extending ramp-up times. Cloud platforms automate routine tasks, yet regulators still require human oversight, limiting scalability. The talent gap therefore raises project costs and can delay study starts.
*Our forecasts treat driver/restraint impacts as directional, not additive. The impact forecasts reflect baseline growth, mix effects, and variable interactions.
Segment Analysis
By Service Type: Bioanalytical Services Surge on Assay Complexity
Bioanalytical testing accounted for the largest share of the pharmacokinetics services market in 2025 and is on track for a 9.54% CAGR through 2031 as sponsors seek sub-picogram quantitation for novel biologics. Preclinical PK work retained 28.43% revenue, but growth is slower as automated ADME screens commoditize routine assays. Consulting and modeling, while smaller, command premium fees because regulators expect population-PK reports with every complex submission. Laboratories are investing in high-resolution mass spectrometry, immunoaffinity enrichment, and automated data pipelines that connect directly to cloud platforms, enabling near-real-time turnaround.
Clinical PK assays remain essential in Phase I–III trials, yet margins narrow when automated platforms handle high-throughput small-molecule work. Regulatory support services remain niche, anchored by specialist consultancies that guide pre-IND interactions. The pharmacokinetics services market for bioanalytical services is projected to grow by USD 280 million by 2031 as demand converges on large-molecule analytics. Labs that achieve sub-picogram limits of quantification win first-in-human programs for antibody-drug conjugates, demonstrating the link between assay sensitivity and contract value.


By Drug Type: Biologics Complexity Drives Premium Pricing
Small molecules delivered 57.54% revenue in 2025, thanks to the volume of oral generics and reformulations. Biologics, including antibody-drug conjugates and cell therapies, are advancing at a 9.32% CAGR as complex ADME behavior requires target-mediated and nonlinear models. Immunogenicity guidance obliges sponsors to correlate anti-drug antibodies with PK exposure, necessitating dual immunoassay and LC-MS/MS workflows. Antibody-drug conjugates require triple-assay panels to track intact conjugate, total antibody, and free payload, which triples sample volumes.
Cell- and gene-therapy programs require integration of qPCR and flow cytometry, areas where only a handful of CROs have validated protocols. Consequently, biologics projects command 3-5 times higher method-development budgets, lifting overall pharmacokinetics services market size despite smaller study counts. Small-molecule work remains steady, but pricing pressure persists as bioequivalence testing migrates to cost-efficient Asian labs.
By Study Phase: Post-Approval Work Gains Traction
Phase I–III studies delivered 29.64% revenue in 2025, yet post-approval and lifecycle work is climbing fastest at a 9.67% CAGR on regulatory calls for real-world exposure data. Post-marketing PK supports label expansions, pediatric formulations, and risk-management commitments. Discovery-phase PK is increasingly automated, reducing per-compound cost but raising throughput.
Preclinical animal work is gradually being displaced as microphysiological systems qualify for specific endpoints, though complete replacement remains years away. Sponsors fund multi-year PK programs to defend market share, offering CROs predictable revenue streams. The pharmacokinetics services market share for post-approval studies could reach double digits by 2031 as real-world evidence requirements tighten.
By End-User: CROs Emerge as Dual Buyers and Providers
Biotechnology and pharmaceutical companies still purchased 55.43% of services in 2025, but CROs posted the highest growth, rising 10.54% annually as they both consume and resell PK capacity. Academic and government institutes leverage public grants for neglected-disease programs, generating niche but strategic demand.
CRO consolidation is accelerating, yielding integrated offerings that couple site management with pharmacokinetics expertise. Specialized labs survive by focusing on ultra-sensitive biologic assays or specific therapeutic areas such as gene therapy. The pharmacokinetics services industry, therefore, displays a barbell structure: a few global full-service CROs at one end and numerous technical specialists at the other.
By Therapeutic Area: Infectious Diseases Accelerate on AMR Urgency
Oncology retained 32.76% revenue in 2025, driven by tumor-penetration studies for immune-oncology agents. Infectious-disease work is growing at a 10.67% CAGR due to antimicrobial-resistance initiatives, with hollow-fiber infection models now standard for dose-optimization studies. CNS programs require validated cerebrospinal fluid assays, allowing only a few labs to compete, which supports premium pricing.
Cardiovascular programs create a steady baseline demand through mandatory drug-interaction testing. The pharmacokinetics services market for infectious diseases is likely to double by 2031 if funding for priority pathogens continues. Oncology remains the largest revenue pool, yet technical barriers in CNS and infectious diseases deliver higher margins.
Geography Analysis
North America captured 42.65% of 2025 revenue on the strength of FDA leadership in model-informed drug development, dense pharmaceutical headquarters, and tier-one CRO infrastructure. Sponsors often run pivotal PK work in the region to align early with reviewers and secure shorter feedback cycles. Europe ranks second, aided by the EMA’s coordinated frameworks and a deep pool of academic talent that feeds CRO modeling teams. Switzerland and the Nordics outperform their size thanks to targeted life sciences incentives.
Asia-Pacific is set for an 8.54% CAGR to 2031 as sponsors migrate trials to China, India, Japan, and South Korea, where per-patient costs run 40-60% lower than in North America. China’s regulator now accepts foreign clinical data, reducing duplicative PK work, while India’s CROs invest aggressively in LC-MS/MS fleets. Japan maintains stringent bioanalytical standards, granting its CROs credibility despite higher labor costs. Intellectual property safeguards and data privacy patchwork remain hurdles, yet cost advantages are durable.
Latin America, the Middle East, and Africa stay smaller but show targeted potential. Gulf nations fund life sciences clusters to diversify economies, attracting CRO regional hubs. Brazil’s streamlined bioequivalence rules spur demand for generic-drug PK services, and Argentine providers leverage bilingual staff to win cross-border contracts. Collectively, these regions offer treatment-naïve populations and regulators open to foreign PK data, lowering global development costs.

Competitive Landscape
The pharmacokinetics services market remains moderately fragmented: the top five vendors—Certara, Charles River, Labcorp, Eurofins, and IQVIA—accounted for roughly 38% of revenue in 2025. Integrated CROs compete on breadth and single-vendor accountability, while specialty labs differentiate on assay sensitivity and therapeutic-area expertise. Software-centric players monetize cloud modeling platforms that relieve the talent bottleneck.
Consolidation gained pace in 2025: Eurofins acquired BioTox Sciences to expand its North American preclinical reach, and Labcorp launched a lab in Hyderabad to marry Western quality standards with Asian cost structures. Certara acquired an AI startup to automate covariate selection, signaling a pivot toward machine-learning-enhanced modeling. White-space opportunities center on hybrid organ-chip plus PBPK workflows, real-world PK monitoring in decentralized trials, and AI-augmented model building.
Regulatory compliance serves as a moat; labs passing FDA inspections without observations secure premium pricing. Sponsors increasingly audit subcontractors to mitigate compliance risk, creating barriers to entry. Despite consolidation, room remains for niche specialists in gene-therapy, RNA, and radiopharmaceutical assays, where validated methods are scarce and pricing power is high.
Pharmacokinetics Services Industry Leaders
Certara L.P.
Charles River Laboratories International Inc.
Eurofins Scientific SE
IQVIA
Labcorp Drug Development
- *Disclaimer: Major Players sorted in no particular order

Recent Industry Developments
- January 2026: Certara, Inc., one of the global leaders in model‑informed drug development, announced the release of AI PK Reports, an AI‑powered module within its Phoenix Cloud suite that automates the generation of pharmacokinetic (PK) and toxicokinetic (TK) reports. This new capability converts tables, figures, and listings into fully formatted draft reports — reducing a process that often takes days or weeks into minutes.
- January 2026: Syngene International, a global contract research, development, and manufacturing organization (CRDMO), has extended its long-standing strategic collaboration with Bristol Myers Squibb through 2035. The expanded agreement broadens the scope of integrated services across the drug development lifecycle, spanning discovery (chemistry, biology, drug metabolism, and pharmacokinetics), translational sciences, pharmaceutical development and manufacturing, clinical trials, data, and information technology services to enable seamless progression from research to commercialization.
- August 2025: Biotechnology company Creative Bioarray launched high-throughput ADME screening services to help researchers identify lead candidates with favourable ADME profiles more quickly. The company’s screening service combines an automated, intelligent experimental platform with advanced bioinformatics analysis tools.


Global Pharmacokinetics Services Market Report Scope
As per the scope of the report, pharmacokinetics services involve analyzing how drugs are absorbed, distributed, metabolized, and excreted in the body to ensure optimal drug development and dosing. These services include bioanalytical testing, study design, and data modeling to support regulatory approval. They are essential for understanding drug behavior and safety in both preclinical and clinical stages.
The Pharmacokinetics Services Market is Segmented by Service Type (Preclinical PK Services, Clinical PK Services, Bioanalytical Services, Consulting & Modeling Services, and Regulatory Support Services), Drug Type (Small Molecules and Large Molecules), Study Phase (Discovery, Preclinical, Clinical Phase I–III, and Post-Approval & Lifecycle Management), End-User (Biotechnology & Pharmaceutical Companies, CROs, Academic & Government Institutes, and Other End-Users), Therapeutic Area (Oncology, CNS, Cardiovascular, Infectious Diseases, and Others), and Geography (North America, Europe, Asia-Pacific, Middle East & Africa, and South America). Market Forecasts are Provided in Terms of Value (USD). The market report also covers the estimated market sizes and trends for 17 countries across major regions globally. The report offers the value (in USD million) for the above segments.
| Preclinical PK Services |
| Clinical PK Services |
| Bioanalytical Services |
| Consulting & Modeling Services |
| Regulatory Support Services |
| Small Molecules |
| Large Molecules (Biopharmaceuticals) |
| Discovery |
| Preclinical |
| Clinical (Phase I-III) |
| Post-Approval & Lifecycle Management |
| Biotechnology & Pharmaceutical Companies |
| Contract Research Organisations (CROs) |
| Academic & Government Research Institutes |
| Other End-Users |
| Oncology |
| CNS Disorders |
| Cardiovascular Diseases |
| Infectious Diseases |
| Other Therapeutic Areas |
| North America | United States |
| Canada | |
| Mexico | |
| Europe | Germany |
| United Kingdom | |
| France | |
| Italy | |
| Spain | |
| Rest of Europe | |
| Asia-Pacific | China |
| Japan | |
| India | |
| Australia | |
| South Korea | |
| Rest of Asia-Pacific | |
| Middle East & Africa | GCC |
| South Africa | |
| Rest of Middle East & Africa | |
| South America | Brazil |
| Argentina | |
| Rest of South America |
| By Service Type | Preclinical PK Services | |
| Clinical PK Services | ||
| Bioanalytical Services | ||
| Consulting & Modeling Services | ||
| Regulatory Support Services | ||
| By Drug Type | Small Molecules | |
| Large Molecules (Biopharmaceuticals) | ||
| By Study Phase | Discovery | |
| Preclinical | ||
| Clinical (Phase I-III) | ||
| Post-Approval & Lifecycle Management | ||
| By End-User | Biotechnology & Pharmaceutical Companies | |
| Contract Research Organisations (CROs) | ||
| Academic & Government Research Institutes | ||
| Other End-Users | ||
| By Therapeutic Area | Oncology | |
| CNS Disorders | ||
| Cardiovascular Diseases | ||
| Infectious Diseases | ||
| Other Therapeutic Areas | ||
| Geography | North America | United States |
| Canada | ||
| Mexico | ||
| Europe | Germany | |
| United Kingdom | ||
| France | ||
| Italy | ||
| Spain | ||
| Rest of Europe | ||
| Asia-Pacific | China | |
| Japan | ||
| India | ||
| Australia | ||
| South Korea | ||
| Rest of Asia-Pacific | ||
| Middle East & Africa | GCC | |
| South Africa | ||
| Rest of Middle East & Africa | ||
| South America | Brazil | |
| Argentina | ||
| Rest of South America | ||


Key Questions Answered in the Report
What revenue is projected for the pharmacokinetics services market in 2031?
The market is forecast to reach USD 1.89 billion by 2031 given its 7.51% CAGR trajectory.
Which region will expand fastest through 2031?
Asia-Pacific is expected to lead with an 8.54% CAGR, driven by clinical-trial migration and expanded GLP capacity.
Why are bioanalytical services growing faster than other service types?
Sponsors need ultra-sensitive assays for biologics and gene therapies, pushing bioanalytical revenue at a 9.54% CAGR.
How does model-informed drug development influence service demand?
Regulatory mandates for quantitative pharmacology increase early engagement of PK consultancies, lifting demand for modeling and simulation packages.
What factor restrains new entrants the most?
The USD 5 million capital requirement for GLP labs and high instrument costs deter many potential entrants.
Which therapeutic area offers the highest growth potential?
Infectious diseases show a 10.67% CAGR due to global antimicrobial-resistance initiatives that rely on PK/PD-optimized dosing.
Page last updated on:


