Pharmaceutical CDMO 2.0 Market Size and Share
Market Overview
| Study Period | 2020 - 2031 |
|---|---|
| Market Size (2026) | USD 186.65 Billion |
| Market Size (2031) | USD 272.85 Billion |
| Growth Rate (2025 - 2031) | 7.89% CAGR |
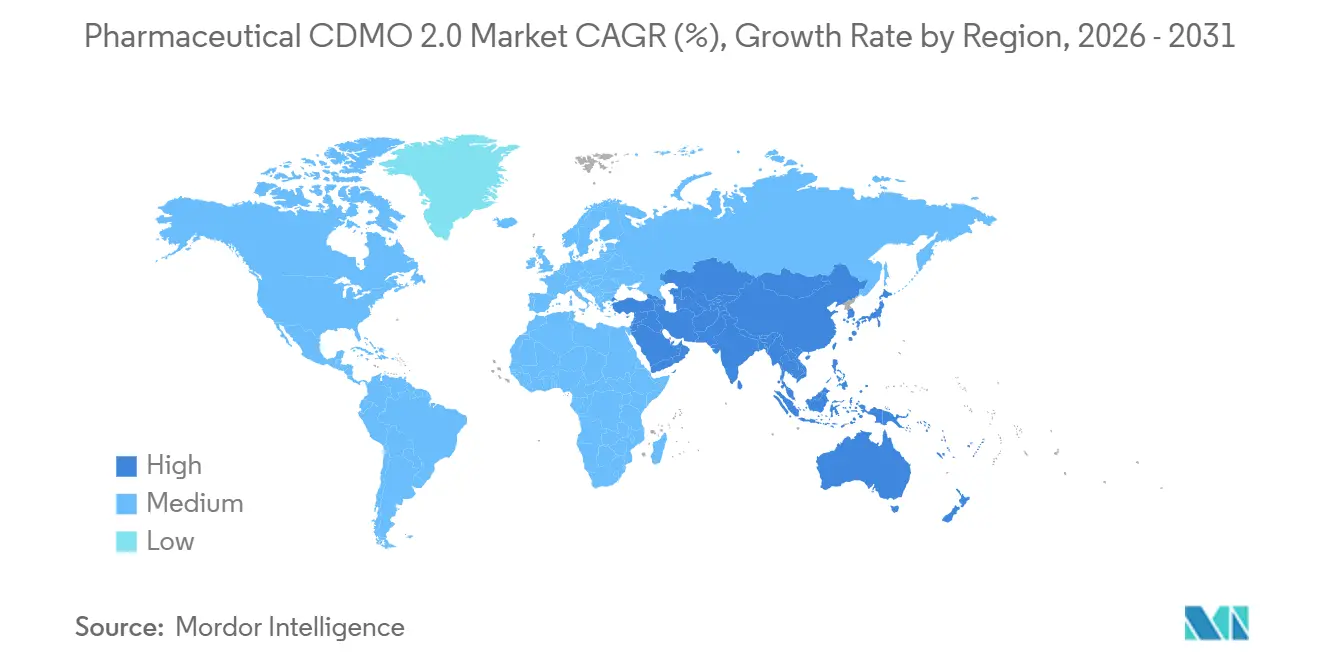
| Fastest Growing Market | Asia Pacific |
| Largest Market | North America |
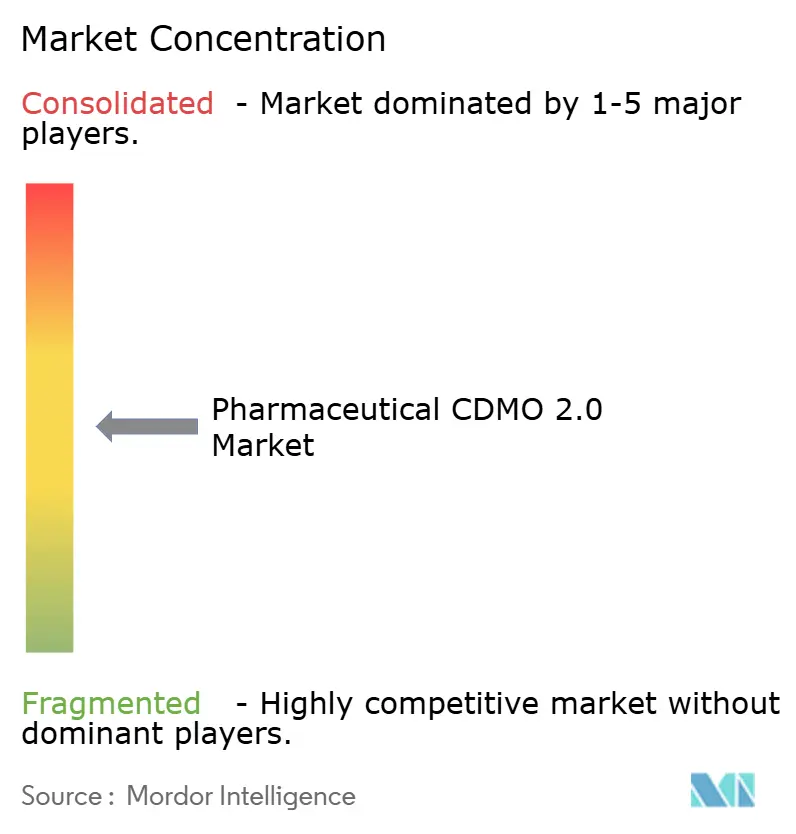
| Market Concentration | Medium |
Major Players
*Disclaimer: Major Players sorted in no particular order Image © Mordor Intelligence. Reuse requires attribution under CC BY 4.0. |
|
Pharmaceutical CDMO 2.0 Market Analysis by Mordor Intelligence
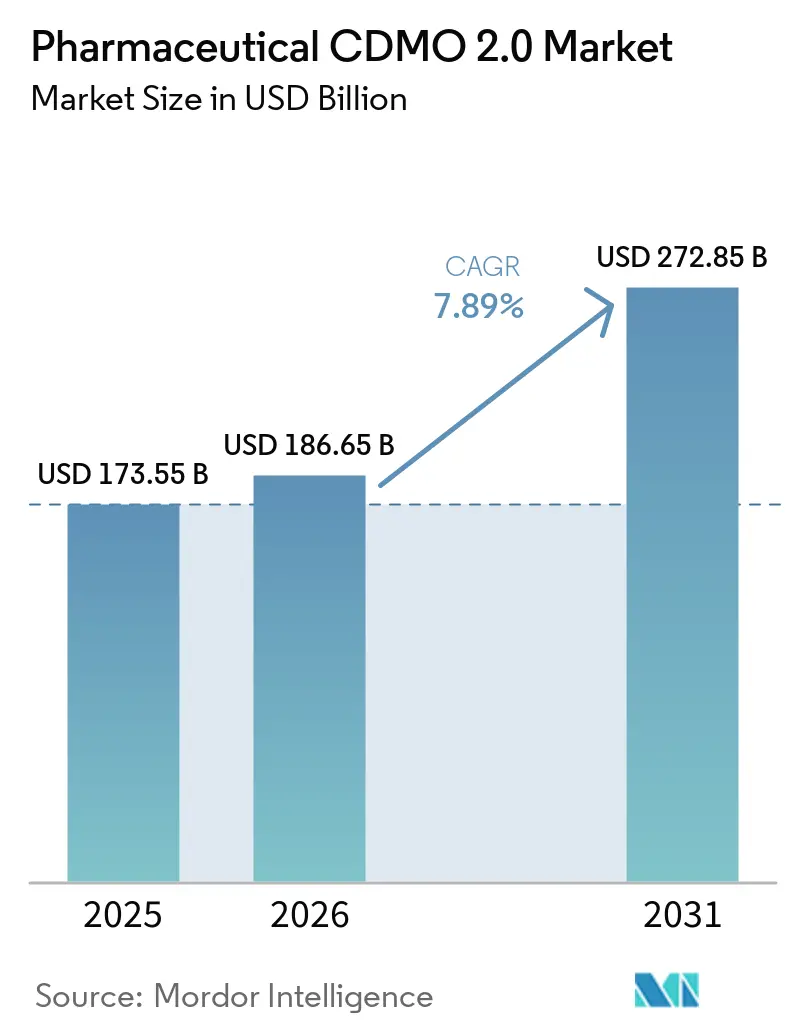
The Pharmaceutical CDMO 2.0 Market size is expected to grow from USD 173.55 billion in 2025 to USD 186.65 billion in 2026 and is forecast to reach USD 272.85 billion by 2031 at 7.89% CAGR over 2026-2031.
Strengthening demand reflects a decisive move from transactional outsourcing to strategic, risk-sharing alliances, encouraged by AI-enabled process development, end-to-end service integration, and the growing share of biologics and highly potent APIs. Novo Holdings paid USD 16.5 billion for Catalent in December 2024, an enterprise value historically associated with innovator pharma and signaling the new centrality of CDMOs in drug launch strategy. Increasing government scrutiny of supply-chain resilience, notably the BIOSECURE Act in the United States, is diverting contracts from selected Chinese providers toward North American and allied facilities. At the same time, capacity expansions in India, Switzerland, and South Korea seek to close fill-finish and peptide shortfalls. Sponsors now weigh the total cost of ownership rather than the unit price alone, rewarding CDMOs that share capital risk, guarantee speed to market, and embed digital quality management systems.
Key Report Takeaways
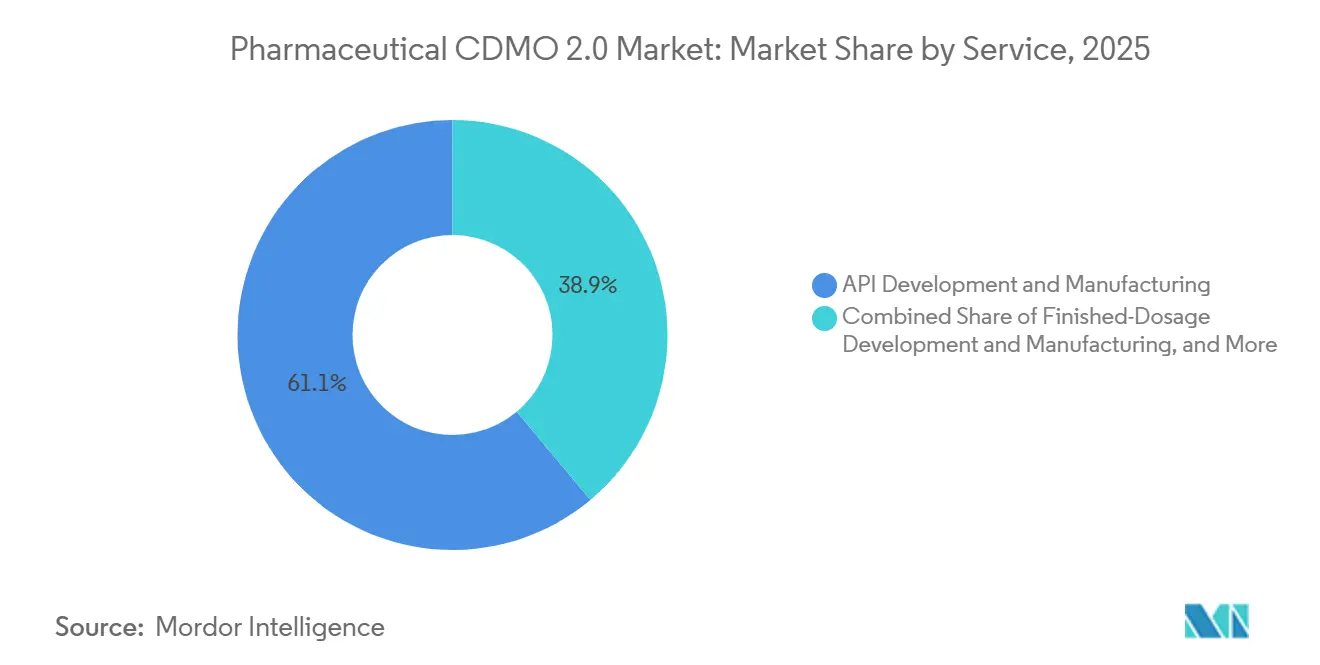
- By service, API development and manufacturing led the pharmaceutical CDMO 2.0 market with 61.09% of the market share in 2025, while finished-dosage work is projected to advance at a 9.01% CAGR through 2031.
- By molecule type, small-molecule programs accounted for 65.21% of the pharmaceutical CDMO 2.0 market in 2025, yet highly potent APIs are on track to grow at 8.12% through 2031.
- By development phase, Phase III commanded 32.90% revenue share in 2025; Phase II is poised for the fastest 8.2% CAGR to 2031.
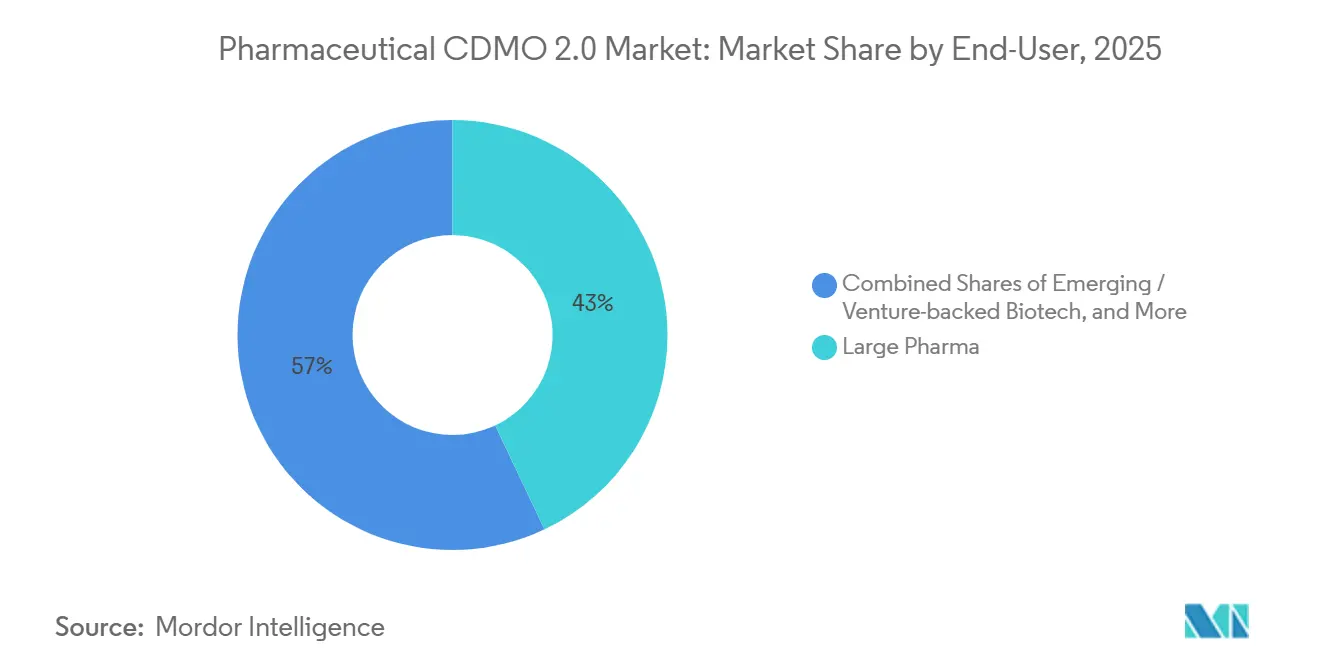
- By end user, large pharma accounted for 42.97% of spending in 2025 and shows the highest 8.43% CAGR outlook.
- By geography, North America captured a 40.25% share in 2025, while Asia-Pacific is the fastest-growing region at a 9.78% CAGR through 2031.
Note: Market size and forecast figures in this report are generated using Mordor Intelligence’s proprietary estimation framework, updated with the latest available data and insights as of January 2026.
Global Pharmaceutical CDMO 2.0 Market Trends and Insights
Drivers Impact Analysis*
| DRIVER | (~) % IMPACT ON CAGR FORECAST | GEOGRAPHIC RELEVANCE | IMPACT TIMELINE |
|---|---|---|---|
| Increasing outsourcing volume by large pharmaceutical companies | 1.5% | Global, with concentration in North America & Europe | Medium term (2–4 years) |
| Surge in biologics and complex-molecule pipelines | 1.3% | Global, led by North America, Europe, and Asia-Pacific hubs (South Korea, Singapore) | Long term (≥ 4 years) |
| Cost- and speed-advantage of manufacturing in emerging markets | 1.2% | Asia-Pacific (India, China), Latin America, select Middle East locations | Medium term (2–4 years) |
| Consolidation toward end-to-end one-stop CDMOs | 0.9% | Global, with M&A activity concentrated in North America & Europe | Short term (≤ 2 years) |
| Ai-enabled rapid process-development platforms | 0.7% | North America & Europe early adoption; Asia-Pacific following | Medium term (2–4 years) |
| GLP-1 and peptide HPAPI capacity build-outs | 1.1% | Europe (Switzerland, Germany), North America, India | Short term (≤ 2 years) |
| Source: Mordor Intelligence | |||
Outsourcing Volume Growth Among Large Pharmaceutical Companies
Big pharma is increasing R&D budgets and selectively offloading non-core or early-phase work to partners that provide consultative chemistry, manufacturing, and controls expertise. Sponsors that accept milestone-based fee models and co-investment structures lock in multi-year capacity, giving CDMOs predictable cash flow even as internal manufacturing footprints expand. The approach shields innovators from fixed-asset risk yet keeps critical late-stage or high-volume products in-house. Therefore, demand remains firm for mid-scale capacity that can flex with clinical attrition. CDMOs unable to support collaborative models face margin pressure as buyers consolidate vendor lists to improve oversight. Continued upticks in R&D intensity suggest the volume of externalized projects will keep pace with overall pipeline growth through the medium term.
Surge in Biologics and Complex-Molecule Pipelines
Antibody-drug conjugates, therapeutic peptides, and next-generation modalities dominate new clinical entries. Samsung Biologics commissioned Plant 5 in 2025, raising installed capacity to 784,000 liters, and is already evaluating a sixth plant in anticipation of sustained demand. The FDA issued Chemistry, Manufacturing, and Controls flexibilities for cell and gene therapies in January 2025, shortening dossier preparation and accelerating CDMO onboarding.[1]U.S. Food and Drug Administration, “Quality Management System Regulation,” FDA, fda.gov Technical hurdles such as site-specific conjugation and ultra-low occupational exposure limits for payloads reduce the viable supplier pool, enabling premium pricing. Backlogs in high-titer lentiviral vectors and mRNA push sponsors to reserve suites years ahead of launch. As clinical failure rates winnow projects, CDMOs that can redeploy assets rapidly will mitigate utilization drag.
Cost and Speed Edge in Emerging Markets
The BIOSECURE Act has prompted some United States sponsors to pivot away from certain Chinese plants, opening the door for Indian, Singaporean, and Eastern European facilities. Indian providers cite six- to nine-month timelines for small-molecule scale-up, compared with 12-plus months at many Western sites. This advantage resonates with venture-funded biotech seeking to reach IND filing quickly. Middle Eastern governments also court investment to raise local self-sufficiency in medicine, though infrastructure and regulatory depth vary. Cost arbitrage remains meaningful, yet freight disruptions and geopolitical friction prompt sponsors to evaluate dual-sourcing even when unit prices rise. The resulting hub-and-spoke footprints balance speed, price, and resilience.
Consolidation Toward End-to-End CDMOs
Novo Holdings’ purchase of Catalent and Blue Wolf Capital’s creation of Meribel Pharma Solutions exemplify the strategic premium placed on integrated platforms that reduce tech-transfer delays. Single-source accountability reduces the transition time between development and commercial phases by 6 to 12 months, an interval worth tens of millions of dollars in lost revenue for high-value drugs. Private equity ownership often offers flexible commercial terms, such as tiered royalties and dedicated suite financing, that align CDMO incentives with clinical success. While larger players can amortize quality-management overhead across many programs, specialists maintain relevance in niche modalities where depth beats breadth. The M&A pipeline shows no sign of easing in the near term, as capacity gaps and a shortage of skilled labor lift valuations.
Restraints Impact Analysis*
| RESTRAINT | (~) % IMPACT ON CAGR FORECAST | GEOGRAPHIC RELEVANCE | IMPACT TIMELINE |
|---|---|---|---|
| Stringent multi-region regulatory requirements | -0.8% | Global, with highest compliance burden in North America, Europe, and Japan | Long term (≥ 4 years) |
| Capacity-utilization and lead-time risk | -0.6% | Global, acute in sterile fill-finish and biologics segments | Short term (≤ 2 years) |
| High capex for sterile biologics suites | -0.5% | North America & Europe primarily; emerging in Asia-Pacific | Medium term (2–4 years) |
| Scarcity of skilled aseptic-manufacturing talent | -0.4% | Global, most severe in North America and Western Europe | Medium term (2–4 years) |
| Source: Mordor Intelligence | |||
Stringent Multi-Region Regulatory Requirements
The FDA Quality Management System Regulation takes effect in February 2026 and obliges combination-product manufacturers to align documentation with ISO 13485.[2]U.S. Food and Drug Administration, “CMC Information for Cell and Gene Therapy IND Applications,” FDA, fda.govThe European Medicines Agency tightened Annex 1 contamination-control rules in 2024, forcing upgrades that can cost EUR 5 million to EUR 15 million per site.[3]EMA. "Annex 1 Sterile Manufacturing Guidelines," www.ema.europa.eu Japan’s PMDA added expanded stability-testing demands in 2025, elongating approval timelines and adding analytical cost. Maintaining parallel systems across authorities stresses mid-tier CDMOs, while larger groups spread compliance overhead across bigger revenue bases. Sponsors favor partners that already hold multi-region licenses, which exacerbates consolidation trends.
Capacity-Utilization and Lead-Time Risk
Sterile fill-finish slots are sold out 12–24 months ahead, pushing drug owners to book multiple vendors or delay launches. Oncomed’s third syringe line in early 2025 added over 100 million units a year but was allocated on day one. Viral-vector suites show the opposite problem: programs that fail in Phase I leave capacity idle, stranding capital. Modular cleanrooms and single-use systems help, yet cannot fully absorb volatility when demand spikes. Sponsors now negotiate contingent capacity fees to keep options open, elevating working-capital burdens for CDMOs. Until additional sterile plants reach GMP readiness, bottlenecks will continue to temper overall growth.
*Our forecasts treat driver/restraint impacts as directional, not additive. The impact forecasts reflect baseline growth, mix effects, and variable interactions.
Segment Analysis
By Service: Fill-Finish Bottlenecks Drive Dosage-Form Growth
Finished-dosage development and manufacturing is projected to record the quickest 9.01% CAGR as sponsors jostle for pre-filled syringe and vial capacity. Sterile lead times already run 12–24 months, channeling premium pricing to providers that can expand quickly. API development, which commanded 61.09% of the pharmaceutical CDMO 2.0 market share in 2025, remains the volume anchor. Yet margins face pressure as more drug owners dual-source to manage geopolitical and supply chain risks. Analytical and testing tasks grow as regulatory agencies demand greater stability and release packages. At the same time, packaging and logistics units benefit from tailwinds from serialization mandates under the United States Drug Supply Chain Security Act. Smaller biotech companies lacking internal CMC teams depend on CDMOs for formulation and IND-enabling studies, deepening service stickiness.
The influence of capacity shortages has increased innovators' willingness to sign multi-year take-or-pay deals that guarantee access to isolators and automated visual inspection platforms. CDMOs that bundle fill-finish, secondary packaging, and cold-chain logistics present a one-stop pathway that shortens commercialization by several months. As a result, the pharmaceutical CDMO 2.0 market generates higher blended revenue per batch than in the pre-COVID era, offsetting inflation in labor and energy.


By Molecule Type: HPAPI Complexity Commands Fastest Growing
Small-molecule programs accounted for 65.21% of the pharmaceutical CDMO 2.0 market in 2025, reflecting the enduring dominance of orally dosed assets. Growth momentum, however, shifts to highly potent APIs, forecast to post an 8.12% CAGR on the back of antibody-drug conjugate payloads and metabolic peptides. Occupational exposure requirements below 10 ng/m³ restrict supply to a compact set of plants with advanced containment suites, giving those providers pricing power. Special analytics, such as drug-to-antibody ratio testing, further differentiate suppliers and add service revenue.
Large-molecule output benefits from Samsung Biologics’ collective 784,000-liter footprint and from AGC Biologics’ 5,000-liter single-use reactors scheduled to come online in 2027. Cell and gene therapy creates bifurcation: entry-level viral-vector capacity is oversupplied while late-stage, high-titer production remains scarce. CDMOs that can flex suites between mammalian expression, mRNA, and viral platforms enjoy superior utilization and cross-sell opportunities.
By Development Phase: Biotech Funding Revival Accelerates Phase II
Phase III orders accounted for 32.90% of revenue in 2025, driven by longer campaigns and validation batches. Renewed venture funding is now lifting Phase II demand at an 8.20% CAGR, as sponsors move candidates stalled during the 2022–2023 funding dip back into the clinic. Preclinical volumes build on the success of AI-driven route scouting, which trims process-development cycles by 20–30%. Commercial manufacturing grows more slowly because large pharma selectively repatriates top-selling assets into captive plants. Even so, CDMOs secure royalties or volume-based rebates on programs they help bring to market, a model that diversifies revenue and raises enterprise valuations.
By End User: Virtual Pharma Drives Strategic Partnership Models
Large pharma accounted for 42.97% of spending in 2025, and its 8.43% CAGR reflects a pivot toward risk-sharing contracts that include milestone and royalty payments. The approach mirrors biotech financing structures and aligns factory output with clinical success. Generics and specialty producers outsource to free resources for high-value reformulations, while virtual biotech firms lean almost entirely on CDMOs to run CMC workstreams. Providers that offer regulatory strategy and commercial-launch consulting gain stickiness, as smaller sponsors rarely possess those skills. The pharmaceutical CDMO 2.0 market, therefore, sees deepening integration that spans from medicinal chemistry to post-approval lifecycle management.
Geography Analysis
North America accounted for 40.25% of revenue in 2025, driven by the BIOSECURE Act, which steers contracts toward local and allied facilities. FUJIFILM is building a USD 3.2 billion biologics and mRNA campus in Holly Springs, North Carolina, that will come online in 2028. Resilience added USD 225 million of peptide capacity at its Ohio site to ease GLP-1 shortages. Thermo Fisher’s Patheon unit is promoting digital batch recording and predictive maintenance as competitive levers, reflecting a shift in buyer preference toward data-rich manufacturing partners. Mexico is capturing nearshoring interest for secondary packaging and regional distribution, thanks to simplified logistics and low tariffs.
Europe consolidated aggressively during 2025. Blue Wolf combined Synerlab and former Recipharm facilities into Meribel Pharma Solutions, generating a 13-site network with strengths in lyophilization and preservative-free technologies. Almac opened a 100,000-square-foot potent oral-dose plant in Northern Ireland to absorb oncology demand. Germany’s Aenova increased its blister and effervescent capacity, confirming a stable appetite for traditional dosage forms even as biologics scale up. The update to Annex 1 raised capital outlays across the region and standardized contamination-control expectations, simplifying multi-country tech transfers.
Asia-Pacific is on the fastest 9.78% CAGR track through 2031. Samsung Biologics’ record KRW 2.1 trillion contract in 2024 focused on capacity expansion in South Korea, while Indian CDMOs saw double-digit top-line growth as Western customers diversified their supply chains. AGC Biologics is enhancing its Yokohama site with single-use reactors, bringing advanced mammalian capabilities to Japan. Singapore and Malaysia pitch stable policies and tax incentives, though land costs and the availability of skilled labor temper the pace of build-outs. China remains vital to domestic demand, yet U.S. policy risk pushes multinational sponsors to adopt a “China-plus-one” strategy that reallocates part of the portfolio elsewhere.
South America’s market focuses on Brazil, where the national regulator, ANVISA, harmonized with ICH guidelines in 2024, shortening pathways for foreign CDMOs. Currency instability in Argentina complicates capex plans, but a skilled workforce and legacy API infrastructure offer cost-sensitive advantages. Regional governments promote local fill-finish to reduce import dependence, though limited cold-chain networks constrain the distribution of biologics.

Competitive Landscape
The pharmaceutical CDMO 2.0 market remains moderate. Lonza, Catalent (now under Novo Holdings), Samsung Biologics, Piramal Pharma Solutions, and Recipharm account for a meaningful, though not dominant, slice of global billings. Novo Holdings paid USD 16.5 billion for Catalent, a valuation supported by its late-stage biologics capacity and integrated fill-finish capabilities. Blue Wolf’s Meribel platform shows private equity appetite for mid-scale networks that deliver regional nimbleness without mega-provider complexity. Strategic buyers emphasize digital quality systems and flexible suites that can pivot from small molecules to biologics as pipelines evolve.
Price competition is intense in small-molecule commodity APIs, where Indian and Chinese plants retain cost leadership. By contrast, high-potency and biologics niches favor incumbents with containment or large-scale stainless assets. Several groups now negotiate royalty streams, dedicated-suite financing, or even equity stakes in exchange for long-term volume, blurring the line between contract service and joint venture. The shortage of trained aseptic operators constrains rapid greenfield expansion, which lifts the valuations of existing assets.
Looking ahead, mid-tier specialists may merge to match the geographic reach and service breadth that top-tier customers now expect. CDMOs that invest in AI-enabled process tuning and real-time release testing will secure premium engagements, while lagging plants risk relegation to price-sensitive generic payloads.
Pharmaceutical CDMO 2.0 Industry Leaders
-
Lonza Group AG
-
Novo Holdings A/S (Catalent Inc.)
-
Piramal Pharma Solutions
-
Samsung Biologics
-
Siegfried Holding AG
- *Disclaimer: Major Players sorted in no particular order

Recent Industry Developments
- April 2026: Eurofins CDMO Alphora has expanded its Active Pharmaceutical Ingredient (API) manufacturing capabilities by incorporating advanced, custom-designed Continuous Flow (CF) technology into its operations. This project is supported by advisory services and research and development funding from the National Research Council of Canada Industrial Research Assistance Program (NRC IRAP).
- April 2025: Artis BioSolutions acquired Landmark Bio, expanding its end-to-end CDMO platform for advanced therapies; Landmark Bio will continue operating in Watertown, Massachusetts, supporting translational research, process development, and manufacturing for cell and gene therapies. The acquisition reflects Oak HC/FT's strategy to build integrated advanced-therapy manufacturing capacity in North America.
- March 2025: CordenPharma unveiled a greenfield peptide facility in Muttenz, Switzerland, with investment exceeding EUR 500 million (USD 545 million), featuring solid-phase peptide synthesis reactor capacity over 5,000 liters, advanced automation, and construction scheduled for 2025–2027 with commercial operations beginning in the first half of 2028.
- March 2025: Almac Group opened a 100,000-square-foot commercial oral solid dose manufacturing facility in Craigavon, Northern Ireland, part of a cumulative investment exceeding GBP 400 million (USD 510 million) that supports potent and highly potent therapies with partner-installed dedicated technology. The facility addresses demand for high-containment manufacturing and flexible capacity models.


Global Pharmaceutical CDMO 2.0 Market Report Scope
As per the scope of the report, a pharmaceutical CDMO 2.0 market refers to specialized contract development and manufacturing services that support the entire lifecycle of antibody-drug conjugates (ADCs). These complex oncology therapeutics combine a monoclonal antibody with a cytotoxic payload. These services cover everything from early-stage development to commercial-scale production.
The pharmaceutical CDMO 2.0 market is segmented by service, molecule type, development phase, end-use, and geography. By service, the market is segmented into API development & manufacturing, finished-dosage development & manufacturing, analytical & testing services, packaging & logistics, and other services. By molecule type, the market is segmented into small molecules, large molecules/biologics, and highly potent APIs. By development phase, the market is segmented into pre-clinical, phase I, phase II, phase III, and commercial. By end user, the market is segmented into large pharma, emerging / venture-backed biotech, generics/specialty pharma, and virtual pharma & tech-bio. By geography, the market is segmented into North America, Europe, Asia-Pacific, the Middle East and Africa, and South America. The market report also covers estimated market sizes and trends for 17 countries across major regions worldwide. The report offers market size and forecasts in value (USD) for the above segments.
| API Development & Manufacturing |
| Finished-Dosage Development & Manufacturing |
| Analytical & Testing Services |
| Packaging & Logistics |
| Other Services |
| Small Molecule |
| Large Molecule / Biologics |
| Highly-Potent APIs |
| Pre-clinical |
| Phase I |
| Phase II |
| Phase III |
| Commercial |
| Large Pharma |
| Emerging / Venture-backed Biotech |
| Generics / Specialty Pharma |
| Virtual Pharma & Tech-bio |
| North America | United States |
| Canada | |
| Mexico | |
| Europe | United Kingdom |
| Germany | |
| France | |
| Italy | |
| Spain | |
| Rest of Europe | |
| Asia-Pacific | China |
| India | |
| Japan | |
| South Korea | |
| Australia | |
| Rest of Asia-Pacific | |
| Middle East and Africa | GCC |
| South Africa | |
| Rest of Middle East and Africa | |
| South America | Brazil |
| Argentina | |
| Rest of South America |
| By Service | API Development & Manufacturing | |
| Finished-Dosage Development & Manufacturing | ||
| Analytical & Testing Services | ||
| Packaging & Logistics | ||
| Other Services | ||
| By Molecule Type | Small Molecule | |
| Large Molecule / Biologics | ||
| Highly-Potent APIs | ||
| By Development Phase | Pre-clinical | |
| Phase I | ||
| Phase II | ||
| Phase III | ||
| Commercial | ||
| By End User | Large Pharma | |
| Emerging / Venture-backed Biotech | ||
| Generics / Specialty Pharma | ||
| Virtual Pharma & Tech-bio | ||
| By Geography | North America | United States |
| Canada | ||
| Mexico | ||
| Europe | United Kingdom | |
| Germany | ||
| France | ||
| Italy | ||
| Spain | ||
| Rest of Europe | ||
| Asia-Pacific | China | |
| India | ||
| Japan | ||
| South Korea | ||
| Australia | ||
| Rest of Asia-Pacific | ||
| Middle East and Africa | GCC | |
| South Africa | ||
| Rest of Middle East and Africa | ||
| South America | Brazil | |
| Argentina | ||
| Rest of South America | ||


Key Questions Answered in the Report
What is the current value of the pharmaceutical CDMO 2.0 market?
The pharmaceutical CDMO 2.0 market size stands at USD 186.65 billion in 2026.
How fast is the sector growing?
Market revenue is projected to increase at a 7.89% CAGR between 2026 and 2031.
Which service segment is expanding the quickest?
Finished-dosage development and manufacturing is forecast to grow at 9.01% a year through 2031, driven by sterile fill-finish demand.
Why are highly potent APIs gaining traction?
Oncology peptides and antibody-drug conjugate payloads need advanced containment suites, pushing HPAPI revenue at an 8.12% CAGR.
Which region shows the highest future growth?
Asia-Pacific is expected to post the fastest 9.78% CAGR due to large investments in India and South Korea.
How are big pharma companies engaging with CDMOs today?
Large pharma increasingly forms risk-sharing partnerships that include milestone payments, co-investment in capacity, and sometimes royalty streams.
Page last updated on:


