
Petrochemical Market Size and Share
Market Overview
| Study Period | 2021 - 2031 |
|---|---|
| Market Size (2026) | USD 722.12 Billion |
| Market Size (2031) | USD 964.31 Billion |
| Growth Rate (2026 - 2031) | 5.96 % |
| Fastest Growing Market | Middle East and Africa |
| Largest Market | Asia-Pacific |
| Market Concentration | Low |
Major Players *Disclaimer: Major Players sorted in no particular order Image © Mordor Intelligence. Reuse requires attribution under CC BY 4.0. | |
Petrochemical Market Analysis by Mordor Intelligence
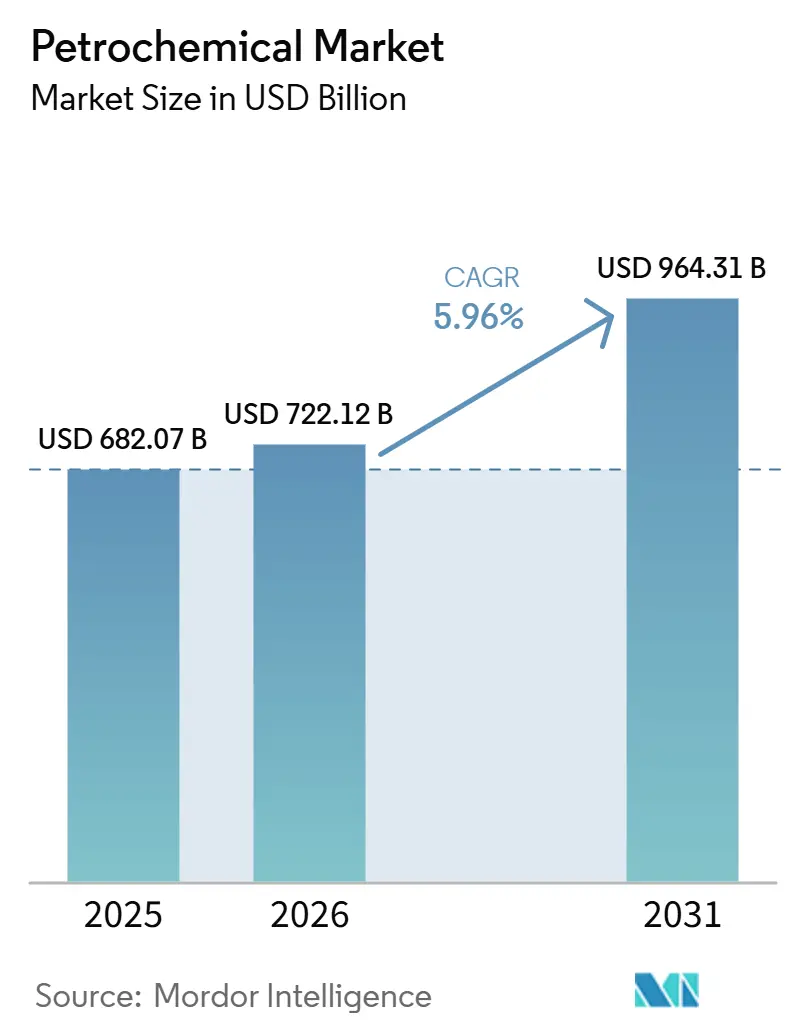
The Petrochemical Market size was estimated at USD 682.07 billion in 2025 and is estimated to grow from USD 722.12 billion in 2026 to USD 964.31 billion by 2031, at a CAGR of 5.96% during the forecast period (2026-2031). The petrochemical market is supported by packaging supply chains, construction activity in emerging economies, and pharmaceutical value chains. Integrated refinery-to-chemicals complexes are increasing the chemical yield from crude oil. Methanol-to-olefins technology is expanding olefin production beyond naphtha-based routes. Sustainability requirements are driving greater use of recycled and bio-based inputs across the petrochemical market. Regional cost differences are directing capital toward feedstock-advantaged and integrated assets.
Key Report Takeaways
- By feedstock, naphtha held 42.83% of the petrochemical market share in 2025, while recycled and renewable feedstocks are projected to grow at an 11.82% CAGR through 2031.
- By product, ethylene accounted for 28.77% of the petrochemical market size in 2025, while methanol is forecast to grow at a 7.84% CAGR through 2031.
- By manufacturing process, steam cracking accounted for 54.62% of production capacity in 2025, while renewable and circular feedstock routes are forecast to grow at a 12.16% CAGR through 2031.
- By end-user industry, packaging accounted for 31.48% of global output in 2025, while healthcare and pharmaceuticals are forecast to grow at a 7.33% CAGR through 2031.
- By geography, Asia-Pacific held 52.64% of global output in 2025, while Middle-East and Africa are projected to grow at a 6.92% CAGR through 2031.
Note: Market size and forecast figures in this report are generated using Mordor Intelligence’s proprietary estimation framework, updated with the latest available data and insights as of January 2026.
Market Trends and Insights
Drivers Impact Analysis of Petrochemical Market*
| Drivers | (~) % Impact on CAGR Forecast | Geographic Relevance | Impact Timeline |
|---|---|---|---|
| Lightweight Packaging Materials and Plastic Substitution | +1.8% | Global, strongest in Asia-Pacific and North America | Short term (≤ 2 years) |
| Manufacturing and Infrastructure Development in Emerging Economies | +1.5% | Asia-Pacific, with spillover to Middle-East and Africa, and South America | Medium term (2-4 years) |
| Integrated Refinery-to-Chemicals Complex Investment | +1.0% | China, Saudi Arabia, India, and Kuwait | Long term (≥ 4 years) |
| Methanol-to-Olefins Technology and Low-Carbon Marine Fuels | +0.7% | China for MTO, global for marine fuels | Medium term (2-4 years) |
| Feedstock Flexibility from Shale Gas and Alternative Hydrocarbons | +0.6% | North America, with spillovers to Europe and Northeast Asia | Short term (≤ 2 years) |
| Source: Mordor Intelligence | |||
Growing Demand for Lightweight Packaging Materials and Plastic Substitution
Packaging remains a stable source of demand for the petrochemical market, serving the food, beverage, pharmaceutical, and logistics supply chains. Polyethylene, polypropylene, and PET derivatives are used in flexible films, rigid containers, and multi-layer barrier laminates, where they protect products and support transport efficiency. Packaging formats are shifting toward thinner, mono-material designs that are easier to recycle without compromising barrier and durability performance. These designs require polymers with more demanding technical specifications, which can increase value per kilogram of resin processed. Technip Energies, Alterra, and Neste reported that plastics production reached 431 million metric tons in 2024, while circularity did not keep pace with consumption growth. This gap supports demand for advanced recycling and certified recycled-content polymers, particularly where food-contact and pharmaceutical purity standards limit the use of mechanically recycled material and create a need for verified circular inputs with consistent quality.
Expanding Manufacturing Activities and Infrastructure Development in Emerging Economies
Infrastructure construction in India, Southeast Asia, and sub-Saharan Africa supports demand for thermoplastic pipes, PVC profiles, polymer-modified coatings, rigid insulation, and other durable construction inputs. This demand is tied to construction activity and public infrastructure investment rather than short-term consumer spending. In October 2025, BPCL and Oil India Limited signed a non-binding memorandum to develop a USD 11 billion refinery and petrochemical complex near Ramayapatnam, Andhra Pradesh. The project includes a 1.5 million metric tons per year ethylene cracker, the first in southern India, and targets commercial operations by 2030. New Chinese integrated capacity is also adding derivative supply that can pressure regional spot prices while providing lower-cost input channels for downstream processors. The petrochemical market, therefore, remains tied to domestic hydrocarbon use, import substitution, and industrial development policies across several emerging economies, where local supply security and value-added processing are increasingly important policy objectives.
Increasing Investments in Integrated Refinery-to-Chemicals Complexes
Integrated refinery-to-chemicals facilities target chemical yields of 50% to 80% of crude oil input, compared with 15% to 25% in conventional refinery-fuels configurations. This model can improve value per barrel by directing more of the crude stream toward chemical intermediates rather than transport fuels. Sinopec RIPP has licensed 6 refinery-to-chemicals units in China with a combined capacity of 17.4 million metric tons per year[1]Sinopec Research Institute of Petroleum Processing, “Resid to Chemicals Technology,” Sinopec RIPP Technical Solutions, sinopec.com. Saudi Aramco and SABIC have set targets for chemical yields above 70% in their crude-oil-to-chemicals program as part of the Kingdom's broader downstream strategy. These projects reduce delivered ethylene and propylene costs relative to standalone crackers and distribute feedstock risk between hydrocarbon suppliers and processing hubs. They also concentrate large-capacity additions in the petrochemical market among state-backed or highly integrated operators with the capital and execution capacity for multi-billion-dollar projects, complex refinery integration, and extended periods before achieving commercial returns.
Rising Adoption of Methanol-to-Olefins Technology and Low-Carbon Marine Fuels
Methanol-to-olefins (MTO) technology converts methanol into ethylene, propylene, and water at lower temperatures than conventional steam cracking. It can adjust the ethylene-to-propylene output ratio without changing feedstock blends, giving operators greater flexibility to respond to downstream demand shifts. China's MTO capacity consumes 30-33 million metric tons of methanol feedstock per year, making methanol an important part of the petrochemical market in China and a major route for coal-to-chemicals conversion. Methanol also serves as a marine fuel as vessel operators work toward International Maritime Organization decarbonization goals. The combination of chemical and marine demand supports new methanol investments through 2031 and strengthens the economics of multi-pathway methanol facilities that can serve chemical, fuel, and technology-licensing demand.
Restraints Impact Analysis of Petrochemical Market*
| Restraints | (~) % Impact on CAGR Forecast | Geographic Relevance | Impact Timeline |
|---|---|---|---|
| Crude Oil, Natural Gas, and Feedstock Price Volatility | -1.2% | Global, most acute in Europe and Northeast Asia | Short term (≤ 2 years) |
| Carbon Emissions, Plastic Waste, and Environmental Regulations | -0.8% | European Union and regions exporting to the European Union are gradually globalizing | Medium term (2-4 years) |
| Capital Requirements and Project Approval Timelines | -0.5% | Global | Long term (≥ 4 years) |
| Source: Mordor Intelligence | |||
Volatility in Crude Oil, Natural Gas, and Petrochemical Feedstock Prices
Feedstock cost volatility remains a persistent margin risk for the petrochemical market, particularly where crackers are tied to crude-linked naphtha or liquefied petroleum gas (LPG) and sell under quarterly contracts. Crude oil price changes can affect naphtha and LPG costs within weeks, leaving producers little time to adjust contract pricing. The International Energy Agency stated in May 2026 that petrochemical feedstock availability had become increasingly constrained amid Middle-East supply disruptions. It also reported that the petrochemical sector recorded the steepest demand-side losses among oil-consuming industries during the disruption cycle. Rising U.S. ethane exports can tighten domestic natural gas liquids supply over time and narrow a long-standing North American cost advantage. Producers are responding with multi-feed crackers, co-processing pyrolysis oil, and ethane import options rather than fixed single-feedstock configurations.
Stringent Carbon Emission, Plastic Waste, and Environmental Regulations
The European Union Carbon Border Adjustment Mechanism entered its financial-obligation phase on January 1, 2026. It requires authorized declarants to purchase and surrender certificates for embedded emissions in covered imports, thereby imposing a direct compliance cost on relevant third-country exporters[2]European Union, “Regulation EU 2023/956 Establishing a Carbon Border Adjustment Mechanism,” EUR-Lex, eur-lex.europa.eu. A study in Nature Sustainability found that the existing framework accounts for 39% to 60% of greenhouse gas emissions from ethylene and polyethylene production. The reported coverage gap is linked mainly to excluded fossil feedstocks and upstream refinery products, while the European Union has discussed downstream coverage for organic chemicals and polymers. In July 2026, INEOS signed a memorandum with Recuro for an advanced recycling facility in Bamble, Norway, capable of processing up to 33,000 metric tons per year of end-of-life plastic waste. Compliance and verified recycled content are becoming direct requirements for access to parts of the European petrochemical market.
*Our forecasts treat driver/restraint impacts as directional, not additive. The impact forecasts reflect baseline growth, mix effects, and variable interactions.
Petrochemical Market Segment Analysis
By Feedstock:
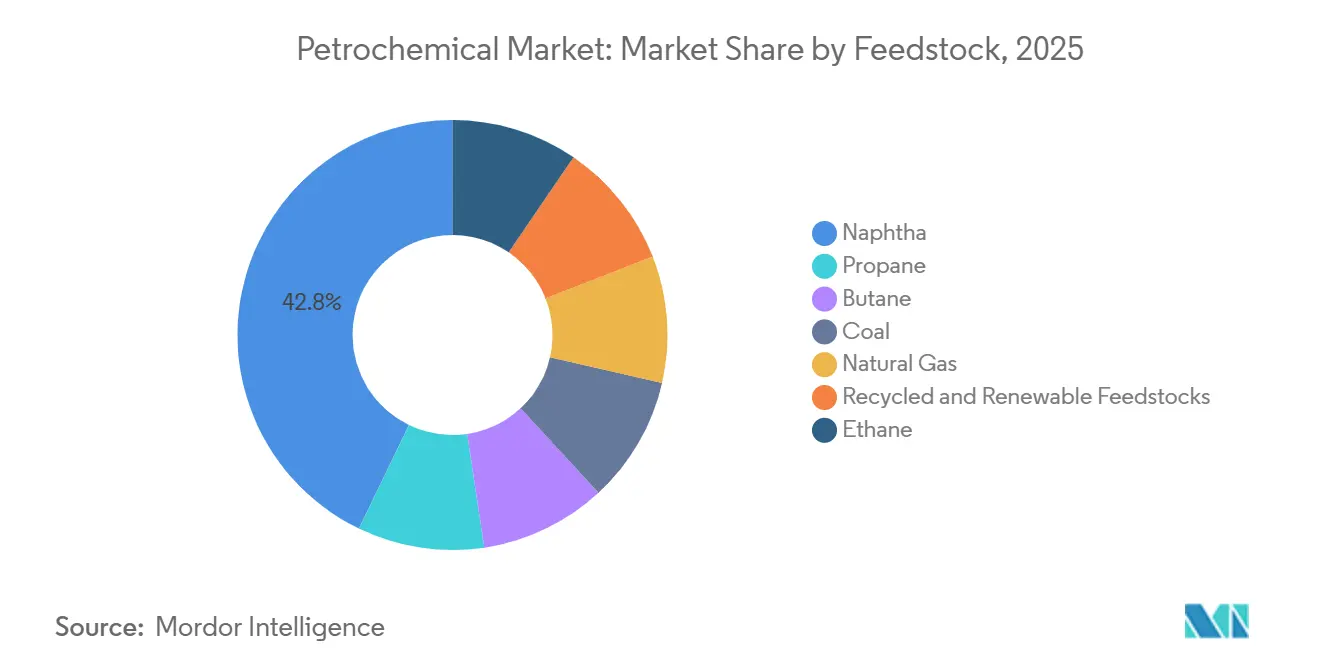
Circular Inputs Accelerate Structural TransitionNaphtha held 42.83% of the petrochemical market share in 2025, reflecting the installed base of steam crackers in Europe, Japan, and South Korea, where crude-linked processing systems represent decades of capital investment. These sites rely on established refining links, storage systems, and operating expertise that make naphtha the central feedstock for many mature chemical hubs. Ethane is the second-largest feedstock category and benefits from US shale natural gas liquids, while long-term supply arrangements are extending its use beyond North America and the Middle-East. The Energy Information Administration (EIA) expects US ethane exports to grow 16% in 2026, extending ethane's reach to overseas operators. Propane and butane give mid-sized crackers seasonal flexibility, while coal remains a key input for China's Coal-to-Methanol (CTM), Methanol-to-Olefins (MTO), and Methanol-to-Propylene (MTP) production corridor.
Recycled and renewable inputs are forecast to grow at an 11.82% CAGR through 2031. Their growth is linked to the commercial deployment of pyrolysis oil as a drop-in substitute for naphtha in existing crackers, as well as the use of bio-naphtha in certified mass-balance systems. BASF targeted 250,000 metric tons per year of recycled and waste-based raw materials from 2025. Clariant, Borealis, and SINTEF demonstrated a pyrolysis oil-upgrading pathway in March 2026 for high-quality polyolefin feedstocks. Research has also shown a route to convert polyethylene directly into ethylene and propylene with combined carbon yields of up to 79% without noble metals or external hydrogen. These developments broaden the pool of recycled feedstock and offer a longer-term response to mechanical recycling limitations in the petrochemical market.



By Product:
Methanol’s Dual Role Drives Fastest GrowthEthylene accounted for 28.77% of the petrochemical market size in 2025 because it is a precursor for polyethylene, ethylene oxide, vinyl chloride, and a broad range of commodity and specialty polymers. China continues to add ethylene capacity through large integrated projects that connect refining, cracking, and downstream polymer production. China National Petroleum Corporation (CNPC) commissioned the 1.2 million metric tons per year Dushanzi green ethylene project in July 2026. The project brought total complex capacity above 3 million metric tons per year and involved CNY 25.656 billion (USD 3.6 billion). Propylene is becoming less dependent on steam crackers because propane dehydrogenation and fluid catalytic cracking can produce it directly, while butadiene, benzene, xylene, and toluene retain demand across automotive, resin, polyester, and solvent applications.
Methanol is forecast to grow at a 7.84% CAGR through 2031, the highest rate among product categories. China's MTO and MTP base absorbs 30 to 33 million metric tons of methanol per year and has created the world's largest coal-to-chemicals conversion corridor. Demand from methanol-fueled vessels adds a second outlet for new supply as shipping companies seek lower-carbon fuel options. This dual use makes methanol relevant to both the petrochemical market and transport fuel planning, with implications for project financing and capacity utilization. Commodity aromatics face pressure from East Asian surplus capacity, although resin and polyester fiber demand in South and Southeast Asian processing markets continues to support their use.
By Manufacturing Process:
Circular Routes Post Highest Growth RateSteam cracking held 54.62% of global petrochemical production capacity in 2025. Its position reflects its ability to continuously produce ethylene and propylene from naphtha or ethane at large scale for integrated downstream plants. Fluid catalytic cracking remains a major source of refinery-linked propylene, while catalytic reforming supports the aromatics chain by converting naphtha into benzene, toluene, and xylene mixtures. Propane dehydrogenation is expanding in North America and China, where propane supplies are available, and buyers seek more dedicated propylene output. BASF inaugurated its world-scale Verbund site in Zhanjiang in March 2026, including a steam cracker integrated with multiple downstream products. These established technologies remain the base of the petrochemical market even as circular routes receive investment.
Renewable and circular feedstock routes are projected to grow at a 12.16% CAGR through 2031. The petrochemical market is adopting these routes through furnace retrofits, mass-balance systems, and new modular conversion projects. Refinity selected Zeton in July 2026 to design a 10,000 tons-per-year modular waste-plastics-to-olefins demonstration plant intended for replication alongside established steam crackers. Borealis invested EUR 4.5 million (USD 5.11 million) in furnace upgrades at its Porvoo site to process renewable and recycled inputs. MTO and MTP continue to add capacity in China, where coal economics can support utilization, although the coal-to-methanol pathway faces pressure from longer-term carbon-intensity commitments. Circular retrofits can reduce the capital burden compared with developing an entirely new conversion complex.
By End-User Industry:
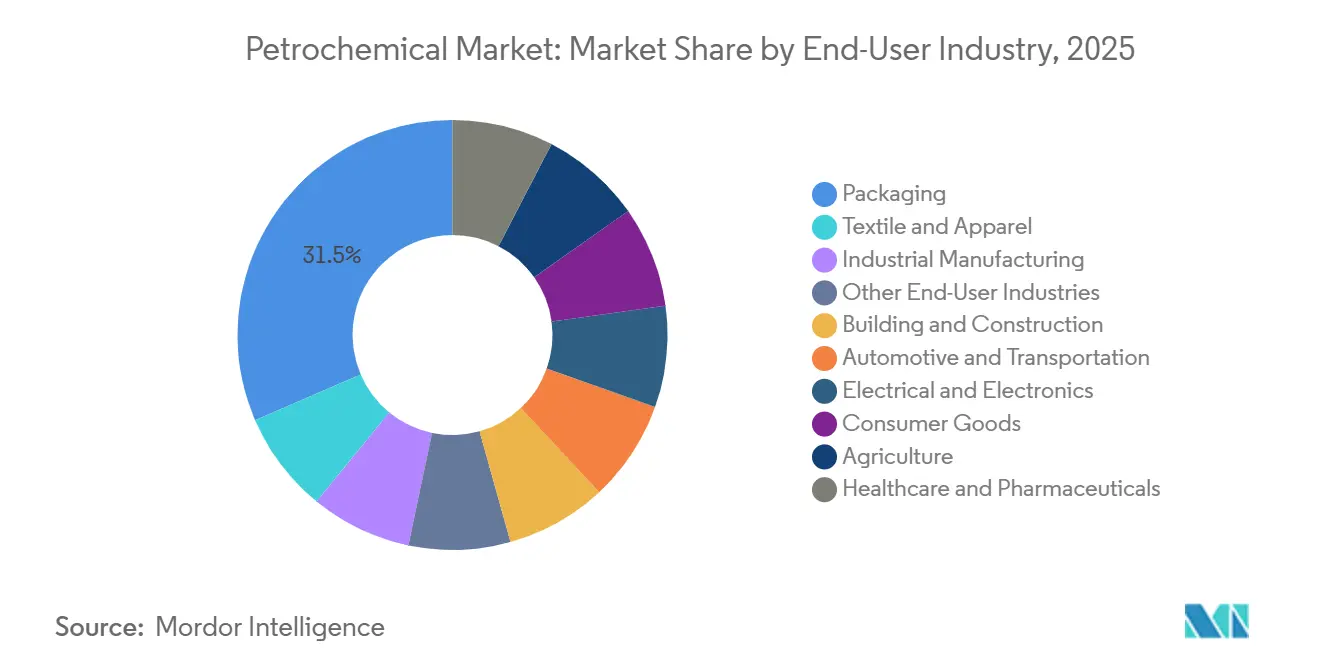
Healthcare Spending Drives Fastest Segment GrowthPackaging accounted for 31.48% of global petrochemical output in 2025. Its role spans flexible films, rigid containers, and barrier laminates used in food, beverage, pharmaceutical, and e-commerce logistics, where product protection and transport efficiency remain essential. Building and construction is the second-largest end-user group, using thermoplastic pipes, polyvinyl chloride (PVC) profiles, insulation foams, and polymer-modified sealants across long-life applications. Automotive demand is changing as electric vehicle platforms use more materials for battery enclosures, thermal management, and lightweight structures rather than conventional powertrain components. Electrical and electronics, consumer goods, agriculture, textiles, and manufacturing support further demand across the petrochemical market. This broad mix limits dependence on a single end-use cycle and links demand to consumer necessities, infrastructure programs, mobility changes, and industrial production across multiple regions.
Healthcare and pharmaceuticals are projected to grow at a 7.33% CAGR through 2031. Petrochemical inputs are used in active pharmaceutical ingredients, excipients, sterile barrier packaging, and specialty materials used in medical supply chains. The Asian Development Bank reported that pharmaceutical raw materials have molecular links to petrochemical precursors, including common analgesics, antibiotics, statins, and oncology treatments. Single-use biologics manufacturing requires polymer bags, tubing sets, and filtration assemblies that meet high purity requirements. These uses support demand for higher-value derivatives, while agriculture and textiles provide additional demand through fertilizer intermediates and synthetic fibers. The end-user mix supports the petrochemical market during slower periods, particularly across individual consumer and industrial applications.
Geography Analysis
APAC Petrochemical Market
Asia-Pacific accounted for 52.64% of global petrochemical output in 2025. China, India, South Korea, and Japan anchor the region's capacity and downstream demand through large refining, polymer processing, electronics, automotive, and construction value chains. China National Petroleum Corporation (CNPC)'s Dushanzi project established China's first inland ethylene base with a capacity of more than 3 million metric tons per year, while China holds more than 30% of global installed ethylene capacity, according to China Daily. India is expanding domestic capacity through planned integrated projects, while South Korea and Japan are rationalizing older naphtha-based assets as costs constrain cracker economics. BASF's Zhanjiang Verbund investment reflects a continued commitment to producing close to China's large downstream polymer base.
North America and Europe Petrochemical Market
North America benefits from shale-derived ethane, which gives regional producers a durable cost advantage over many naphtha-based operations. U.S. ethane exports are forecast to rise 16% in 2026 after 14% growth in 2025. Dow restarted construction on its USD 7.5 billion Path2Zero ethylene project in Alberta in January 2026, with Phase 1 targeted for late 2029. Europe is consolidating commodity olefins capacity as its naphtha-based assets face a weaker cost position. LyondellBasell completed the sale of 4 European olefins and polyolefins sites in May 2026, creating the Velogy platform. European operators are redirecting capital toward specialty polymers, circular chemistry, and value-added applications rather than commodity cracker capacity.
MEA and South America Petrochemical Market
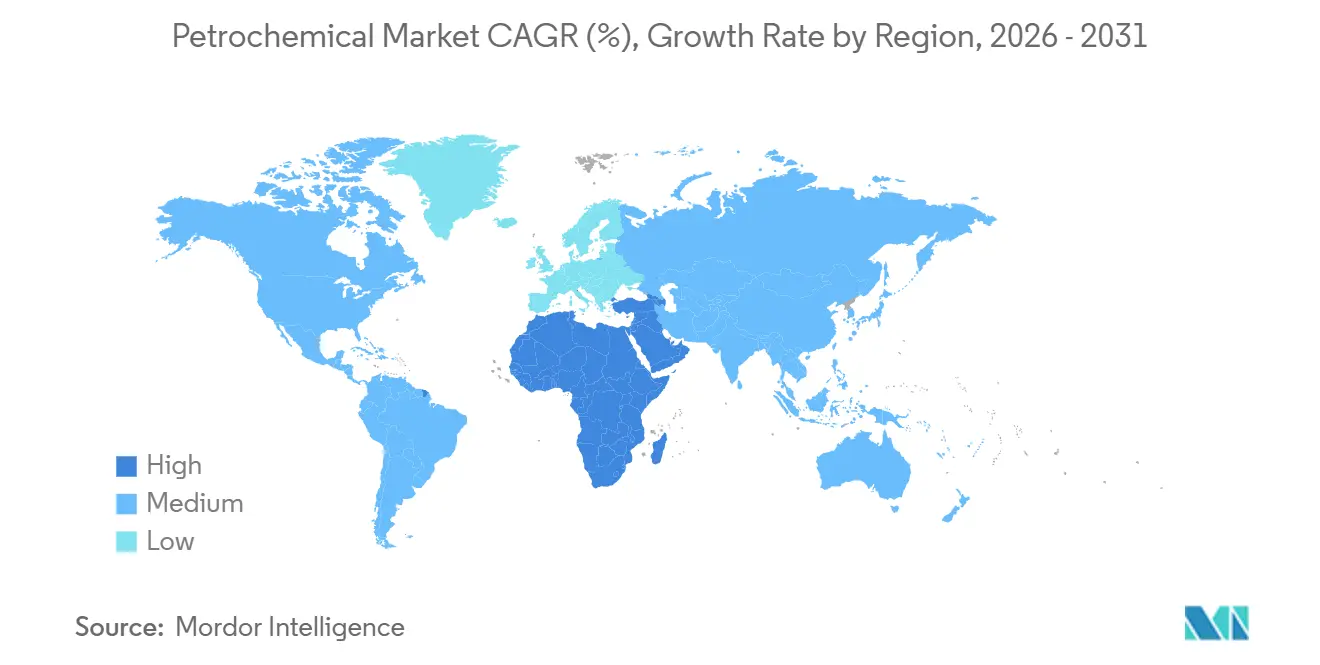
Middle-East and Africa are forecast to grow at a CAGR of 6.92% through 2031, the highest regional growth rate in the petrochemical market. Low-cost ethane supports margin advantages in Saudi Arabia, Kuwait, and Oman, where state-supported projects are expanding the conversion of local hydrocarbons into higher-value derivatives. In South America, Braskem approved BRL 4.2 billion (~USD 0.81 billion) for a 220,000 metric tons per year expansion of its Rio de Janeiro ethylene complex in October 2025, while Petrobras resumed petrochemical investment planning in June 2026. These projects indicate that regional production strategies are shaped by local feedstock availability, import substitution goals, and domestic demand for polymers and specialty chemicals.

Competitive Landscape
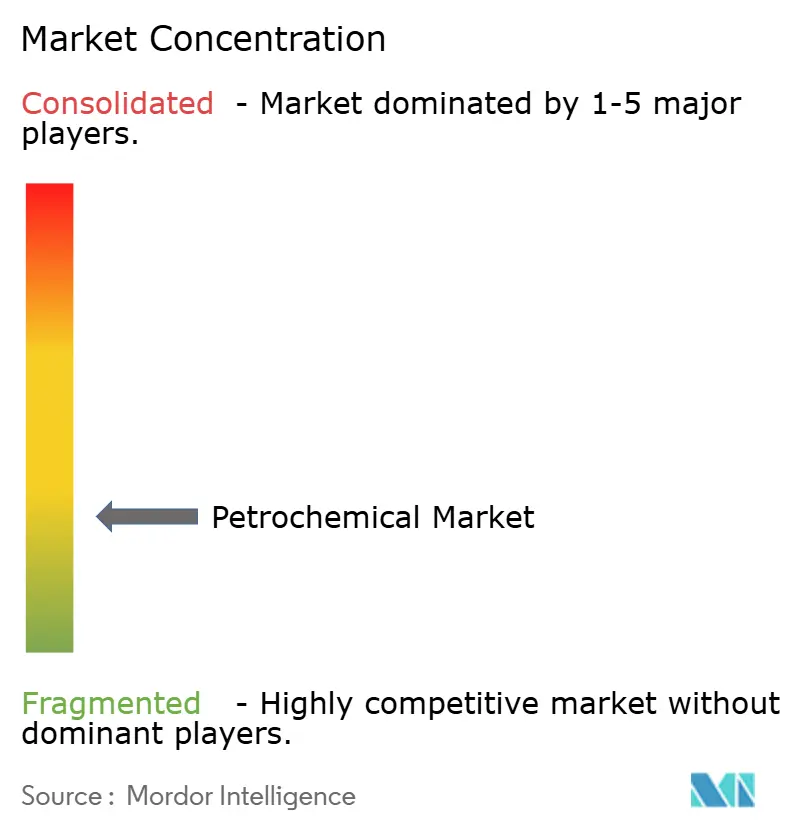
The petrochemical industry is moderately fragmented. BASF, Dow, LyondellBasell, SABIC, Sinopec, PetroChina, ExxonMobil, Shell, TotalEnergies, INEOS, and Reliance Industries hold significant installed capacity across major product chains and regions. Competition remains intense in commodity derivatives, as excess ethylene-based supply pressures margins even for large-scale producers. The American Chemical Society identified petrochemical overcapacity as a primary driver of industry earnings deterioration in 2025. Sinopec reported a USD 2.8 billion net loss, while BASF and Dow also recorded lower sales linked to their petrochemical businesses. The petrochemical market rewards regional cost advantage, integrated operations, and selective exposure to higher-value downstream products.
Middle-Eastern and North American producers are adding capacity using low-cost ethane, while European producers are reducing exposure to commodity olefins. LyondellBasell's sale of its European sites created an independent Velogy platform and altered the region's competitive structure. In November 2025, BASF and ExxonMobil agreed to jointly develop methane pyrolysis technology to advance lower-emission hydrogen production. Their planned Baytown demonstration plant is designed for 2,000 metric tons per year of low-emission hydrogen and 6,000 metric tons of solid carbon product. These developments reflect how established producers are balancing conventional capacity, feedstock advantage, and lower-emission technology options, and why strategies differ between regions with low-cost inputs and those facing higher carbon or energy costs.
Technology differentiation is becoming increasingly important in the petrochemical market. BASF has set a target of 250,000 metric tons per year of recycled and waste-based raw materials from 2025. LyondellBasell's Circulen platform covers mechanical recycling, advanced recycling, and bio-based feedstocks. In March 2026, Clariant, Borealis, and SINTEF demonstrated pyrolysis oil upgrading to virgin-quality polyolefin feedstock. These efforts focus on certified recycled-content supply chains, lower-carbon production, and verified material provenance, which may increase the importance of technology licensing alongside conventional cracker scale.
Petrochemical Industry Leaders
SABIC
China Petroleum & Chemical Corporation
Exxon Mobil Corporation
BASF
Dow
- *Disclaimer: Major Players sorted in no particular order
Petrochemical Market Companies Covered in this Report
- BASF
- Chevron Phillips Chemical Company LLC
- China Petroleum & Chemical Corporation
- Dow
- Exxon Mobil Corporation
- Formosa Plastics Corporation
- INEOS Group
- LG Chem
- LyondellBasell Industries N.V.
- PetroChina Company Limited
- Reliance Industries Limited
- SABIC
- Saudi Arabian Oil Company
- Shell
- Sumitomo Chemical Co., Ltd.
- TotalEnergies

Recent Industry Developments in Petrochemical Market
- July 2026: China National Petroleum Corporation commissioned a full-chain green, low-carbon ethylene project at the Dushanzi Petrochemical complex in Korla, Xinjiang, adding 1.2 million metric tons per year of ethylene capacity and bringing total complex capacity to over 3 million metric tons per year. The project involved an investment of CNY 25.656 billion (USD 3.6 billion) and incorporates renewable energy and carbon capture, reducing annual emissions by 1.37 million metric tons of carbon dioxide.
- July 2026: Tasnee and LyondellBasell's joint venture, Saudi Ethylene and Polyethylene Company (SEPC), completed a USD 500 million ethylene cracker expansion at Al-Jubail Industrial City, increasing olefins production by 18% from a nameplate ethylene capacity of 1 million metric tons per year. Trial production commenced upon completion of construction, expanding Saudi Arabia's integrated petrochemical base.


Global Petrochemical Market Report Scope
Petrochemicals are chemical products derived from petroleum and natural gas. Key types include olefins (such as ethylene and propylene), aromatics (such as benzene and toluene), and synthesis gas. They serve as the fundamental building blocks for a wide range of everyday products.
The petrochemical market is segmented by feedstock, product, manufacturing process, end-user industry, and geography. By feedstock, the market is segmented into naphtha, ethane, propane, butane, coal, natural gas, and recycled and renewable feedstocks. By product, the market is segmented into ethylene, propylene, butadiene, benzene, xylene, toluene, methanol, and other petrochemical products. By manufacturing process, the market is segmented into steam cracking, fluid catalytic cracking (FCC), catalytic reforming, methanol-to-olefins (MTO) and methanol-to-propylene (MTP), propane dehydrogenation (PDH), coal-to-methanol (CTM), and renewable and circular feedstock routes. By end-user industry, the market is segmented into packaging, building and construction, automotive and transportation, electrical and electronics, consumer goods, agriculture, healthcare and pharmaceuticals, textile and apparel, industrial manufacturing, and other end-user industries. The report also covers market size and forecasts for petrochemicals across 16 countries in major regions. The market sizes and forecasts are provided in terms of value (USD).
| Naphtha |
| Ethane |
| Propane |
| Butane |
| Coal |
| Natural Gas |
| Recycled and Renewable Feedstocks |
| Ethylene |
| Propylene |
| Butadiene |
| Benzene |
| Xylene |
| Toluene |
| Methanol |
| Other Petrochemical Products |
| Steam Cracking |
| Fluid Catalytic Cracking (FCC) |
| Catalytic Reforming |
| Methanol-to-Olefins (MTO) and Methanol-to-Propylene (MTP) |
| Propane Dehydrogenation (PDH) |
| Coal-to-Methanol (CTM) |
| Renewable and Circular Feedstock Routes |
| Packaging |
| Building and Construction |
| Automotive and Transportation |
| Electrical and Electronics |
| Consumer Goods |
| Agriculture |
| Healthcare and Pharmaceuticals |
| Textile and Apparel |
| Industrial Manufacturing |
| Other End-User Industries |
| Asia-Pacific | China |
| India | |
| Japan | |
| South Korea | |
| Rest of Asia-Pacific | |
| North America | United States |
| Canada | |
| Mexico | |
| Europe | Germany |
| United Kingdom | |
| France | |
| Italy | |
| Russia | |
| Rest of Europe | |
| South America | Brazil |
| Argentina | |
| Rest of South America | |
| Middle-East and Africa | Saudi Arabia |
| South Africa | |
| Rest of Middle-East and Africa |
| By Feedstock | Naphtha | |
| Ethane | ||
| Propane | ||
| Butane | ||
| Coal | ||
| Natural Gas | ||
| Recycled and Renewable Feedstocks | ||
| By Product | Ethylene | |
| Propylene | ||
| Butadiene | ||
| Benzene | ||
| Xylene | ||
| Toluene | ||
| Methanol | ||
| Other Petrochemical Products | ||
| By Manufacturing Process | Steam Cracking | |
| Fluid Catalytic Cracking (FCC) | ||
| Catalytic Reforming | ||
| Methanol-to-Olefins (MTO) and Methanol-to-Propylene (MTP) | ||
| Propane Dehydrogenation (PDH) | ||
| Coal-to-Methanol (CTM) | ||
| Renewable and Circular Feedstock Routes | ||
| By End-User Industry | Packaging | |
| Building and Construction | ||
| Automotive and Transportation | ||
| Electrical and Electronics | ||
| Consumer Goods | ||
| Agriculture | ||
| Healthcare and Pharmaceuticals | ||
| Textile and Apparel | ||
| Industrial Manufacturing | ||
| Other End-User Industries | ||
| By Geography | Asia-Pacific | China |
| India | ||
| Japan | ||
| South Korea | ||
| Rest of Asia-Pacific | ||
| North America | United States | |
| Canada | ||
| Mexico | ||
| Europe | Germany | |
| United Kingdom | ||
| France | ||
| Italy | ||
| Russia | ||
| Rest of Europe | ||
| South America | Brazil | |
| Argentina | ||
| Rest of South America | ||
| Middle-East and Africa | Saudi Arabia | |
| South Africa | ||
| Rest of Middle-East and Africa | ||


Key Questions Answered in the Report
What is current market size of Petrochemical Market?
The Petrochemical Market size was estimated at USD 682.07 billion in 2025 and is estimated to grow from USD 722.12 billion in 2026 to USD 964.31 billion by 2031, at a CAGR of 5.96% during the forecast period (2026-2031).
Which feedstock is growing fastest through 2031?
Recycled and renewable feedstocks are forecast to grow at an 11.82% CAGR, supported by pyrolysis oil co-processing and bio-based inputs.
Which product has the strongest projected growth rate?
Methanol has the highest projected growth rate among product categories, at a 7.84% CAGR through 2031.
Which production route is expanding most quickly?
Renewable and circular feedstock routes are forecast to grow at a 12.16% CAGR through 2031.
Page last updated on:





