Performance Testing Tools Market Size and Share
Market Overview
| Study Period | 2020 - 2031 |
|---|---|
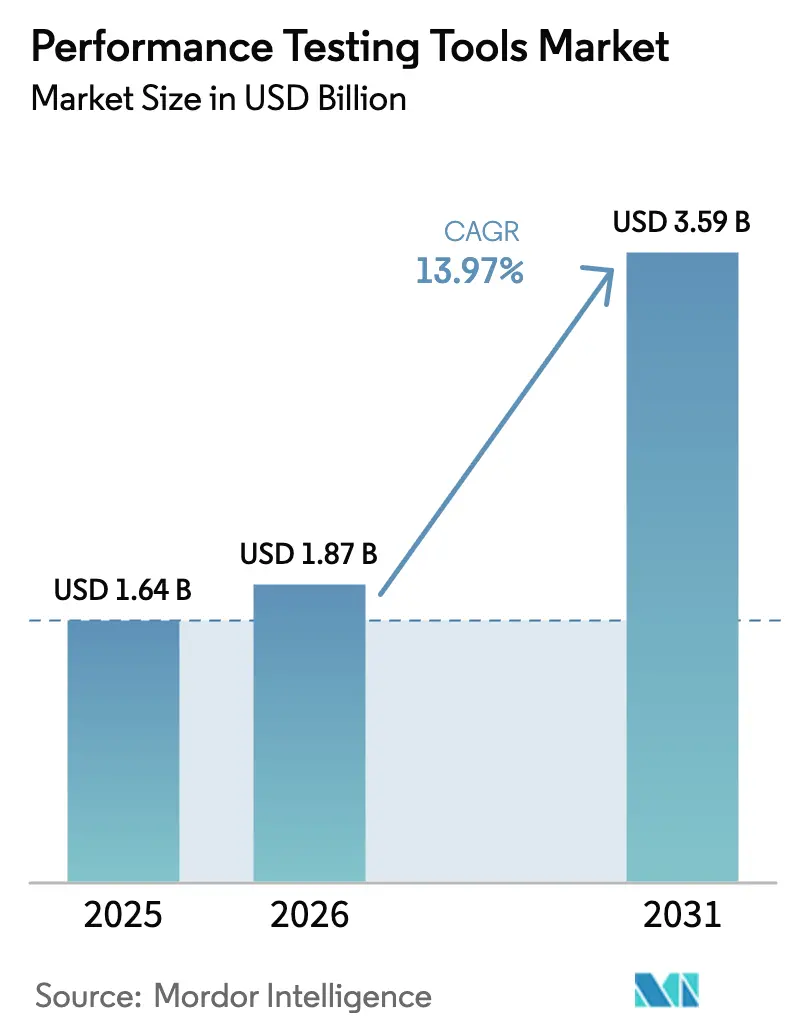
| Market Size (2026) | USD 1.87 Billion |
| Market Size (2031) | USD 3.59 Billion |
| Growth Rate (2026 - 2031) | 13.97% CAGR |
| Fastest Growing Market | Asia Pacific |
| Largest Market | North America |
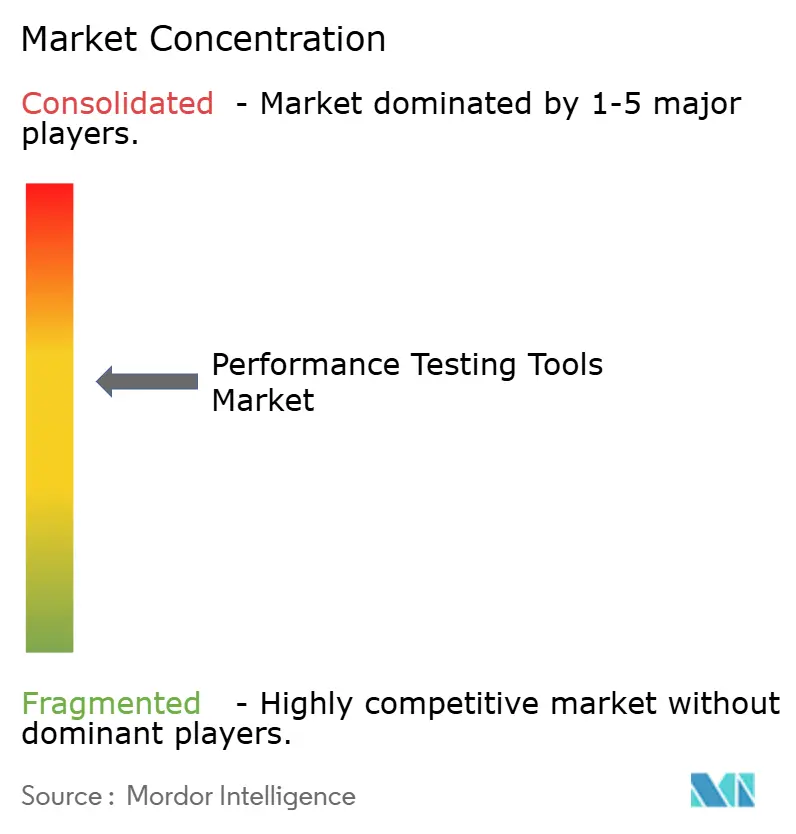
| Market Concentration | Medium |
Major Players *Disclaimer: Major Players sorted in no particular order Image © Mordor Intelligence. Reuse requires attribution under CC BY 4.0. | |
Performance Testing Tools Market Analysis by Mordor Intelligence
Performance testing tools market size in 2026 is estimated at USD 1.87 billion, growing from 2025 value of USD 1.64 billion with 2031 projections showing USD 3.59 billion, growing at 13.97% CAGR over 2026-2031. The rapid substitution of reactive quality assurance with proactive resilience engineering is accelerating spending as cloud-native architectures, microservices sprawl, and edge workloads expand the failure surfaces. Observability vendors are embedding synthetic load generation into production telemetry, compelling pure-play providers to differentiate through AI-driven autonomous orchestration and CI/CD integration. Procurement responsibility is shifting from siloed QA teams to DevOps, SRE, and platform engineering groups, widening buying centers and lifting average deal values. Compliance mandates, data-sovereignty rules, and network latency constraints are nudging highly regulated firms toward hybrid deployment models even as cloud-based services dominate new installations.
Key Report Takeaways
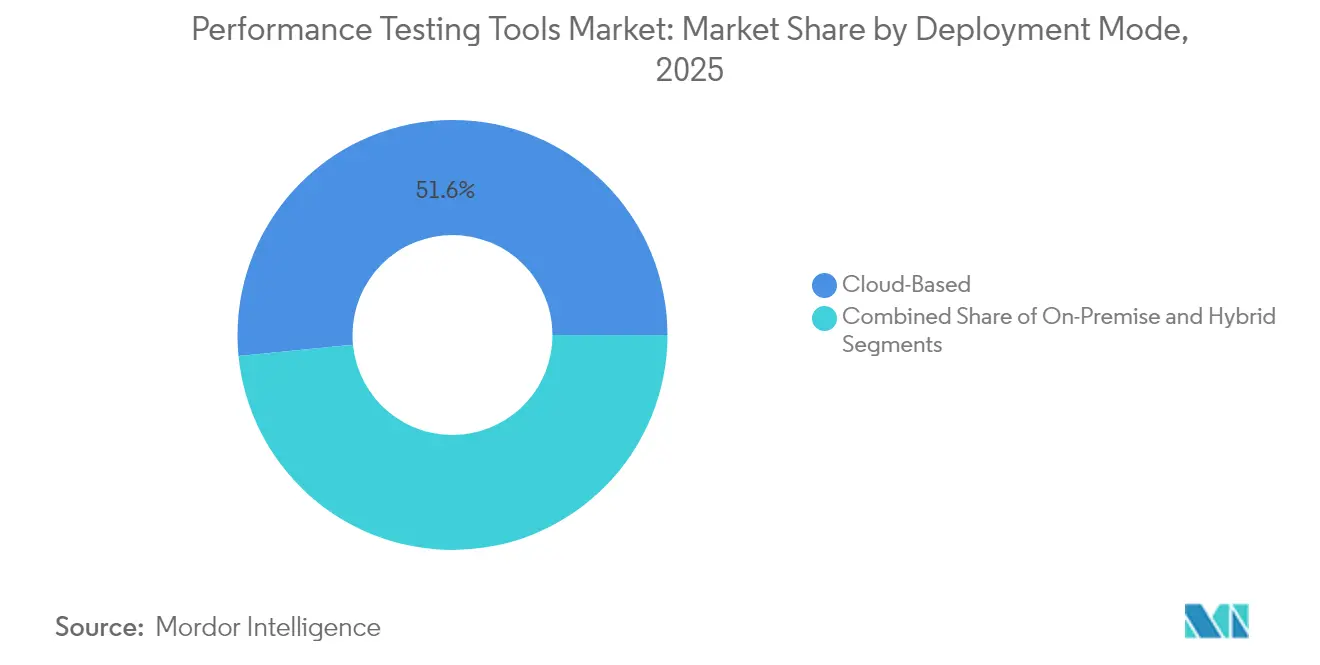
- By deployment mode, cloud-based solutions captured 51.55% of the performance testing tools market share in 2025, whereas hybrid deployments are projected to expand at a 15.68% CAGR through 2031.
- By testing type, load testing led with a 37.10% share of the performance testing tools market size in 2025, while scalability testing is set to register the fastest CAGR of 16.65% from 2026 to 2031.
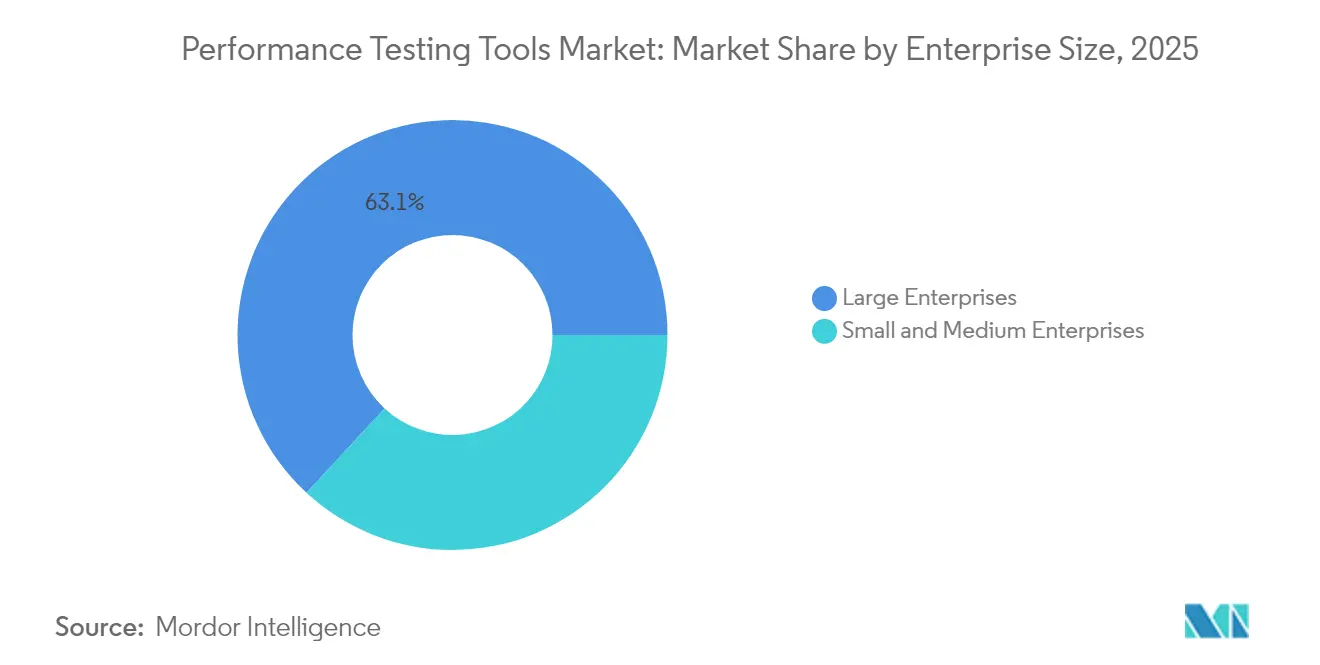
- By enterprise size, large enterprises generated 63.12 of % revenue of the performance testing tools market in 2025, whereas small and medium enterprises are forecast to advance at a 15.35% CAGR through 2031.
- By industry vertical, IT and telecom accounted for 29.40% of the performance testing tools market share in 2025; healthcare is poised to grow at a 17.05% CAGR up to 2031.
- By tool licensing, commercial products represented 58.10% of the performance testing tools market size in 2025, while open-source tools are expected to rise at a 14.85% CAGR during 2026-2031.
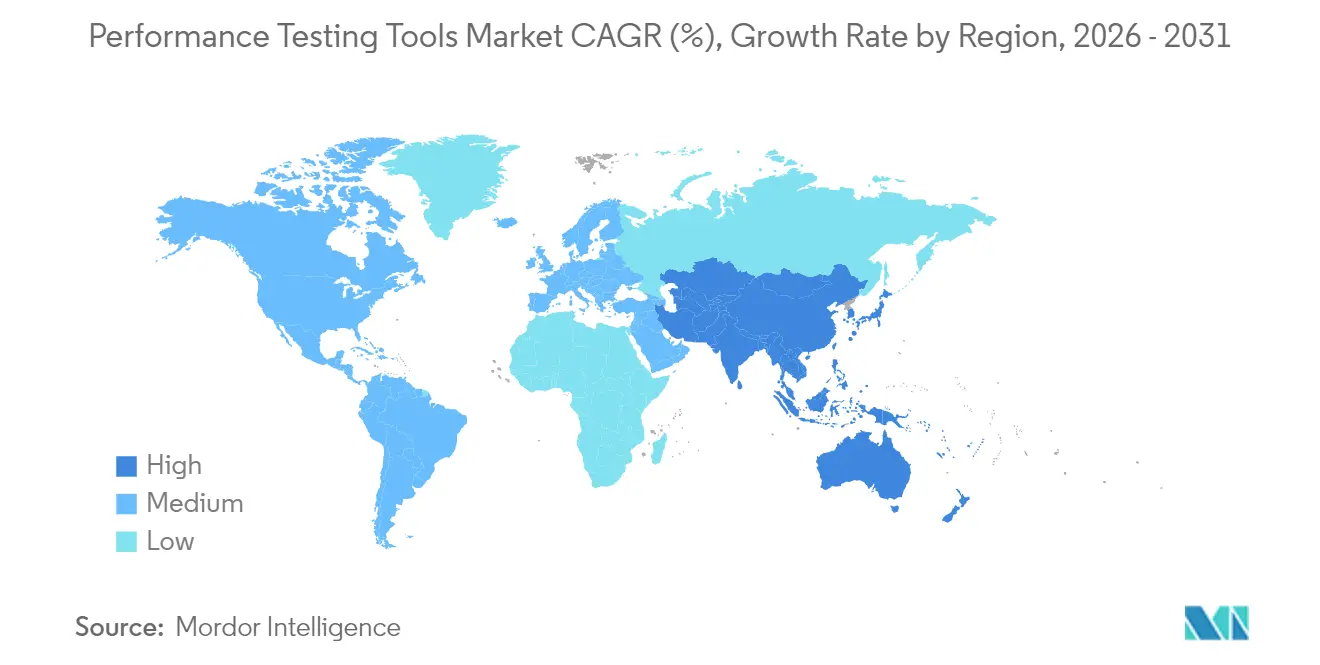
- By geography, North America dominated the performance testing tools market with a 35.82% share in 2025, whereas the Asia Pacific is projected to post the highest CAGR of 15.92% through 2031.
Note: Market size and forecast figures in this report are generated using Mordor Intelligence’s proprietary estimation framework, updated with the latest available data and insights as of 2026.
Global Performance Testing Tools Market Trends and Insights
Drivers Impact Analysis*
| Driver | (~) % Impact on CAGR Forecast | Geographic Relevance | Impact Timeline |
|---|---|---|---|
| Proliferation of Cloud-Native Applications | +3.2% | Global, concentrated in North America and Asia Pacific | Medium term (2-4 years) |
| Rising Adoption of DevOps and CI/CD Pipelines | +2.8% | Global, led by North America and Europe | Short term (≤ 2 years) |
| Increasing Complexity of Microservices | +2.5% | Global, notably North America and Asia Pacific tech hubs | Medium term (2-4 years) |
| Shift-Left Testing Mandates | +1.9% | North America and Europe | Short term (≤ 2 years) |
| Edge Computing Workload Surge in 5G Projects | +2.1% | Asia Pacific core, spillover to Middle East and North America | Long term (≥ 4 years) |
| Emergence of AI-Driven Autonomous Testing | +2.7% | Global, early adoption in North America and Europe | Medium term (2-4 years) |
| Source: Mordor Intelligence | |||
Proliferation of Cloud-Native Applications
Containerized workloads introduce ephemeral infrastructure that legacy tools struggle to profile, driving enterprises toward platforms that discover services automatically and correlate degradation with specific pods. Kubernetes adoption hit 96% among Cloud Native Computing Foundation survey respondents in 2024, illustrating mainstream demand for continuous performance validation embedded in pipelines rather than isolated pre-release phases.[1]Cloud Native Computing Foundation, “CNCF Annual Survey 2024,” cncf.io Vendor responses include Cisco integrating AppDynamics with Splunk to merge distributed tracing and synthetic load generation across hybrid estates. Standards such as ISO/IEC 25010 are evolving to address the resilience of microservices, compelling buyers to test for graceful degradation alongside peak throughput.
Rising Adoption of DevOps and CI/CD Pipelines
Continuous integration compresses release cycles from quarterly to daily, placing unprecedented time pressure on performance testing. CircleCI reported that teams practicing mature CI deploy 208 times more frequently than peers, yet 63% still cite performance testing as the primary bottleneck.[2]CircleCI, “2024 State of Software Delivery Report,” circleci.com Lightweight agents executing inside Kubernetes clusters now provide pass-fail gates against service-level objectives within minutes, enabling pull-request-level validation. Atlassian found that 78% of high-performing DevOps teams embed performance checks before merge, shifting testing fully left into developer workflows. GitOps further accelerates adoption through version-controlled, declarative test scenarios.
Increasing Complexity of Microservices Architectures
A typical enterprise application comprises 50–200 services, each of which is a potential failure domain. SRE teams must validate inter-service latency budgets, database sharding impacts, and circuit breaker behavior, thereby expanding test matrices exponentially. Unified platforms that execute load, spike, scalability, endurance, and volume scenarios from a single definition are gaining favor because they eliminate tool sprawl. Dynatrace’s FY 2024 earnings highlighted customer uptake of AI-generated test scripts derived from production traffic, shortening scenario creation cycles and aligning tests with real user behavior.
Edge Computing Workload Surge in Telecom 5G Projects
Low-latency use cases such as autonomous vehicles demand single-digit-millisecond response times, forcing tools to simulate geographically distributed users and validate network slicing. GSMA recorded 1.9 billion 5G connections in 2024, underpinning telco investment in multi-access edge computing. Ericsson projects edge workloads to contribute 30% of operator revenue by 2030. Testing vendors must integrate with NFV orchestrators and account for radio resource variability, as well as capabilities absent from many web-centric suites.
Restraints Impact Analysis*
| Restraint | (~) % Impact on CAGR Forecast | Geographic Relevance | Impact Timeline |
|---|---|---|---|
| High Skill Gap in Performance Engineering Talent Pool | -1.8% | Global, acute in Asia Pacific and emerging markets | Medium term (2-4 years) |
| Budget Constraints Across Small and Medium Enterprises | -1.3% | Global, concentrated in South America, Africa and South Asia | Short term (≤ 2 years) |
| Inconsistent Network Conditions in Developing Regions | -0.9% | Africa, South Asia, parts of Latin America | Long term (≥ 4 years) |
| Data-Residency and Compliance Restrictions on Cloud Tools | -1.5% | Europe, China, India, Middle East | Medium term (2-4 years) |
| Source: Mordor Intelligence | |||
High Skill Gap in Performance Engineering Talent Pool
Only 23% of QA teams possess Kubernetes tuning expertise, while 67% of firms report hiring challenges for engineers who bridge development and operations disciplines.[3]IEEE, “Software Engineering Workforce Survey 2024,” ieee.org Compensation premiums of 40–60% for skilled SRE roles are pricing many SMEs out of the talent market. Vendors are adding low-code interfaces and AI-driven scenario generation, yet complex edge or service-mesh environments still demand deep architectural insight.
Data-Residency and Compliance Restrictions on Cloud Tools
GDPR, China’s PIPL, and India’s draft Data Protection Bill collectively cover more than 3 billion people, limiting SaaS platforms that transmit telemetry across borders. EU banking outsourcing rules mandate regional hosting for test data. FedRAMP continuous monitoring updates require U.S. cloud providers to validate their performance under peak load, reinforcing the demand for hybrid deployment in public sector workloads.
*Our forecasts treat driver/restraint impacts as directional, not additive. The impact forecasts reflect baseline growth, mix effects, and variable interactions.
Segment Analysis
By Deployment Mode: Hybrid Gains as Compliance Complexity Rises
Hybrid architectures achieved a 15.68% CAGR through 2031, reflecting enterprises' efforts to balance sovereignty rules with cloud elasticity. Cloud-based options held a 51.55% market share in the performance testing tools market in 2025, primarily due to consumption pricing that eliminates on-premise infrastructure overhead. Regulators in the EU and India are increasingly requiring localized data storage, motivating financial services and healthcare firms to maintain control planes on-premises while offloading peak load generation to public clouds. Cisco’s integration of Splunk telemetry across hybrid estates illustrates platform convergence demanded by regulated buyers.
Hybrid adoption is reinforced by geographically dispersed user bases that on-premise labs cannot economically emulate. Edge nodes delivered by Akamai and hyperscalers offer on-demand test traffic from thousands of locations, mirroring production latency profiles. Tools orchestrating authentication, policy, and data synchronization across mixed environments reduce operational burden, positioning unified control planes as critical differentiators. As a result, hybrid models are expected to narrow the gap with cloud deployments in the performance testing tools market by 2031.


By Testing Type: Scalability Testing Surges Amid Kubernetes Adoption
Load testing remained the revenue cornerstone, with a 37.10% share in 2025; however, scalability testing is accelerating at a 16.65% CAGR as enterprises seek to align autoscaling policies with FinOps cost-optimization targets. The performance testing tools market size for scalability testing is projected to expand significantly alongside the growing adoption of containerized workloads. Cloud Native Computing Foundation surveys show that 73% of Kubernetes users struggle to predict throughput gains from replica additions, which stimulates demand for resource-profiling tools. Gatling’s JavaScript SDK release empowers Node.js developers to embed sophisticated tests in CI pipelines.
Stress, spike, and endurance tests remain vital for retail and media streaming events where traffic surges 10-50× baseline. Volume scenarios focusing on database I/O are resurging due to the emergence of multi-terabyte generative AI datasets. Vendors bundling diverse scenarios under a single declarative syntax minimize learning curves, a decisive factor for teams standardizing on one platform across development and operations.
By Enterprise Size: Open Source and Consumption Pricing Unlock SME Adoption
Large organizations generated 63.12% of 2025 revenue, supported by dedicated engineering teams and multi-year licenses, yet SMEs are advancing at a 15.35% CAGR as open-source stacks reduce entry barriers. Grafana K6’s pay-as-you-go model aligns with sporadic testing needs, letting smaller firms invest only when releases are near. The U.S. Small Business Administration reported that 62% of SMEs suffered revenue-impacting outages linked to inadequate performance validation, elevating testing from optional to essential. Vendors embedding AI-generated test scripts and template libraries are capturing SME growth by sidestepping skills shortages.
Large enterprises will continue dominating the performance testing tools market because they must validate distributed global applications under stringent SLAs. However, the proportional revenue contribution of SMEs is set to rise, driven by developer-led adoption of open-source tools within cloud-native workflows.
By Industry Vertical: Healthcare Transformation Drives Fastest Expansion
IT and telecom retained a 29.40% share in 2025, reflecting early DevOps maturity, while healthcare is forecast to deliver the fastest 17.05% CAGR. Updated HIPAA guidance classifies performance validation as a compliance necessity for telehealth and electronic health record platforms. Unpredictable traffic spikes during public-health events intensify the need for continuous performance monitoring and regular stress testing.
Financial services remain a high-value vertical because operational resilience guidelines from the Federal Reserve mandate demonstrable system endurance. Retail, eCommerce, and media sustain seasonal surges requiring scalable infrastructure validation. Government digitization programs in the United States, the United Kingdom, and India are driving public-sector demand for performance testing tools.
By Tool Licensing: Open Source Momentum Challenges Commercial Incumbents
Commercial suites accounted for 58.10% of the revenue in 2025; however, open-source options are growing at a 14.85% CAGR as enterprises seek to avoid vendor lock-in. Apache JMeter registered more than 10 million downloads in 2024.
K6, now under Grafana Labs, is emerging as a de facto standard for JavaScript, Go, and Rust ecosystems due to its lightweight footprint and built-in support for modern protocols. Commercial providers are open-sourcing core engines while reserving advanced analytics, distributed orchestration, and enterprise support tiers for paid subscribers. Investor confidence is evident in GTCR’s USD 1.33 billion investment in Tricentis, which will fuel AI-driven unified testing.
Geography Analysis
North America commanded a 35.82% market share of performance testing tools in 2025, underpinned by the presence of hyperscalers, robust cloud adoption, and mature SRE practices. FedRAMP’s updated continuous monitoring requirements sustain U.S. federal demand, while Canada’s provincial privacy laws fuel interest in hybrid deployments. Mexico’s near-shoring boom contributes to the growing IoT application load, thereby expanding the region’s testing footprint. Growth is moderating as enterprises shift budgets from first-time purchases to platform consolidation and optimization.
Asia Pacific is the fastest-growing region, with a 15.92% CAGR through 2031. India’s cloud services market expanded by 32% year-over-year in 2024, driven by large-scale government platforms, such as Aadhaar, that require peak-load validation. [4]Ministry of Electronics and Information Technology, “India Cloud Services Market Report 2024,” meity.gov.in. China’s “Digital China” initiative boosts domestic testing tool providers that comply with cybersecurity restrictions on foreign software. Japan and South Korea advance 5G and edge rollouts, while Australia’s critical-infrastructure legislation mandates resilience testing in utilities and telecom. Skill shortages and inconsistent connectivity in developing sub-regions temper adoption but do not derail momentum.
Europe shows steady but slower growth, constrained by GDPR and data-residency obligations that fragment tooling choices. The European Banking Authority’s outsourcing guidelines force banks to validate cloud performance within EU borders, spurring hybrid and on-premise deployments. Germany’s Industry 4.0 adoption and the UK’s post-Brexit regulatory divergence sustain demand across the manufacturing and financial services sectors. The Middle East is accelerating its sovereign cloud investments in Saudi Arabia and the UAE, whereas Africa’s nascent uptake is led by fintech applications that require resilience under variable network conditions.

Competitive Landscape
The performance testing tools market is moderately fragmented. Observability leaders such as Dynatrace, New Relic, and Splunk are embedding synthetic load generation into unified telemetry stacks, reframing testing as an extension of run-time observability rather than a discrete pre-production task. Cisco’s USD 28 billion Splunk acquisition and Keysight’s USD 1.46 billion Spirent buyout illustrate platform consolidation aimed at end-to-end coverage from network to application layers. Specialized vendors Tricentis, SmartBear, and BlazeMeter defend their niches with AI-powered test generation, low-code authoring, and deep CI/CD hooks, but face margin pressures from the commoditization of open-source solutions.
Developer mindshare is shifting toward Kubernetes-native solutions that execute within application clusters, eliminating the need for separate test infrastructure. K6’s lightweight agents and modern scripting showcase this shift, while CloudBolt’s purchase of StormForge extends autonomous resource tuning into hybrid-cloud management. White-space opportunities remain in edge validation, GPU-accelerated AI workload testing, and regulatory-compliant data-sovereignty features. Vendors optimizing for OpenTelemetry compatibility and GitOps workflows are best positioned to capture incremental spend.
Performance Testing Tools Industry Leaders
Micro Focus International plc
IBM Corporation
Broadcom Inc.
Tricentis GmbH
Akamai Technologies Inc.
- *Disclaimer: Major Players sorted in no particular order

Recent Industry Developments
- March 2025: CloudBolt Software acquired StormForge, embedding autonomous Kubernetes resource tuning into its hybrid-cloud suite.
- December 2024: SmartBear acquired QMetry to enhance AI-driven test-case prioritization and expand its presence in the Asia Pacific region.
- November 2024: GTCR invested USD 1.33 billion in Tricentis at a USD 4.5 billion valuation.
- November 2024: Cisco integrated AppDynamics with Splunk to unify application tracing and log analytics.
- November 2024: IBM partnered with AMD to deploy MI300X accelerators on IBM Cloud for AI workload testing.


Global Performance Testing Tools Market Report Scope
| Cloud–Based |
| On–Premise |
| Hybrid |
| Load Testing |
| Stress Testing |
| Spike Testing |
| Endurance Testing |
| Volume Testing |
| Scalability Testing |
| Large Enterprises |
| Small and Medium Enterprises |
| IT and Telecom |
| BFSI |
| Healthcare |
| Retail and eCommerce |
| Media and Entertainment |
| Government |
| Other Industry Verticals |
| Open Source Tools |
| Commercial / Proprietary Tools |
| North America | United States | |
| Canada | ||
| Mexico | ||
| South America | Brazil | |
| Argentina | ||
| Rest of South America | ||
| Europe | Germany | |
| United Kingdom | ||
| France | ||
| Italy | ||
| Spain | ||
| Russia | ||
| Rest of Europe | ||
| Asia Pacific | China | |
| Japan | ||
| India | ||
| South Korea | ||
| Australia | ||
| Rest of Asia Pacific | ||
| Middle East and Africa | Middle East | Saudi Arabia |
| United Arab Emirates | ||
| Turkey | ||
| Rest of Middle East | ||
| Africa | South Africa | |
| Nigeria | ||
| Egypt | ||
| Rest of Africa | ||
| By Deployment Mode | Cloud–Based | ||
| On–Premise | |||
| Hybrid | |||
| By Testing Type | Load Testing | ||
| Stress Testing | |||
| Spike Testing | |||
| Endurance Testing | |||
| Volume Testing | |||
| Scalability Testing | |||
| By Enterprise Size | Large Enterprises | ||
| Small and Medium Enterprises | |||
| By Industry Vertical | IT and Telecom | ||
| BFSI | |||
| Healthcare | |||
| Retail and eCommerce | |||
| Media and Entertainment | |||
| Government | |||
| Other Industry Verticals | |||
| By Tool Licensing | Open Source Tools | ||
| Commercial / Proprietary Tools | |||
| By Geography | North America | United States | |
| Canada | |||
| Mexico | |||
| South America | Brazil | ||
| Argentina | |||
| Rest of South America | |||
| Europe | Germany | ||
| United Kingdom | |||
| France | |||
| Italy | |||
| Spain | |||
| Russia | |||
| Rest of Europe | |||
| Asia Pacific | China | ||
| Japan | |||
| India | |||
| South Korea | |||
| Australia | |||
| Rest of Asia Pacific | |||
| Middle East and Africa | Middle East | Saudi Arabia | |
| United Arab Emirates | |||
| Turkey | |||
| Rest of Middle East | |||
| Africa | South Africa | ||
| Nigeria | |||
| Egypt | |||
| Rest of Africa | |||


Key Questions Answered in the Report
What is the projected value of the performance testing tools market by 2031?
The market is expected to reach USD 3.59 billion by 2031, growing at a 13.97% CAGR.
Which deployment model is forecast to grow fastest?
Hybrid deployments are slated to expand at a 15.68% CAGR as firms balance compliance with cloud scalability.
Why is healthcare the fastest-growing end-user segment?
Updated HIPAA guidance now treats performance validation as a compliance requirement, propelling a forecast 17.05% CAGR for healthcare spending.
How are open-source tools influencing vendor strategies?
Rising adoption of JMeter, Gatling and K6 is pushing commercial vendors to open-source core engines and monetize premium analytics and support.
What regional market shows the highest growth rate?
Asia Pacific leads with a 15.92% CAGR, underpinned by India’s rapid cloud uptake and China’s indigenous technology initiatives.
How is AI transforming performance testing practices?
AI-driven tools now auto-generate test scripts from production traffic, predict regression risk and optimize resource tuning, sharply reducing manual effort and cycle time.
Page last updated on:


