
OTT Technology Market Size and Share
Market Overview
| Study Period | 2020 - 2031 |
|---|---|
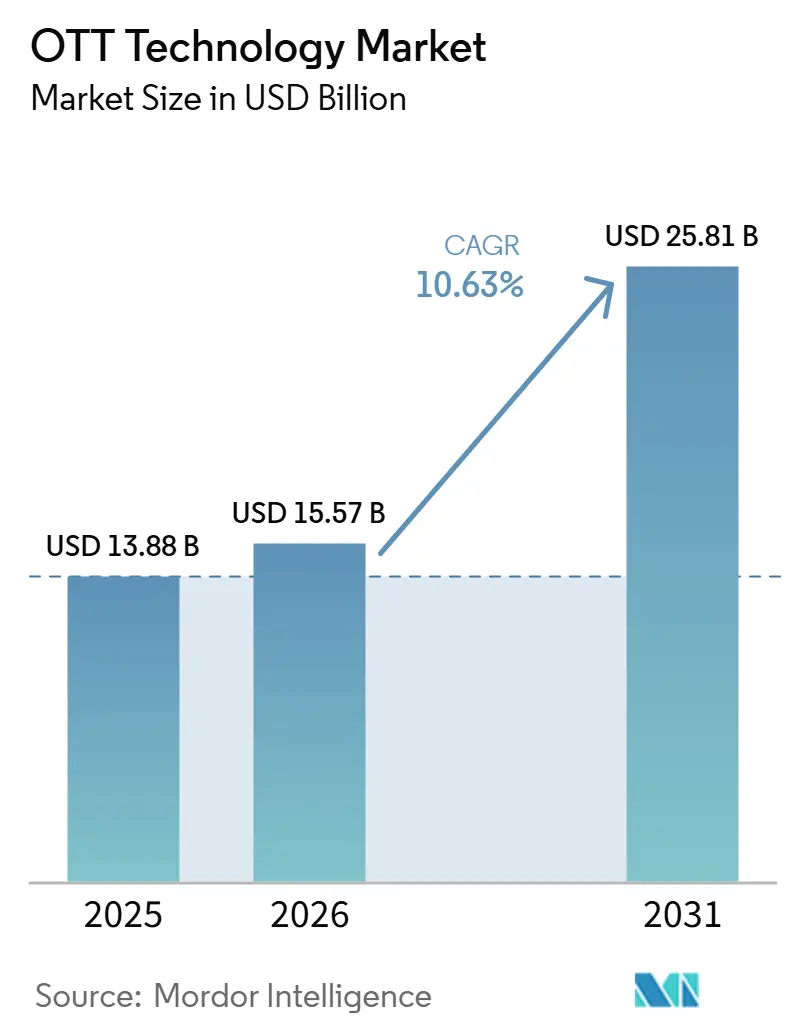
| Market Size (2026) | USD 15.57 Billion |
| Market Size (2031) | USD 25.81 Billion |
| Growth Rate (2026 - 2031) | 10.63 % |
| Fastest Growing Market | Asia-Pacific |
| Largest Market | North America |
| Market Concentration | Low |
Major Players *Disclaimer: Major Players sorted in no particular order Image © Mordor Intelligence. Reuse requires attribution under CC BY 4.0. | |
OTT Technology Market Analysis by Mordor Intelligence
The OTT technology market size is projected to expand from USD 13.88 billion in 2025 and USD 15.57 billion in 2026 to USD 25.81 billion by 2031, registering a CAGR of 10.63% between 2026 and 2031. The OTT technology market is being shaped by spending on infrastructure that supports video preparation, delivery, advertising, security, and audience measurement. Investment is moving toward operational efficiency because streaming providers need to manage costs while improving retention and advertising income. Sports rights are driving demand for reliable live delivery and encouraging rights holders to build stronger direct streaming capabilities. Hybrid subscription and advertising models are creating a need for platforms that can support multiple revenue models within a single operating environment. The OTT technology market also offers opportunities for suppliers that help broadcasters meet accessibility, privacy, content-rights, and local hosting requirements.
Key Report Takeaways
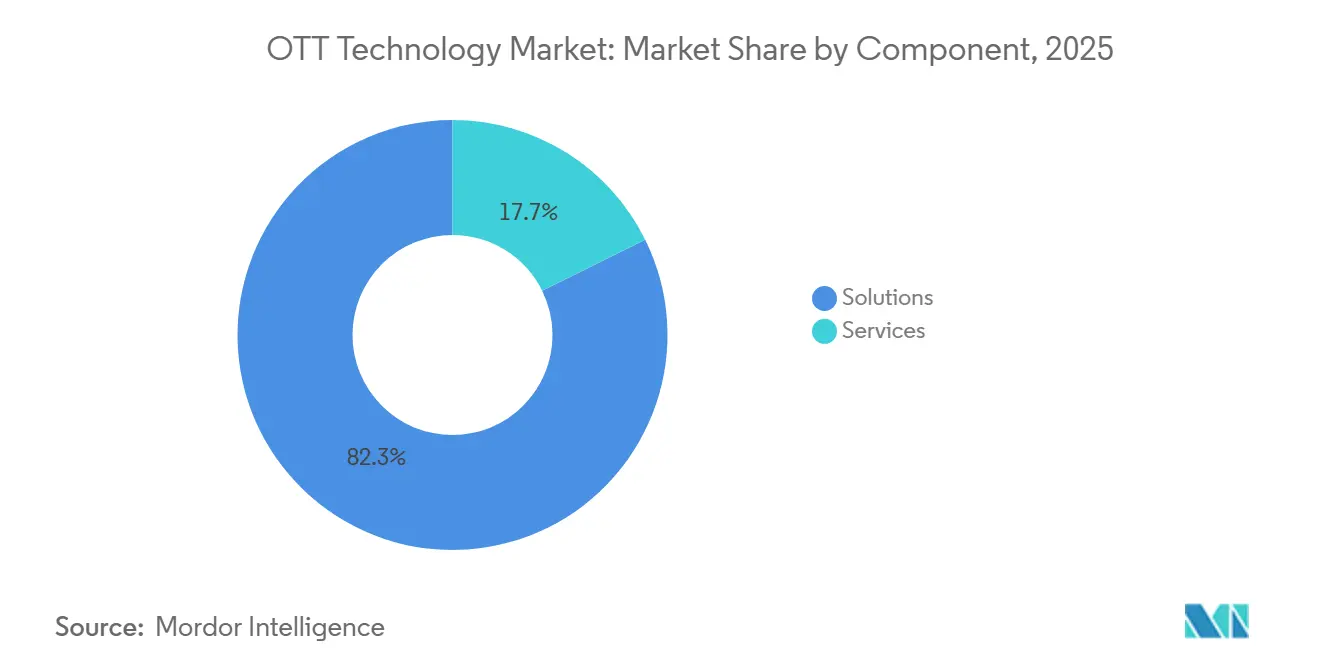
- By component, solutions held 82.31% of the OTT technology market share in 2025, while services are projected to expand at an 11.25% CAGR through 2031.
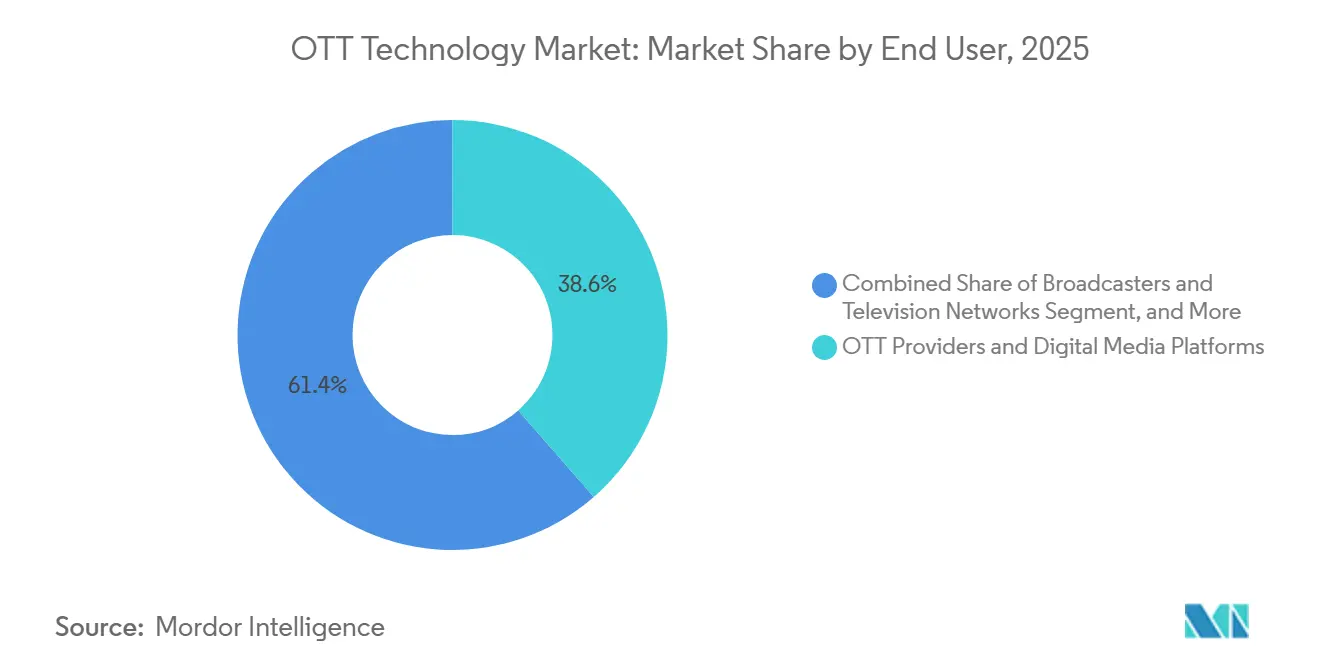
- By end user, OTT providers and digital media platforms held 38.59% of the over-the-top (OTT) technology market share in 2025, while sports organizations and rights holders are projected to expand at an 11.18% CAGR through 2031.
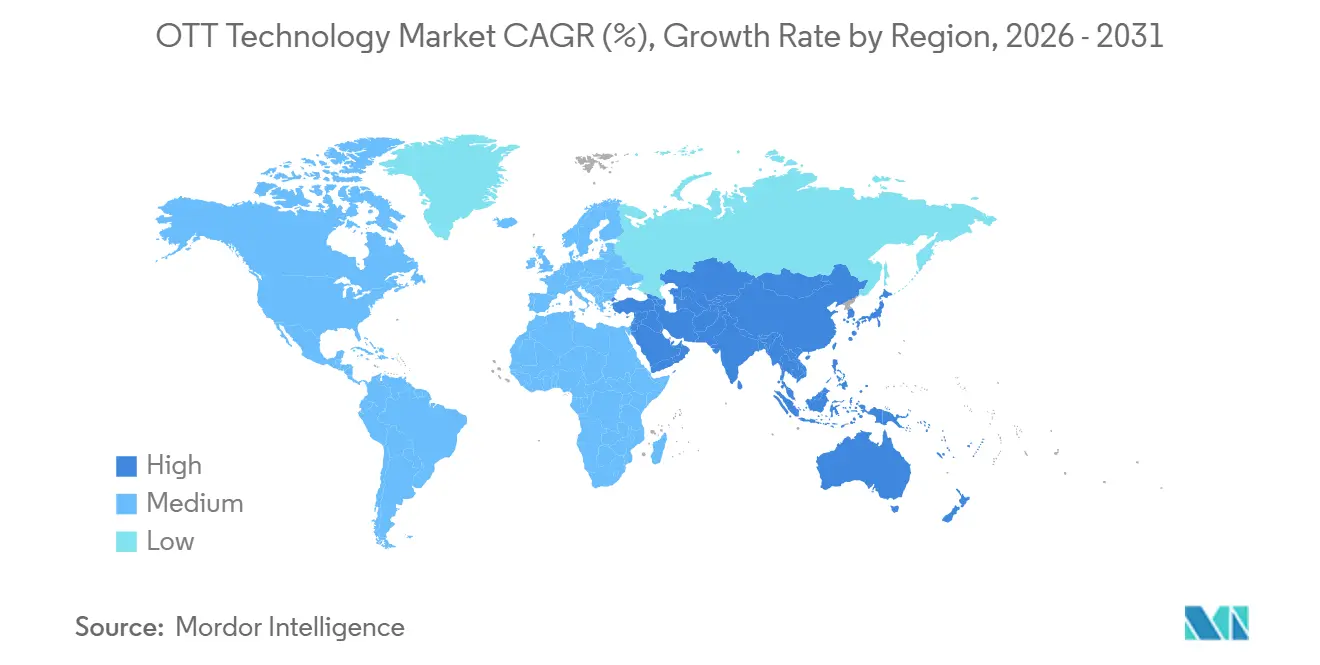
- By geography, North America accounted for 38.72% of revenue in 2025, while Asia-Pacific is projected to expand at a 11.24% CAGR through 2031.
Note: Market size and forecast figures in this report are generated using Mordor Intelligence’s proprietary estimation framework, updated with the latest available data and insights as of January 2026.
Market Trends and Insights
Drivers Impact Analysis of OTT Technology Market*
| Driver | (~) % Impact on CAGR Forecast | Geographic Relevance | Impact Timeline |
|---|---|---|---|
| Rising Multi-Device Streaming Consumption | +2.1% | Global, with highest intensity in North America, Asia-Pacific, and urban Europe | Short term (≤ 2 years) |
| Shift Toward Hybrid Monetization and FAST Channels | +1.9% | Global, with fastest adoption in North America and Western Europe, with rapid scale-up in Asia-Pacific | Short term (≤ 2 years) |
| AI-Enabled Personalization and Streaming Operations | +1.7% | Global, with early-mover gains in North America and South Korea, and later adoption in Southeast Asia and the Middle East | Medium term (2-4 years) |
| Digitization of Live Sports and Interactive Events | +1.5% | North America, Europe, India, and South Korea | Short term (≤ 2 years) |
| Cloud-Native and Edge-Based Delivery Modernization | +1.1% | Global, with strongest activity in North America and Asia-Pacific core markets, and early gains in the Middle East and Africa | Medium term (2-4 years) |
| Enterprise and Education Video Adoption | +0.8% | North America and Europe, with growing demand in India, Southeast Asia, and Gulf Cooperation Council markets | Medium term (2-4 years) |
| Source: Mordor Intelligence | |||
Rising Multi-Device Streaming Consumption
The wider use of connected devices is changing the role of the OTT technology market. Video services must now provide a consistent experience across televisions, phones, tablets, browsers, and connected devices. This requirement increases demand for player technology, adaptive bitrate delivery, authentication controls, and quality measurement tools. Nielsen reported in May 2025 that streaming viewing in the United States exceeded combined broadcast and cable viewing for the first time. That shift makes streaming infrastructure a more immediate procurement priority for broadcasters that still rely on linear-first systems. Providers also need practical retention tools, as a content catalog alone does not address subscriber fatigue or monthly churn.
Shift Toward Hybrid Monetization and FAST Channels
The over-the-top (OTT) technology market is seeing more demand for systems that support subscription, advertising, transactional, and free ad-supported television models. FAST channels require dependable channel scheduling, advertising insertion, measurement, and content management functions. This makes monetization technology more important for services that want several revenue sources without separate operating systems. Spain’s use of FAST content shows that ad-supported viewing is relevant beyond North America, although local viewing habits continue to differ. Germany’s 2026 coalition agreement requires platforms to allocate 8% of domestic revenue to local film funding, adding a compliance consideration to monetization planning. Providers must therefore connect commercial workflows with reporting and local-content obligations.
AI-Enabled Personalization and Streaming Operations
AI is becoming part of the operating workflow for the OTT technology market rather than remaining only a recommendation feature. It can support content preparation, captioning, advertising decisions, audience analysis, and service monitoring. Amagi introduced its AI Artwork Engine in March 2026 to create promotional images in multiple formats for FAST, OTT, and connected television channels.[1]Amagi, “Amagi Launches AI Artwork Engine: Ending the Era of Manual Resizing for Global Streaming,” Amagi, amagi.com The product reduces a task that previously took days to minutes, helping teams prepare content more quickly. Kaltura also released AI agent skills in May 2026 that allow coding agents to build rich-media experiences through its platform interfaces. The difference between embedded operational use and isolated tools is becoming more important when buyers assess platform capability.
Digitization of Live Sports and Interactive Events
Live sports are increasing infrastructure requirements in the OTT market, as audiences watch simultaneously and expect reliable video. Sports rights agreements also encourage leagues, teams, broadcasters, and streaming services to protect viewing quality during peak events. The NBA agreement with ESPN, NBCUniversal, and Amazon Prime Video covers 11 years and USD 76 billion, beginning with the 2025-26 season. Such arrangements increase the importance of low-latency delivery, multiview presentation, and targeted advertising during live streams. FOX One and Skreens announced a 2026 partnership for synchronized multiview viewing and contextual advertising. DAZN’s acquisition of ViewLift in April 2026 also reflected sports platforms' interest in owning more of the technology used to serve teams and regional networks.
Restraints Impact Analysis of OTT Technology Market*
| Restraint | (~) % Impact on CAGR Forecast | Geographic Relevance | Impact Timeline |
|---|---|---|---|
| Complex Integration and Vendor Lock-In | -1.4% | Global, with the sharpest exposure in North America and Europe where multi-vendor stacks are most established | Medium term (2-4 years) |
| Fragmented Content Rights and Data-Sovereignty Rules | -1.1% | Global, with the strongest effect in Europe, Asia-Pacific, and India | Long term (≥ 4 years) |
| Bandwidth, Storage, and Energy Cost Volatility | -0.8% | North America and Europe, with rising infrastructure-cost exposure in large Asia-Pacific markets | Medium term (2-4 years) |
| Piracy, Credential Abuse, and Automated Content Scraping | -0.6% | Global, with high reported exposure in Southern Europe, South America, and Southeast Asia | Short term (≤ 2 years) |
| Source: Mordor Intelligence | |||
Complex Integration and Vendor Lock-In
Many operators have built video services with separate contracts for content delivery, rights protection, advertising, analytics, and content management. Each additional connection can make the system harder to change when an operator adopts a new feature or enters a new territory. Proprietary metadata structures and limited data export options can also make replacement decisions expensive. The OTT technology market is responding with platforms that use more open interfaces and connections with common content-management systems. Kaltura released native integrations for Adobe Experience Manager, WordPress, and Drupal in April 2026, reducing the need for a full platform migration. Harmonic also announced Model Context Protocol support in April 2026 for AI connectivity in hybrid streaming workflows.
Fragmented Content Rights and Data-Sovereignty Rules
Territorial licensing and data-residency rules affect technology choices in the OTT technology market. Playback logs, IP addresses, and viewing behavior can create legal exposure when information crosses jurisdictions. European broadcasters are therefore seeking cloud and delivery options that keep sensitive operations within regional boundaries. Qvest, Ateme, and Scaleway announced a partnership in July 2026 to provide a sovereign OTT platform for European broadcasters seeking EU-hosted infrastructure. Synamedia and MoMe launched Spain’s first streaming-optimized CDN across 8 Spanish data centers in March 2026, with capacity designed to scale from 500 Gbps to 5+ Tbps.[2]Synamedia, “MoMe Selects Synamedia to Power Spain’s First CDN for Streaming,” Synamedia, synamedia.com Comparable rights and privacy requirements in China and India add complexity for suppliers working across several territories.
*Our forecasts treat driver/restraint impacts as directional, not additive. The impact forecasts reflect baseline growth, mix effects, and variable interactions.
OTT Technology Market Segment Analysis
By Component:
Solutions Lead, While Services Expand FasterSolutions held 82.31% of the OTT technology market share in 2025. This position reflected the central role of software for video management, processing, delivery, advertising, measurement, and content protection. OTT platforms and video-management products are core operating systems for many providers. Content delivery and edge infrastructure also remain essential because they affect availability and viewing quality. Monetization and advertising technology are receiving more attention as platforms combine subscription, advertising, FAST, and transactional services. The European Accessibility Act established requirements for accessible products and services, including relevant digital service obligations. These requirements can turn captioning, audio description, measurement, and security capabilities into planned compliance investments. Content security, DRM, and anti-piracy tools remain important because valuable programming can lose income when access controls fail.
Services are projected to record an 11.25% CAGR through 2031, the fastest rate within the component split. The OTT technology services market is growing as operators outsource more operations to external specialists. These services include integration, managed delivery, cloud playout, support, and ongoing workflow management. Amagi reported 30% revenue growth in fiscal year 2025-26 and a 6x increase in adjusted earnings. It supports more than 300 distribution partners across 40+ countries, underscoring the scale required for managed cloud playout. Buyers use services when internal teams cannot cost-effectively maintain all technical skills. This creates a continuing role for specialists that can integrate systems while keeping live and on-demand operations stable.


By End User:
OTT Providers Lead, While Sports Organizations AccelerateOTT providers and digital media platforms accounted for 38.59% of the OTT technology market share in 2025. They are major buyers because they operate direct consumer services and need technology across the full video workflow. Many are replacing assembled, multi-vendor environments with cloud-native platforms that use open interfaces. Fox Corporation named AWS as its preferred AI cloud provider in April 2026. The deployment includes AWS Elemental MediaLive, MediaPackage, MediaTailor, and AWS Elemental Inference. It shows how a large media organization can combine broadcast processing, advertising, and content discovery within a single cloud relationship. Broadcasters, television networks, telecom providers, and pay-TV operators also remain material buyers as they move from linear systems toward streaming-led delivery.
Sports organizations and rights holders are projected to advance at an 11.18% CAGR through 2031. Their over-the-top (OTT) technology market size is expected to grow as they take a more direct role in audience relationships and distribution. The category has a particular need for reliable live workflows because event audiences converge within short timeframes. DAZN acquired ViewLift in April 2026, adding a provider that serves 15 major professional sports teams and 5 regional sports networks. The acquisition supports DAZN’s B2B2C and software-as-a-service expansion in North America. Enterprises and educational institutions also use video systems more widely as content, training, and communication increasingly move online. Government and public-sector organizations contribute additional demand where public broadcasting, public education, and sovereign-hosting requirements apply.

Geography Analysis
North America OTT Technology Market
North America held 38.72% of the OTT technology market share in 2025. The region combines streaming services, rights owners, cloud providers, content-delivery networks, and specialized technology suppliers. This concentration supports demand for video processing, advertising tools, content protection, and live-event delivery. Amazon expects total capital expenditures of USD 200 billion in 2026, with spending primarily directed toward AI and data center build-out.[3]Andy Jassy, “Amazon CEO Andy Jassy 2025 Letter to Shareholders,” About Amazon, aboutamazon.com That capacity can support media workloads across cloud and edge environments. The United States also has a large base of broadcasters updating their linear operations for streaming. Canada and Mexico add regional demand for distribution systems that can support local audiences and rights arrangements.
APAC OTT Technology Market
Asia-Pacific is projected to expand at an 11.24% CAGR through 2031, the fastest regional rate in the OTT technology market. India’s mobile-led streaming environment creates demand for efficient delivery, advertising technology, and flexible content operations. China’s more closed technology environment limits direct participation by international vendors. Japan’s premium pricing model and Australia’s connected television inventory provide different commercial settings for streaming suppliers. South Korea’s 5G and edge-computing development makes the country relevant for personalization and low-latency delivery. Southeast Asian markets offer a later-stage growth path as operators scale mobile-first, advertising-supported services. Regional suppliers must accommodate different languages, payment practices, device mixes, and local content requirements.
EMEA and South America OTT Technology Market
Europe’s OTT technology market size is supported by hybrid monetization and regulatory requirements. French rules required streaming platforms to contribute EUR 400 million (USD 444 million) to audiovisual production funding in 2024. Germany’s domestic-film contribution requirement creates a related planning issue for services operating in the country. Spain’s use of FAST channels supports demand for channel management and advertising insertion. South America is led by Brazil, where mobile-first access and investment in local programming encourage OTT adoption. The Middle East is linked to media digitization programs in Saudi Arabia and the United Arab Emirates. Africa remains a developing market where mobile-first, advertising-supported architectures can meet the needs of new streaming users.

Competitive Landscape
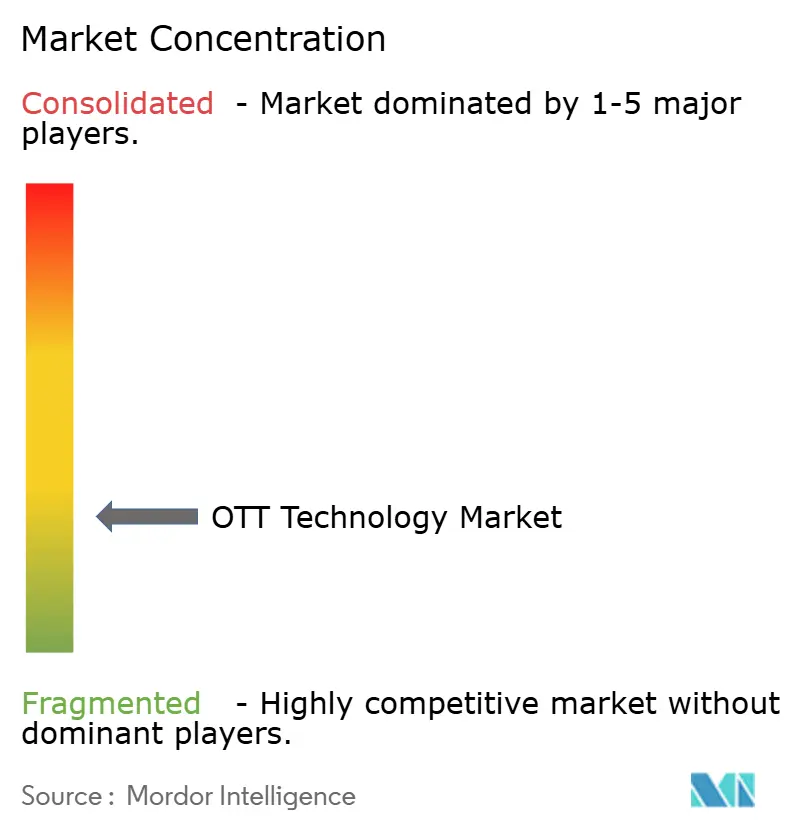
The OTT technology market is fragmented, and has three broad competitive layers. Cloud providers and content-delivery networks supply foundational compute, storage, delivery capacity, and managed media services. Specialized platform suppliers provide video management, playout, advertising, security, analytics, and workflow applications. Professional service providers support integration and managed operations. AWS, Google, and Akamai have strong positions in the infrastructure layer. Google Cloud stated that its Media CDN uses the same infrastructure that supports YouTube and is being developed for demanding broadcast and streaming workloads.[4]Google Cloud, “Evolving Media CDN for the World’s Most Demanding Broadcast and Streaming Workloads,” Google Cloud, cloud.google.com That infrastructure position affects the options available to specialist vendors and their customers.
Brightcove, Kaltura, Harmonic, Amagi, and Synamedia compete through product depth, media expertise, and the ability to connect with customer systems. The OTT technology market remains more fragmented in analytics, security, and services than in cloud and content delivery. Harmonic and Kaltura have both adopted Model Context Protocol-related capabilities to make their platforms more usable with AI coding agents. This increases the value of reusable interfaces and documented platform functions. Amagi’s March 2026 AI Artwork Engine is a practical example of a specialist vendor automating content preparation across several distribution formats. Synamedia’s Spanish CDN deployment is another example, with its local network designed for data-residency needs and live-streaming performance. DAZN’s ViewLift acquisition is another example of a streaming company bringing technology capability closer to its sports distribution business.
The competitive structure creates room for suppliers that address clear operating constraints. European broadcasters need hosting and delivery options that meet data-residency expectations. Mobile operators in emerging markets need integrated FAST-channel tools that fit lower-cost, mobile-led services. Sports organizations need automation that supports direct consumer offerings without weakening live-event performance. Suppliers that can combine standard interfaces with specialist media knowledge can reduce the burden of multi-vendor integration. Large cloud providers are difficult to match in terms of infrastructure capacity. Specialist vendors can instead differentiate through workflow design, regional compliance, security depth, and customer support. The available information does not provide a combined share for leading companies, so no evidence-based market concentration score can be assigned.
OTT Technology Industry Leaders
Amazon Web Services, Inc.
Akamai Technologies, Inc.
Google LLC
Microsoft Corporation
Brightcove Inc.
- *Disclaimer: Major Players sorted in no particular order
OTT Technology Market Companies Covered in this Report
- Amazon Web Services, Inc.
- Akamai Technologies, Inc.
- Google LLC
- Microsoft Corporation
- Brightcove Inc.
- Kaltura, Inc.
- Synamedia Limited
- Harmonic Inc.
- Amagi Media Labs Private Limited
- Vimeo, Inc.
- JW Player, Inc.
- Wowza Media Systems, LLC
- Muvi LLC
- Dacast Inc.
- Mux, Inc.
- Bitmovin GmbH
- Verimatrix, Inc.
- THEO Technologies NV
- Conviva, Inc.
- Comcast Technology Solutions, LLC

Recent Industry Developments in OTT Technology Market
- July 2026: Qvest, Ateme, and Scaleway launched a sovereign OTT platform partnership, offering European broadcasters a path to migrate streaming infrastructure to EU-hosted, GDPR-compliant cloud architecture as an alternative to US hyperscaler deployments.
- June 2026: Bitmovin, Simplestream, and Xperi announced a joint integration enabling OTT services to reach TiVo OS smart TVs, combining Simplestream's content management framework with Bitmovin's AI-based playback testing that analyzes over 1 million tests per week.
- May 2026: Amagi reported 30% revenue growth in FY 2025-26 with adjusted EBITDA rising 6x and profit after tax turning positive, coinciding with its largest-ever CLOUDPORT upgrade delivering 100+ concurrent feed capacity and 70% faster playlist publishing.
- May 2026: Kaltura open-sourced AI agent skills enabling coding agents including Claude Code, OpenAI Codex, and GitHub Copilot to build rich-media digital experiences on the Kaltura platform via Model Context Protocol and Agent Skills Standard.


Global OTT Technology Market Report Scope
The OTT Technology Market comprises software solutions, platforms, and associated services that enable the delivery, management, monetization, security, and optimization of over-the-top (OTT) digital content and streaming services over the internet, bypassing traditional cable, satellite, and terrestrial broadcasting infrastructure. This market includes technologies that support the complete OTT content lifecycle, including content ingestion, encoding and transcoding, content management, digital rights management (DRM), video hosting, content delivery, user authentication, analytics, advertising, subscription management, recommendation engines, application development, quality of service (QoS) monitoring, and cloud-based streaming infrastructure.
The OTT Technology Market Report is Segmented by Component (Solutions, and Services), by End User (OTT Providers and Digital Media Platforms, Broadcasters and Television Networks, Telecom and Pay-TV Operators, Sports Organizations and Rights Holders, Enterprises, Educational Institutions, Government and Public-Sector Organizations, and Other End Users), and by Geography (North America, South America, Europe, Asia-Pacific, Middle East, and Africa). The Market Forecasts are Provided in Terms of Value (USD).
| Solutions | OTT Platform and Video Management |
| Video Processing and Content Preparation | |
| Content Delivery and Edge Infrastructure | |
| Monetization and Advertising Technology | |
| Analytics, Measurement and Experience Optimization | |
| Content Security, DRM and Anti-Piracy | |
| Services |
| OTT Providers and Digital Media Platforms |
| Broadcasters and Television Networks |
| Telecom and Pay-TV Operators |
| Sports Organizations and Rights Holders |
| Enterprises |
| Educational Institutions |
| Government and Public-Sector Organizations |
| Other End Users |
| North America | United States |
| Canada | |
| Mexico | |
| South America | Brazil |
| Argentina | |
| Rest of South America | |
| Europe | Germany |
| United Kingdom | |
| France | |
| Italy | |
| Spain | |
| Russia | |
| Rest of Europe | |
| Asia-Pacific | China |
| Japan | |
| South Korea | |
| India | |
| Australia and New Zealand | |
| Rest of Asia-Pacific | |
| Middle East | United Arab Emirates |
| Saudi Arabia | |
| Turkey | |
| Rest of Middle East | |
| Africa | South Africa |
| Nigeria | |
| Kenya | |
| Rest of Africa |
| By Component | Solutions | OTT Platform and Video Management |
| Video Processing and Content Preparation | ||
| Content Delivery and Edge Infrastructure | ||
| Monetization and Advertising Technology | ||
| Analytics, Measurement and Experience Optimization | ||
| Content Security, DRM and Anti-Piracy | ||
| Services | ||
| By End User | OTT Providers and Digital Media Platforms | |
| Broadcasters and Television Networks | ||
| Telecom and Pay-TV Operators | ||
| Sports Organizations and Rights Holders | ||
| Enterprises | ||
| Educational Institutions | ||
| Government and Public-Sector Organizations | ||
| Other End Users | ||
| By Geography | North America | United States |
| Canada | ||
| Mexico | ||
| South America | Brazil | |
| Argentina | ||
| Rest of South America | ||
| Europe | Germany | |
| United Kingdom | ||
| France | ||
| Italy | ||
| Spain | ||
| Russia | ||
| Rest of Europe | ||
| Asia-Pacific | China | |
| Japan | ||
| South Korea | ||
| India | ||
| Australia and New Zealand | ||
| Rest of Asia-Pacific | ||
| Middle East | United Arab Emirates | |
| Saudi Arabia | ||
| Turkey | ||
| Rest of Middle East | ||
| Africa | South Africa | |
| Nigeria | ||
| Kenya | ||
| Rest of Africa | ||


Key Questions Answered in the Report
What is the size of the OTT technology market?
The market was USD 15.57 billion in 2026 and is projected to reach USD 25.81 billion by 2031, at a 10.63% CAGR.
What is driving demand for OTT technology platforms?
Demand is supported by multi-device viewing, hybrid monetization, AI-enabled operations, and the need for dependable live sports delivery.
Which component has the largest revenue share?
Solutions held 82.31% of revenue in 2025 because providers require core technology for management, delivery, monetization, analytics, and security.
Which end users are growing fastest?
Sports organizations and rights holders are projected to grow at an 11.18% CAGR through 2031 as they invest in direct streaming capabilities.
Which region is growing fastest for OTT technology?
Asia-Pacific is projected to expand at an 11.24% CAGR through 2031, supported by mobile-led streaming use and varied local video ecosystems.
How are vendors differentiating their streaming offerings?
Vendors are differentiating through AI-based workflow automation, regional hosting, accessible video features, low-latency delivery, and integrated advertising tools.
Page last updated on:





