
OTT Set-Top Box Market Size and Share
Market Overview
| Study Period | 2020 - 2031 |
|---|---|
| Market Size (2026) | USD 5.23 Billion |
| Market Size (2031) | USD 7.91 Billion |
| Growth Rate (2026 - 2031) | 8.63 % |
| Fastest Growing Market | Asia-Pacific |
| Largest Market | North America |
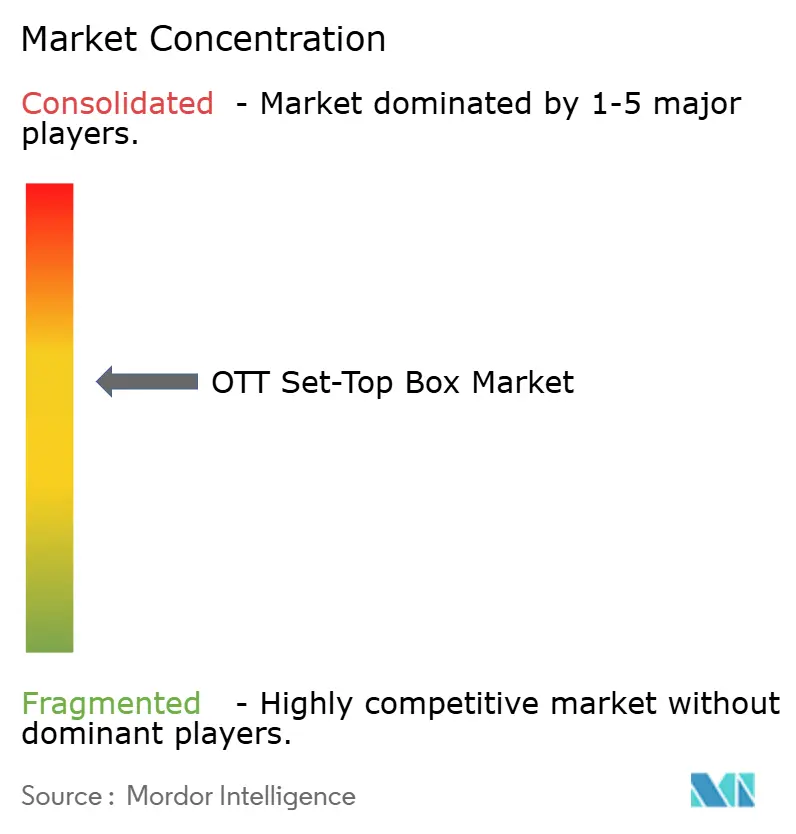
| Market Concentration | Medium |
Major Players *Disclaimer: Major Players sorted in no particular order Image © Mordor Intelligence. Reuse requires attribution under CC BY 4.0. | |
OTT Set-Top Box Market Analysis by Mordor Intelligence
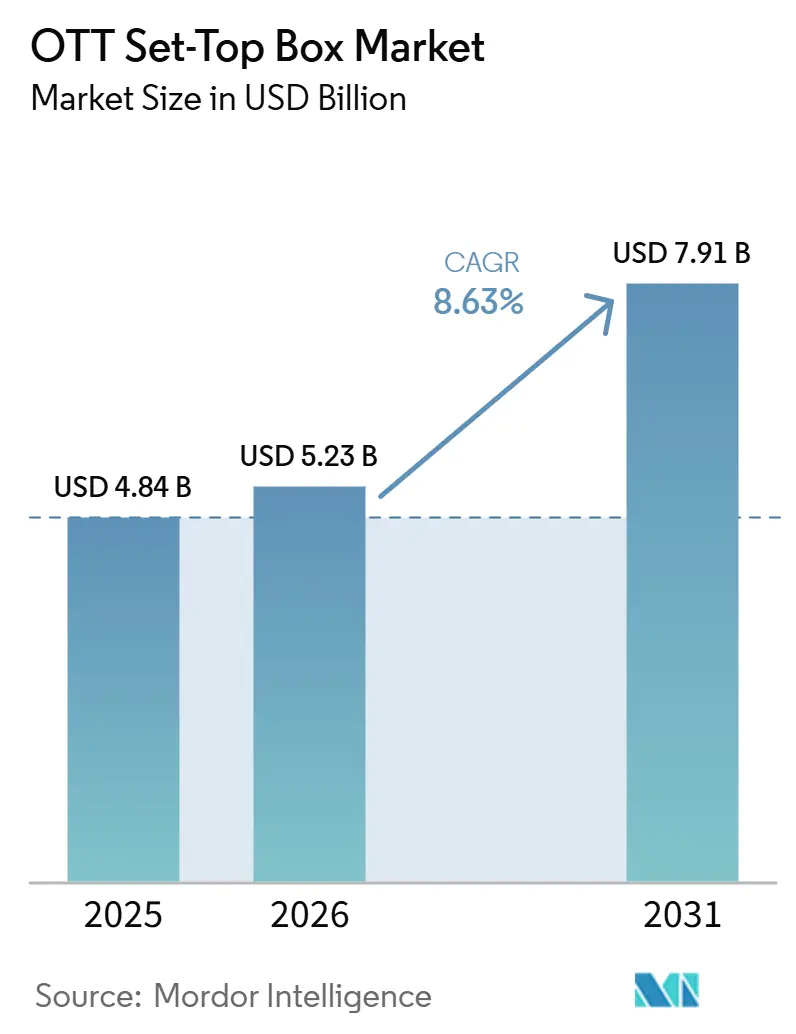
The OTT Set-Top Box Market size was valued at USD 4.84 billion in 2025 and is estimated to grow from USD 5.23 billion in 2026 to reach USD 7.91 billion by 2031, at a CAGR of 8.63% during the forecast period (2026-2031). The OTT set-top box market is supported by the replacement of broadcast-dependent devices with IP-based equipment as streaming takes a larger share of television viewing and operators reduce their dependence on legacy delivery systems. Standalone devices can provide a unified service layer where television interfaces separate viewers across application stores, content catalogs, advertising systems, and subscription arrangements, which can make service discovery less consistent for households. Platform suppliers are pursuing content aggregation, advertising, and operating system licensing, while hardware suppliers compete on manufacturing cost, certification, cloud management, security support, and tailored software for operator customers. Smart televisions limit demand for entry-level devices, but live sports, FAST channel guides, high-resolution video, multi-service content navigation, and connected-home control continue to support demand for capable standalone equipment. The OTT set-top box market, therefore, depends on the balance between lower-cost smart television interfaces and operator or retail devices that deliver features, security, and service management that integrated television systems do not consistently provide.
Key Report Takeaways
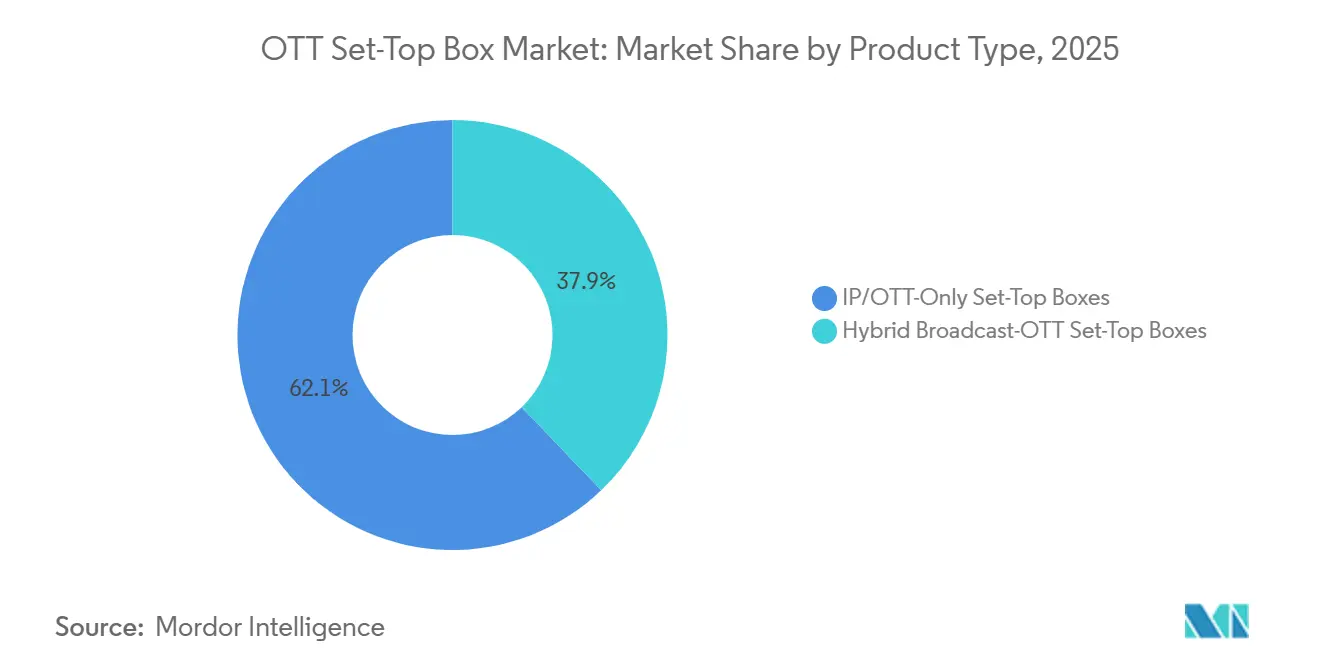
- By product type, IP/OTT-only set-top boxes held 62.15% of the OTT set-top box market share in 2025 and are projected to expand at a 9.21% CAGR through 2031.
- By operating system and platform, Android TV and Google TV accounted for 34.52% of the segment in 2025 and are expected to grow at a 8.94% CAGR through 2031.
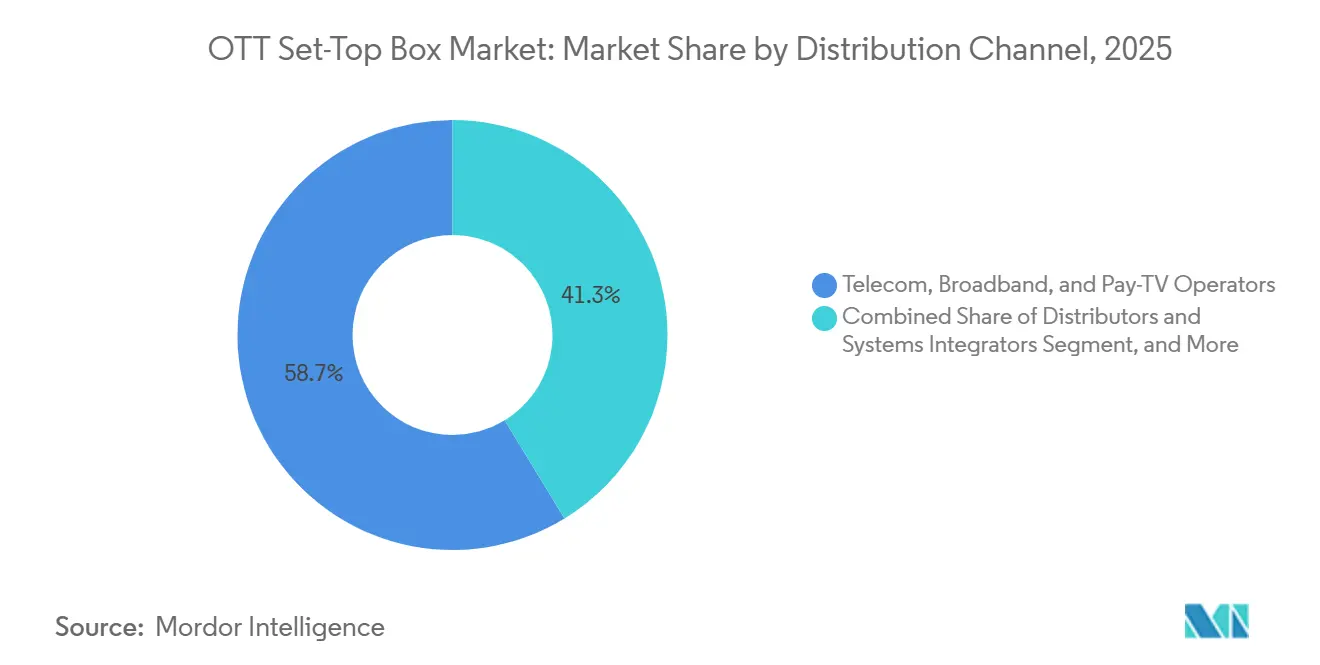
- By distribution channel, telecom, broadband, and pay-TV operators held 58.73% of the value in 2025, while retail is projected to record the highest CAGR of 8.88% through 2031.
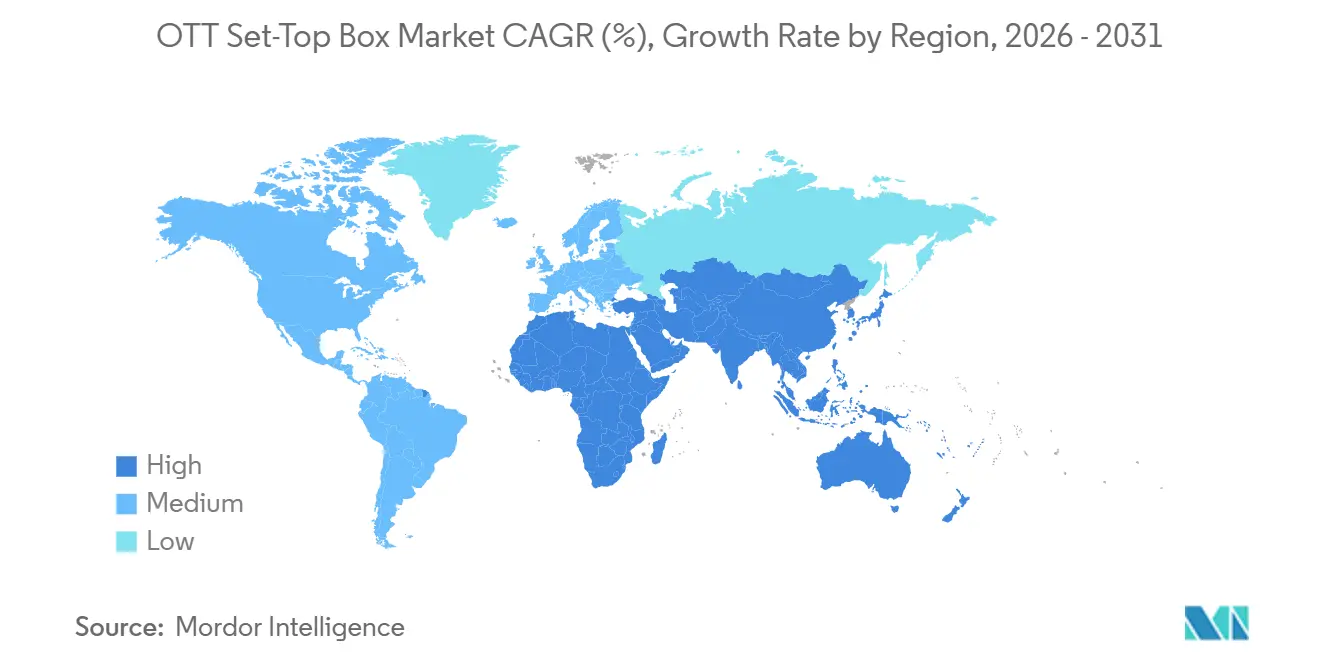
- By geography, North America accounted for 43.58% of the OTT set-top box market share in 2025, while the Asia-Pacific is projected to grow at a 9.06% CAGR through 2031.
Note: Market size and forecast figures in this report are generated using Mordor Intelligence’s proprietary estimation framework, updated with the latest available data and insights as of January 2026.
Market Trends and Insights
Drivers Impact Analysis of OTT Set-Top Box Market*
| Driver | (~) % Impact on CAGR Forecast | Geographic Relevance | Impact Timeline |
|---|---|---|---|
| Cord-Cutting and Streaming Aggregation | +3.2% | Global, concentrated in North America and Europe | Short term (≤ 2 years) |
| Fiber and 5G Fixed Wireless Expansion | +1.7% | Global, with strongest momentum in Asia-Pacific, North America, and Europe | Medium term (2-4 years) |
| FAST and Hybrid Live-TV Growth | +1.3% | North America and Europe, with spillover to Asia-Pacific and Middle East and Africa | Short term (≤ 2 years) |
| Premium 4K, HDR, Dolby Audio, and Sports Upgrades | +1.0% | North America, Europe, and urban Asia-Pacific | Medium term (2-4 years) |
| Android TV, RDK, and Cloud-Managed CPE Adoption | +0.8% | Global, strongest in European and Asia-Pacific operator markets | Medium term (2-4 years) |
| Smart-Home Hub Convergence | +0.4% | North America and Europe, with early adoption in Asia-Pacific cities | Long term (≥ 4 years) |
| Source: Mordor Intelligence | |||
Cord-Cutting and Migration to Flexible Streaming Aggregation
The shift away from traditional pay television is driving demand for hardware replacements in the OTT set-top box market. The VAB projected that 80.7 million U.S. households would be cord-cutters or cord-nevers by the end of 2026, exceeding pay-TV subscribers for the first time. Households that manage multiple subscriptions can seek a neutral discovery layer instead of a television-maker interface that also prioritizes its own advertising and content arrangements. That tension supports independent device platforms that can combine services, search, and billing into a single experience. The OTT set-top box market can benefit when aggregation is trusted enough to influence subscriber spending and daily viewing choices.
Fiber and 5G Fixed Wireless Expansion Enabling High-Quality OTT Delivery
Network capacity is a basic requirement for high-bitrate streaming, so broader fiber and fixed wireless access expand the addressable base for the OTT set-top box market. Ericsson reported that 71% of fixed wireless access service providers delivered services over 5G in June 2026, and that 394 operators had commercially launched 5G fixed wireless services.[1]Ericsson, “Ericsson Mobility Report, June 2026,” Ericsson, ericsson.com The company expects global fixed wireless subscriptions to reach 350 million by 2031. Mobile and fixed wireless network traffic rose 22% year over year in the first quarter of 2026, with India and North America providing much of the increase. Fixed wireless can reach lower-density suburban and rural locations where fiber deployment is less economical. Those households may upgrade from satellite direct-to-home or DSL equipment to IP-based devices that can support 4K services.
Growth of FAST and Hybrid Live-TV Experiences
FAST services are creating a reason for viewers to use devices that handle live guides, advertising, and service metadata well. Amagi recorded a 55% year-over-year increase in global FAST viewing hours in April through June 2026 across 6,500 channel deliveries. Scheduled channels require responsive guide rendering, shorter channel changes, and compatibility with server-side ad insertion. These requirements can expose limitations in some integrated television processors. Operators can also include Tubi, Pluto TV, or The Roku Channel in customer equipment and earn advertising revenue from homes without a subscription. This changes the economics of subsidizing hardware and gives the OTT set-top box market a role in advertiser-funded television distribution.
4K, HDR, Dolby Audio, and Premium Sports Streaming Upgrades
Premium sports and video formats encourage the replacement of older devices that cannot meet current playback requirements. ESPN, Fox, CBS, and NBC distribute selected NFL, NBA, and college football programming in 4K HDR, which requires Dolby Vision support at 60 frames per second on compatible services. Apple stated that its 2026 Apple TV update would reduce app launch times on existing Apple TV 4K hardware, while new Apple Intelligence features would require a future device. AV1 support in ARM-based system-on-chip designs can reduce bandwidth use by 30-50% compared with HEVC at the same quality, supporting operator interest in newer hardware. Widevine L1, HDCP 2.2, and studio playback certifications require hardware security features that cannot be added to older software-only fleets. The OTT set-top box market can therefore gain from operator replacement programs for premium 4K and licensed content services.
Restraints Impact Analysis of OTT Set-Top Box Market*
| Restraint | (~) % Impact on CAGR Forecast | Geographic Relevance | Impact Timeline |
|---|---|---|---|
| Smart Television Substitution | -2.8% | Global, strongest in North America, Western Europe, and urban Asia-Pacific | Medium term (2-4 years) |
| Long Replacement Cycles and Retail Price Erosion | -1.5% | Global | Medium term (2-4 years) |
| Content Rights, DRM, and Certification Complexity | -0.8% | Global, particularly fragmented in Asia-Pacific and Middle East and Africa | Medium term (2-4 years) |
| Grey-Market IPTV Boxes and Cybersecurity Trust Deficits | -0.6% | Asia-Pacific, Middle East and Africa, Eastern Europe, and parts of Western Europe | Long term (≥ 4 years) |
| Source: Mordor Intelligence | |||
Smart Televisions Reducing the Need for Dedicated OTT Hardware
Smart television adoption reduces demand for basic streaming dongles and entry-level OTT set-top boxes. Native Android TV features are included in entry-level panels priced below USD 250, eliminating the need for a separate device when households replace their television. The lack of a Shield TV hardware refresh since 2019 shows the difficulty of selling a premium Android television box when a lower-priced smart television provides comparable operating system functions. The strongest standalone use cases remain whole-home IoT control, Dolby Vision at 60 frames per second, and premium sports aggregation that may require more capable processing and connectivity. Integrated television chipsets do not always prioritize these functions in mass-market panels. As a result, smart television substitution places the greatest pressure on mid-range devices rather than on premium operator equipment.
Long Device Replacement Cycles and Retail Price Erosion
Household replacement cycles of 4-6 years restrict unit growth even as streaming usage rises. Certified Android TV and Roku OS deployments incur platform costs that reduce device margins when retail prices are below USD 50. Google certification and validation can delay launches by 4-8 months, making inventory and marketing planning more difficult for original equipment manufacturers. In emerging economies, devices may be replaced more often because initial quality is lower, but lower selling prices limit revenue growth. Uncertified devices priced below USD 20 in Southeast Asia and Africa also set a low-price reference point, making it harder for certified products to be positioned. These conditions limit the OTT set-top box market's ability to convert active streaming households into frequent hardware purchases.
*Our forecasts treat driver/restraint impacts as directional, not additive. The impact forecasts reflect baseline growth, mix effects, and variable interactions.
OTT Set-Top Box Market Segment Analysis
By Product Type:
IP-Only Architecture Is Reshaping the Hardware StackIP/OTT-only equipment accounted for 62.15% of the OTT set-top box market size in 2025 and is projected to grow at a 9.21% CAGR through 2031. It was both the largest and fastest-growing product category, suggesting faster full-IP migration in Western Europe and South America. Removing DVB-T2, DVB-S2, and ISDB-T tuners lets manufacturers direct silicon capacity toward AV1 decoding, hardware DRM, and Wi-Fi 6E. This design gives the OTT set-top box market a clearer way to compete with integrated television software at similar prices. It also reduces the need to maintain broadcast and IP functions in the same chassis for long periods.
Skyworth and Amlogic presented a 6 nm system-on-chip 4K Android TV Operator Tier device at IBC 2025 with edge AI and camera functions for gesture control and fitness applications. These functions fit an IP-only design more readily than a hybrid broadcast chassis. Hybrid devices remain relevant where terrestrial or satellite continuity is required, including rural North America, Southern Europe, and Brazil’s TV 3.0 transition areas. Larger operators use cloud-managed IP devices that support over-the-air updates, while regional operators with limited cloud capacity retain hybrid equipment to maintain signal continuity. U.S. navigation rules support interoperable customer equipment and favor certified platforms over more closed legacy designs.


By Operating System and Platform:
Android TV and Google TV Lead Operator DeploymentsAndroid TV and Google TV held 34.52% of the global operating system and platform category in 2025 and are expected to expand at an 8.94% CAGR through 2031. The category was both the largest and fastest-growing platform group in the OTT set-top box market. Operator Tier gives telecom providers branded home screens, integrated DRM, and certified software without requiring proprietary middleware. This has made it a common deployment choice for European and Asian operators. RDK ranked second and exceeded 200 million shipped devices globally in September 2025.
Vodafone used RDK-B as the central platform for Wi-Fi 7 fiber and DOCSIS customer equipment in the United Kingdom and Germany.[2]RDK Management, “RDK Deployed by Vodafone as Centralized Software Platform,” RDK Central, rdkcentral.com Proprietary choices such as Roku OS, tvOS, and Amazon’s Linux-based Vega OS retain a role where advertising, subscriptions, and content aggregation justify platform investment. Chinese content policy and platform preferences favor Huawei, ZTE, and Skyworth devices serving iQiyi, Tencent Video, and Bilibili. Android TV users gain certification and Widevine L1 support but pay royalties, while RDK avoids those royalties but requires middleware investment. Amino’s April 2026 certification for DELTA Fiber Nederland and Orange Belgium’s Android TV deployment show that operator-tier systems are becoming standard procurement specifications.
By Distribution Channel:
Operators Lead While Retail ExpandsTelecom, broadband, and pay-TV operators captured 58.73% of global distribution value in 2025, as they commonly subsidize equipment through multi-year service contracts. Retail is projected to grow at an 8.88% CAGR through 2031, the fastest rate among distribution channels. Amazon Fire TV, Roku, and Apple TV 4K have built device ecosystems that consumers recognize outside telecom bundles. Retail demand is strong in North America and Western Europe, and it can grow in the Asia-Pacific, where consumer electronics retail reaches more households than postpaid telecom services. This creates a second route to the OTT set-top box market beyond the operator-supplied model.
Distributors and systems integrators retain a stable role in hospitality, health care, and enterprise installations that require custom IPTV integration and managed device support. Cloud-managed customer equipment is reducing the technical distinction between operator devices and retail products in the OTT set-top box industry. A certified Android TV Operator Tier product from Sagemcom or Kaonmedia can reach both channels with different software and commercial terms. Installments below USD 10 per month can make devices costing USD 80 to USD 120 accessible to households that would not be able to pay the full retail price. This makes operators a financing and distribution route as well, allowing broadband packages to include a higher-capability device.

Geography Analysis
North America OTT Set-Top Box Market
North America accounted for 43.58% of the global OTT set-top box market share in 2025, supported by higher selling prices, established streaming platforms, and a large cord-cutting population. Roku’s 2025 annual report recorded USD 4.74 billion in revenue, USD 88.4 million in net income, and record free cash flow, showing that platform monetization rather than device margin drives leading regional platforms. Fox announced a proposed USD 22 billion acquisition of Roku in June 2026, subject to regulatory approval and expected to close in the first half of 2027.[3]Fox Corporation, “Fox Corporation Announces USD 22 Billion Acquisition of Roku,” Fox Business, foxbusiness.com The proposal would combine Roku’s connected television platform with Tubi and Fox content, increasing competition with Amazon Fire TV, Google TV, and Apple TV. Canada has a mature OTT base supported by broadband, while Mexico is shifting from direct-to-home satellite to IPTV and broadband services as fiber expands into secondary cities.
APAC OTT Set-Top Box Market
Asia-Pacific is projected to be the fastest-growing region, with a 9.06% CAGR through 2031. India’s JioFiber expansion and Airtel Xstream bundles are moving households from legacy direct-to-home equipment toward IP-capable streaming devices, while the country’s broadband subscriber base is projected to grow from 700 million in 2025 to more than 1.1 billion by 2030. China has the largest IPTV subscriber base and is projected to reach 500-550 million households by 2030, although MIIT certification and GB hardware standards steer demand toward domestic vendors and streaming services. Southeast Asia is a FAST growth area, and enforcement against MyIPTV4K in May 2026 indicates that certified devices can support anti-piracy efforts. These factors make Asia-Pacific an important expansion area for the OTT set-top box market.
EMEA and South America OTT Set-Top Box Market
Europe is modernizing through Android TV Operator Tier and RDK deployments, with Telenor’s January 2026 T-We Boks III launch in Norway forming a basis for a Nordic service across Norway, Sweden, and Finland. South America is recording moderate volume growth as Brazil continues its digital transition, and ZTE and Claro launched the 4K Ultra HD IP STB Z4KW6 with Ultra HD video, voice control, Wi-Fi, and local streaming access in May 2026. Middle East and Africa remains smaller in value but is developing as Saudi Arabia expands fiber-to-the-home and operators deploy IPTV-ready equipment. The OTT set-top box market can gain in these regions where streaming subscriber growth requires a device that supports managed video delivery.

Competitive Landscape
The OTT set-top box market is moderately concentrated at the platform level and fragmented among hardware original design manufacturers. Roku, Amazon, and Google compete through content discovery, advertising, and operating system licensing rather than device margins. Skyworth, Sagemcom, Kaonmedia, and Vantiva compete on manufacturing cost, certification speed, and customized software deployments for operators. Their products must meet Widevine, PlayReady, and Android TV Operator Tier requirements while serving several operator customers on common hardware designs. This creates an opening in Southeast Asia, Africa, and South America for managed cloud customer-equipment services, where supporting global platform costs and local middleware development is difficult.
Skyworth’s IBC 2025 4K Android TV device with Amlogic’s 6nm S905X5M chip added camera-based gesture control, fitness features, and connected-home capabilities.[4]TV Technology, “iWedia and Skyworth Partner on Turnkey Solutions for NextGen TV,” TV Technology, tvtechnology.com The product shows how device suppliers add functions that typical smart television interfaces do not offer at the same price. Roku’s 2025 results showed how a platform can separate its earnings model from hardware margin through advertising and subscriptions. Amazon completed a global rollout of a redesigned Fire TV interface in June 2026 and introduced the Ember Artline lifestyle television, extending its use of hardware for content discovery.
The proposed Fox-Roku transaction would combine a live television and FAST service with Roku’s connected television platform, subject to approval. Its USD 400 million annual run-rate synergy target reflects a focus on advertising and distribution rather than standalone device sales. Larger telecom operators may choose integrated platform stacks rather than separately sourcing customer equipment, middleware, and DRM services, reducing the number of large customers for hardware-focused manufacturers. Smaller operators can still seek suppliers that combine certified hardware with cloud management and local content integration.
OTT Set-Top Box Industry Leaders
Roku, Inc.
Amazon.com, Inc.
Apple Inc.
Google LLC
Xiaomi Corporation
- *Disclaimer: Major Players sorted in no particular order
OTT Set-Top Box Market Companies Covered in this Report
- Roku, Inc.
- Amazon.com, Inc.
- Apple Inc.
- Google LLC
- Samsung Electronics Co., Ltd.
- Vantiva SA
- SAGEMCOM Broadband SAS
- Skyworth Digital Technology Co., Ltd.
- Huawei Technologies Co., Ltd.
- ZTE Corporation
- Humax Co., Ltd.
- CommScope Holding Company, Inc.
- Kaonmedia Co., Ltd.
- Shenzhen SDMC Technology Co., Ltd.
- Xiaomi Corporation
- Comcast Corporation
- Netgem SA
- Vestel Elektronik Sanayi ve Ticaret A.S.

Recent Industry Developments in OTT Set-Top Box Market
- June 2026: Fox Corporation announced a USD 22 billion acquisition of Roku, Inc., at USD 160 per share in cash and stock, subject to regulatory approvals and expected to close in the first half of calendar year 2027. The combined entity will merge Fox's Tubi FAST platform with Roku's 100-million-household CTV platform, representing one of the largest media consolidation events in the streaming era with USD 400 million in targeted run-rate synergies.
- June 2026: Amazon completed the global rollout of a redesigned Fire TV user interface across all current-generation Fire TV Stick devices and Ember smart TVs worldwide, following its February 2026 launch in North America. The upgrade, which also introduced the Amazon Ember Artline lifestyle TV, reflects Amazon's strategy of treating Fire TV hardware as a vehicle for content discovery monetization powered by Alexa+.
- April 2026: DELTA Fiber Nederland and Amino completed the Google Android TV Operator Tier certification of Amino's Amigo 7N set-top box, confirmed by the International Association for Media Technology. The certification enables DELTA to deploy cloud-managed Android TV services to its fiber subscriber base, with Amino's Engage platform providing centralized device lifecycle management.
- March 2026: Roku launched Apple TV on The Roku Channel in the U.S. through its Premium Subscriptions program, allowing Roku customers to subscribe to Apple TV at USD 12.99 per month, deepening content aggregation breadth across competing platform ecosystems.


Global OTT Set-Top Box Market Report Scope
The OTT set-top box market covers devices that enable users to stream over-the-top video and audio content over the internet to televisions and other display screens without relying on traditional cable or satellite TV services. The study analyzes market trends, growth drivers, restraints, and opportunities across key device types, distribution channels, end-user segments, and geographies.
The OTT Set-Top Box Market Report is Segmented by Product Type (IP/OTT-Only Set-Top Boxes and Hybrid Broadcast-OTT Set-Top Boxes), Operating System and Platform (Android TV and Google TV, RDK, Proprietary Consumer Platforms, and Other Linux-Based and Operator Platforms), Distribution Channel (Retail, Telecom, Broadband, and Pay-TV Operators, and Distributors and Systems Integrators), and Geography (North America, South America, Europe, Asia-Pacific, Middle East, and Africa). The Market Forecasts Are Provided in Terms of Value (USD).
| IP/OTT-Only Set-Top Boxes |
| Hybrid Broadcast-OTT Set-Top Boxes |
| Android TV and Google TV |
| RDK |
| Proprietary Consumer Platforms |
| Other Operating System and Platforms |
| Retail |
| Telecom, Broadband, and Pay-TV Operators |
| Distributors and Systems Integrators |
| North America | United States |
| Canada | |
| Mexico | |
| South America | Brazil |
| Argentina | |
| Chile | |
| Rest of South America | |
| Europe | Germany |
| United Kingdom | |
| France | |
| Italy | |
| Spain | |
| Rest of Europe | |
| Asia-Pacific | China |
| Japan | |
| India | |
| South Korea | |
| Australia | |
| Rest of Asia-Pacific | |
| Middle East | Saudi Arabia |
| United Arab Emirates | |
| Qatar | |
| Rest of Middle East | |
| Africa | South Africa |
| Egypt | |
| Nigeria | |
| Rest of Africa |
| By Product Type | IP/OTT-Only Set-Top Boxes | |
| Hybrid Broadcast-OTT Set-Top Boxes | ||
| By Operating System and Platform | Android TV and Google TV | |
| RDK | ||
| Proprietary Consumer Platforms | ||
| Other Operating System and Platforms | ||
| By Distribution Channel | Retail | |
| Telecom, Broadband, and Pay-TV Operators | ||
| Distributors and Systems Integrators | ||
| By Geography | North America | United States |
| Canada | ||
| Mexico | ||
| South America | Brazil | |
| Argentina | ||
| Chile | ||
| Rest of South America | ||
| Europe | Germany | |
| United Kingdom | ||
| France | ||
| Italy | ||
| Spain | ||
| Rest of Europe | ||
| Asia-Pacific | China | |
| Japan | ||
| India | ||
| South Korea | ||
| Australia | ||
| Rest of Asia-Pacific | ||
| Middle East | Saudi Arabia | |
| United Arab Emirates | ||
| Qatar | ||
| Rest of Middle East | ||
| Africa | South Africa | |
| Egypt | ||
| Nigeria | ||
| Rest of Africa | ||


Key Questions Answered in the Report
What is the OTT set-top box market size?
The OTT set-top box market was valued at USD 4.84 billion in 2025, is estimated at USD 5.23 billion in 2026, and is forecast to reach USD 7.91 billion by 2031 at an 8.63% CAGR. Its growth reflects the ongoing change from broadcast-dependent hardware to IP-based equipment.
What is driving demand for OTT set-top boxes?
Cord-cutting, fiber and 5G fixed wireless expansion, FAST services, and 4K premium content are increasing demand for certified IP-based devices. These factors strengthen the OTT set-top box market by favoring equipment that can manage content guides, secure playback, and operator software updates.
Which product type leads global demand?
IP/OTT-only set-top boxes led with 62.15% of value in 2025 and are projected to grow at a 9.21% CAGR through 2031. Removing broadcast tuners allows suppliers to focus device resources on video decoding, Wi-Fi connectivity, and hardware DRM.
Which platform category is expanding fastest?
Android TV and Google TV held 34.52% of the platform category in 2025 and are expected to expand at an 8.94% CAGR through 2031. Their Operator Tier option gives providers a certified base while retaining control of the customer-facing interface.
Why do operators continue to supply set-top boxes?
Operators can bundle devices with broadband contracts, manage services through the cloud, and offer financing that makes USD 80 to USD 120 devices more accessible. This model helps customers obtain a higher-capability device without paying the full retail amount at installation.
How do smart televisions affect standalone devices?
Smart televisions reduce demand for entry-level hardware, but live sports, premium video, advanced DRM, and connected-home functions continue to support higher-capability devices. The remaining opportunity is strongest where integrated television software does not consistently meet performance, security, or service-management needs.
Page last updated on:





