
OTT Payment Solutions Market Size and Share
Market Overview
| Study Period | 2020 - 2031 |
|---|---|
| Market Size (2026) | USD 1.15 Billion |
| Market Size (2031) | USD 1.99 Billion |
| Growth Rate (2026 - 2031) | 11.66 % |
| Fastest Growing Market | Asia-Pacific |
| Largest Market | North America |
| Market Concentration | Medium |
Major Players *Disclaimer: Major Players sorted in no particular order Image © Mordor Intelligence. Reuse requires attribution under CC BY 4.0. | |
OTT Payment Solutions Market Analysis by Mordor Intelligence
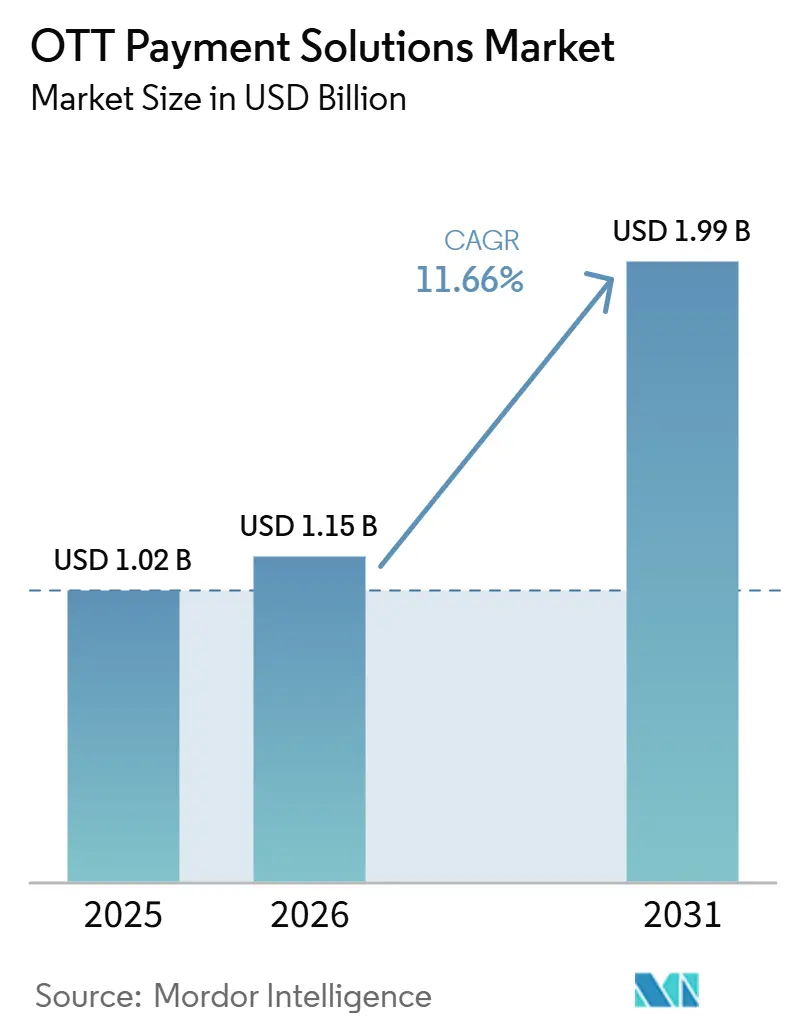
The OTT Payment Solutions Market size was valued at USD 1.02 billion in 2025 and estimated to grow from USD 1.15 billion in 2026 to reach USD 1.99 billion by 2031, at a CAGR of 11.66% during the forecast period (2026-2031). The OTT Payment Solutions Market is expanding as streaming providers treat billing, payment acceptance, and subscriber access as connected commercial functions. Hybrid plans require systems to manage paid, advertising-supported, and free access within the same customer relationship. Providers are also broadening payment coverage as local wallets, bank-based payments, and carrier billing become more relevant outside card-led markets. Competition is moving beyond transaction processing toward subscriber lifecycle management, payment recovery, and entitlement control. Fraud, varied compliance obligations, and app-store billing rules continue to affect the cost and design of payment operations.
Key Report Takeaways
- By payment method, credit and debit cards held 45.44% of the market share of the OTT payment solutions market in 2025, while digital wallets and e-money are projected to expand at a 12.01% CAGR through 2031.
- By revenue model, recurring subscription billing, or SVOD, commanded 55.68% of the market share of the OTT payment solutions market in 2025, while advertising-supported billing, or AVOD/FAST, is projected to grow at an 11.89% CAGR through 2031.
- By deployment mode, cloud-based deployment accounted for 65.73% of the market share in 2025 and is projected to expand at a 12.23% CAGR through 2031.
- By platform type, mobile applications held 41.19% share in 2025, while Smart TV is projected to grow at an 11.95% CAGR through 2031.
- By OTT customer type, broadcasters accounted for 46.32% share in 2025, while telecom and Pay-TV operators are projected to expand at a 12.06% CAGR through 2031.
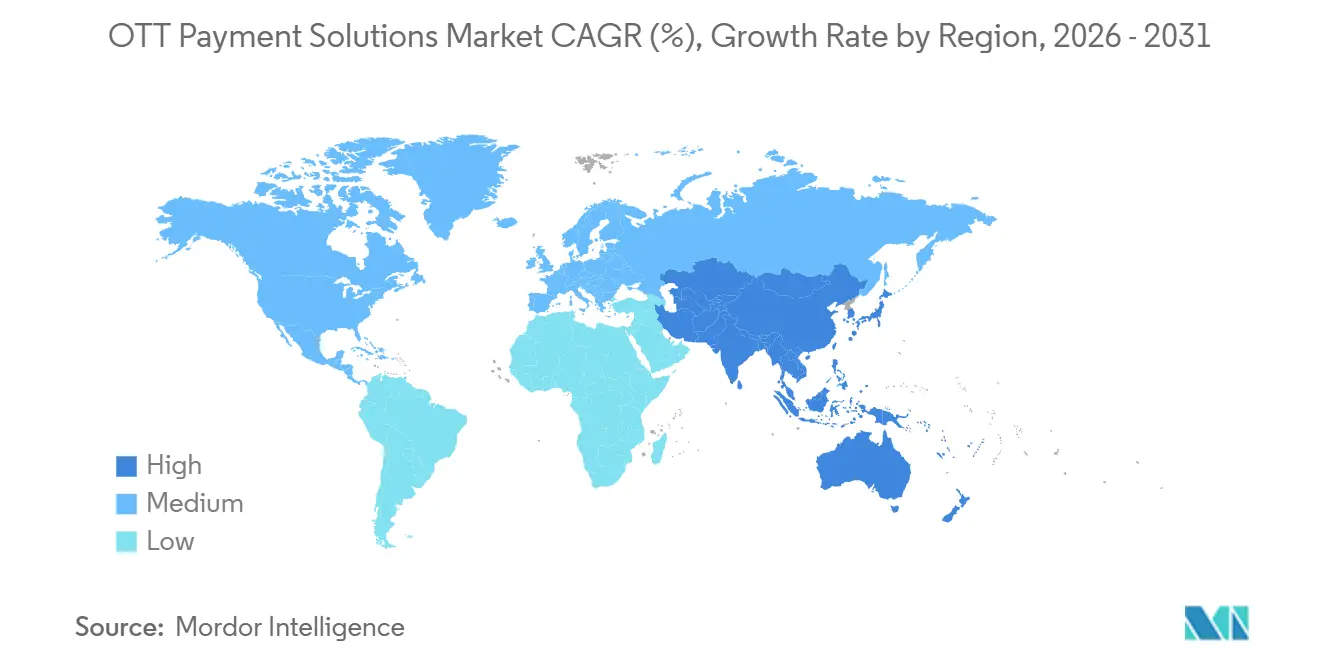
- By geography, North America held 35.91% share in 2025, while Asia-Pacific is projected to advance at an 11.81% CAGR through 2031.
Note: Market size and forecast figures in this report are generated using Mordor Intelligence’s proprietary estimation framework, updated with the latest available data and insights as of January 2026.
Market Trends and Insights
Drivers Impact Analysis of OTT Payment Solutions Market*
| Driver | (~) % Impact on CAGR Forecast | Geographic Relevance | Impact Timeline |
|---|---|---|---|
| Expansion of Subscription and Hybrid OTT Monetization | +3.5% | Global | Medium term (2-4 years) |
| Rising Digital Wallet and Account-to-Account Payment Adoption | +2.8% | Asia-Pacific core, spill-over to South America and Middle East and Africa | Short term (≤ 2 years) |
| Increasing Demand for Payment Recovery and Involuntary Churn Reduction | +2.2% | Global | Medium term (2-4 years) |
| Cross-Border OTT Expansion and Local Payment Acceptance | +1.8% | Asia-Pacific, South America, Middle East and Africa | Medium term (2-4 years) |
| Real-Time Entitlement Activation and Payment-Access Synchronization | +1.2% | North America and Europe | Short term (≤ 2 years) |
| Telco and OTT Bundling Through Carrier Billing | +1% | Asia-Pacific, Middle East and Africa, South America | Long term (≥ 4 years) |
| Source: Mordor Intelligence | |||
Expansion of Subscription and Hybrid OTT Monetization Drives Revenue Infrastructure Complexity
SVOD subscribers are increasingly adopting paid advertising-supported tiers, requiring the OTT Payment Solutions Market to support ad-free, ad-lite, and freemium access within a single subscriber record. Each plan may include different payment conditions, access rights, and renewal rules, creating more complex billing and entitlement scenarios. Continued growth in global FAST viewing and ad impressions is making advertising-supported reconciliation a critical requirement for payment providers. The expanding subscription advertising opportunity across major U.S. streaming platforms is also strengthening demand for systems that can reconcile advertising proceeds with subscription charges. The OTT Payment Solutions Market must therefore accommodate variable commercial arrangements within a single plan and enable timely updates when users switch tiers or change payment methods. European billing operations also face requirements around clear disclosures for hybrid services under the Digital Services Act, favoring providers that can connect billing functions with subscriber records and entitlement controls.
Rising Digital Wallet and Account-to-Account Payment Adoption Reshapes Authorization Economics
A Stripe experiment showed that offering a locally relevant payment method beyond cards improved revenue and conversion for subscription platforms, positioning local payment acceptance as a commercial priority rather than an optional checkout feature. The OTT Payment Solutions Market must support wallets, bank payments, and card payments without creating separate subscriber journeys, especially in markets where card ownership trails smartphone and wallet use. These methods can also reduce failed-payment exposure during renewals, making payment orchestration more important as providers select the method most likely to complete each transaction. The expansion of bank-backed account-to-account options, recurring debit functionality, and global payment network partnerships is broadening the payment choices that streaming platforms need to support, while PSD3 is expected to encourage wider open-banking use for recurring transactions across the European Union.
Increasing Demand for Payment Recovery and Involuntary Churn Reduction Opens a New Performance Layer
Failed payments remain a major driver of involuntary churn among OTT subscribers, even when customers intend to keep the service. The OTT Payment Solutions Market is responding with dunning tools, retry rules, credential update services, and AI-driven recovery engines that improve payment recovery compared with static retry logic. Intelligent dunning with propensity modeling can help preserve revenue for platforms processing large subscription volumes, while card updater services reduce disruption from expired or replaced credentials. As a result, providers are placing greater emphasis on recovery performance after the initial payment attempt to retain revenue without increasing subscriber acquisition spending.
Cross-Border OTT Expansion and Local Payment Acceptance Creates a Structurally Underserved Opportunity
Cross-border streaming expansion exposes payment gaps that card-only checkout cannot address, as strong e-wallet adoption in Indonesia and broad GCash usage in the Philippines make local payment acceptance critical for converting users who do not rely on cards. The OTT Payment Solutions Market requires payment coverage aligned with local consumer behavior rather than a single global checkout model, particularly across Asia-Pacific, South America, the Middle East, and Africa markets. Cleeng and dLocal partnered to enable Pix payments for Brazilian direct-to-consumer subscription platforms, while STARZPLAY partnered with TPAY to enable carrier billing for Orange Tunisia, Sudatel Sudan, and Chinguitel Mauritania users. Local payment methods can support acquisition and reduce renewal declines in lower-card-penetration markets. Payment licensing requirements in India, Brazil, and Nigeria influence which providers can serve as settlement infrastructure, increasing the value of providers with established local connections.
Restraints Impact Analysis of OTT Payment Solutions Market*
| Restraint | (~) % Impact on CAGR Forecast | Geographic Relevance | Impact Timeline |
|---|---|---|---|
| Payment Fraud, Chargebacks, and Account Takeover Exposure | -0.8% | Global | Short term (≤ 2 years) |
| Fragmented Tax, Data-Residency, and Payment-Compliance Requirements | -0.6% | Europe and Asia-Pacific core | Medium term (2-4 years) |
| App-Store Billing Restrictions and Revenue-Share Pressure | -0.4% | North America and Europe | Short term (≤ 2 years) |
| OTT Payment Data Fragmentation Across Devices and Storefronts | -0.3% | Global | Long term (≥ 4 years) |
| Source: Mordor Intelligence | |||
Payment Fraud, Chargebacks, and Account Takeover Exposure Impose Structural Cost and Trust Deficits
Payment fraud remains a key challenge as fraudsters increasingly target accounts that store payment credentials, subscription access, and loyalty value. The OTT Payment Solutions Market must protect both account access and payment transactions, increasing demand for identity controls, device analysis, and fraud monitoring. Account takeover incidents can create losses beyond unauthorized charges, as affected consumers may lose trust and discontinue platform use. PCI DSS Level 1, PSD2 Strong Customer Authentication, and NIST digital identity guidance add compliance requirements to fraud prevention programs. Payment suppliers must balance these controls with seamless account access and renewal flows.
Fragmented Tax, Data-Residency, and Payment-Compliance Requirements Constrain Global Billing Scalability
OTT platforms operating across borders must comply with digital services tax rules, data-residency requirements under the EU GDPR, India's Digital Personal Data Protection Act, and Brazil's LGPD, as well as country-specific recurring billing mandates and payment licensing requirements. The OTT Payment Solutions Market must manage these obligations while maintaining reliable provisioning and payment flows. Mid-size streaming providers often face the same regulatory requirements as major global services but may lack comparable legal and engineering resources. As no single billing platform natively manages the full compliance stack for broad international operations, operators rely on parallel tools for tax, privacy, reporting, and payment controls, which can increase integration work and delay subscriber activation. Merchant-of-record models from providers such as Paddle, FastSpring, and Cleeng can shift parts of the compliance obligation but may reduce direct control over subscriber data and reconciliation visibility. ISO 20022 adds further technical requirements for platforms building recurring bank-payment capabilities.
*Our forecasts treat driver/restraint impacts as directional, not additive. The impact forecasts reflect baseline growth, mix effects, and variable interactions.
OTT Payment Solutions Market Segment Analysis
By Payment Method:
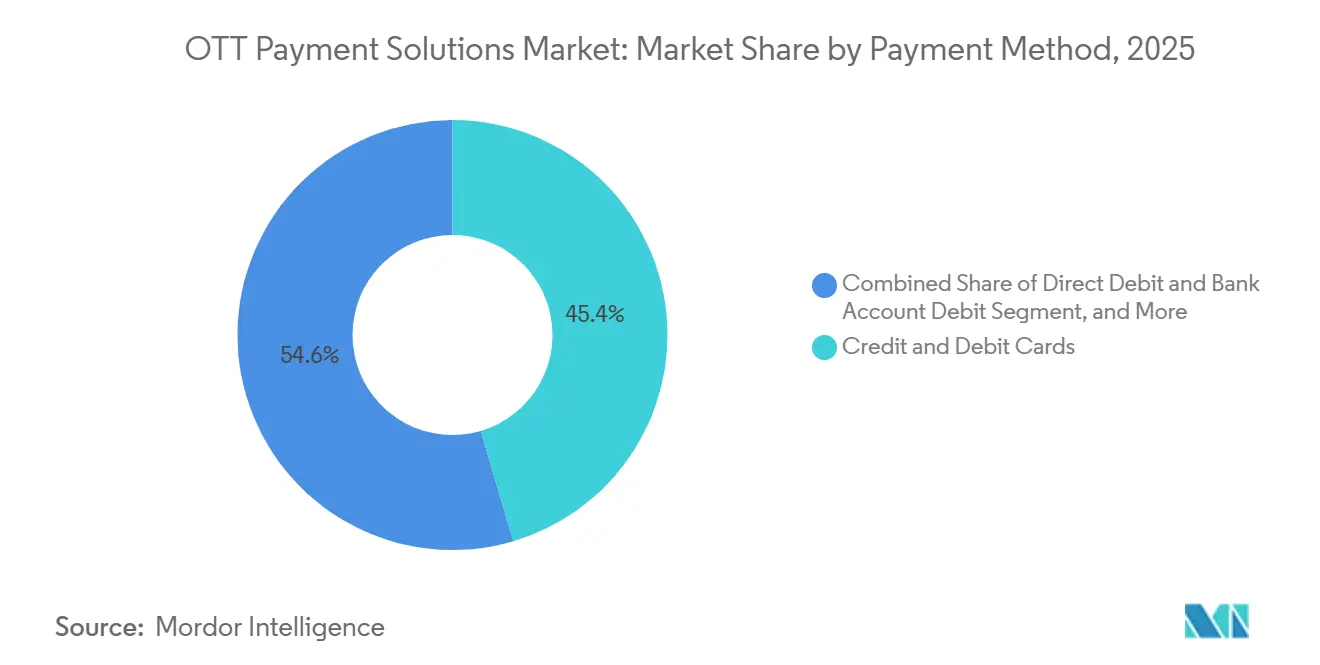
Cards Anchor Revenue While Wallets Capture Conversion MomentumCredit and debit cards held 45.44% of the market share in 2025. Their position reflects broad device compatibility and established card-on-file arrangements for recurring billing. Cards remain familiar to both streaming providers and subscribers. They are also embedded in many existing billing stacks. However, card-only checkout can limit conversion where wallet use is greater than card use. The OTT Payment Solutions Market is therefore adding more payment options across checkout and renewal flows. Local method coverage matters most where cards are not the preferred digital payment instrument. It can also help providers serve customers who have smartphones but do not hold credit cards. Card systems still require token management, credential updates, and effective decline handling. These needs keep card infrastructure central even as payment diversity increases.
Digital wallets and e-money are projected to grow at a 12.01% CAGR through 2031. Super-app payment ecosystems in Asia-Pacific support this expansion. UPI has a major role in India's payment environment, while Wero is extending recurring subscription capability in Germany and France. Direct debit and bank account debit retain a role for high-volume European subscriptions. Direct carrier billing offers a route to users with active mobile accounts but no preferred wallet or card. Buy now, pay later can appeal to younger users seeking flexible payment arrangements in markets such as Saudi Arabia and the United Arab Emirates. Stripe's April 2025 Adaptive Checkout experiment reported a 3-8% authorization-rate lift for enabled stores.[1]Stripe, “Adaptive Checkout Experiment Results,” Stripe, stripe.com Dynamic method presentation can therefore support authorization performance. Smart TV payment flows also need custom approaches when standard 3D Secure challenges cannot render on a television screen.



By Revenue Model:
SVOD Leads While Hybrid Billing Adds Operational DemandsRecurring subscription billing, or SVOD, accounted for 55.68% of the market share in 2025. This position reflects established subscription models across North America, Europe, and higher-income Asia-Pacific markets. Mature SVOD operations rely on reliable recurring collection and subscriber access controls. Billing providers compete through payment recovery, network tokenization, and retry intelligence. These capabilities address revenue leakage after a customer has already subscribed. Large streaming services also require regional pricing, plan changes, refunds, and entitlement updates. The OTT Payment Solutions Market supports these functions through linked payment and subscriber records. SVOD remains a foundational revenue model for premium video services. Its operational maturity does not remove the need for billing improvement. It shifts attention toward retention and renewal performance.
Advertising-supported billing, including AVOD and FAST, is projected to grow at an 11.89% CAGR through 2031. Hybrid SVOD and AVOD advertising revenue in the United States reached USD 14.2 billion in 2025. Amagi reported that global FAST viewing hours increased 55% year over year through June 2026.[2]Amagi, “Amagi Releases June 2026 AIRTIME Report: FAST Viewing Hours Grow 55% YoY as Metadata Friction Escalates,” Amagi, amagi.com Transactional billing, including TVOD and pay-per-view, remains linked to live sports and premium release windows. Hybrid monetization billing combines subscriptions, advertising, and one-time purchases in a single customer relationship. This requires the platform to align ad attribution, renewal status, and purchase access across devices. Payment event webhooks and entitlement systems can help manage these simultaneous updates. ISO 27001-compliant handling is increasingly relevant where billing platforms process financial and behavioral data together.
By Deployment Mode:
Cloud-Based Platforms Lead Payment OrchestrationCloud-based deployment held 65.73% of the market share in 2025. It is also projected to grow at a 12.23% CAGR through 2031. The combination shows that cloud delivery has both scale and continuing growth. Cloud platforms can support multi-gateway routing across different acquiring partners. They can also apply real-time retry decisions and token updates across markets. These capabilities are important for streaming services that accept several payment methods. Cloud systems can be updated without requiring each customer to maintain local infrastructure. This supports faster integration of wallets, banking methods, and fraud controls. The OTT Payment Solutions Market uses this flexibility to address global payment fragmentation. Cloud delivery also supports data sharing between billing, support, and entitlement functions.
Zuora supports more than 40 payment gateways and more than 20 payment methods. This illustrates the composability that cloud billing platforms can provide. On-premise systems remain relevant for regulated European broadcasters and state-affiliated streaming operators. These organizations can face data-residency requirements or content licensing conditions that limit third-party cloud use. Hybrid deployment supports companies moving from legacy business support systems to cloud orchestration. Such operators may retain on-premise financial reconciliation for audit and revenue assurance. Germany's nexnet operates subscription billing on Germany-hosted servers for local data security needs. The deployment choice therefore depends on compliance, legacy architecture, and required payment coverage. Providers that support flexible deployment models can serve more varied OTT operating environments.
By Platform Type:
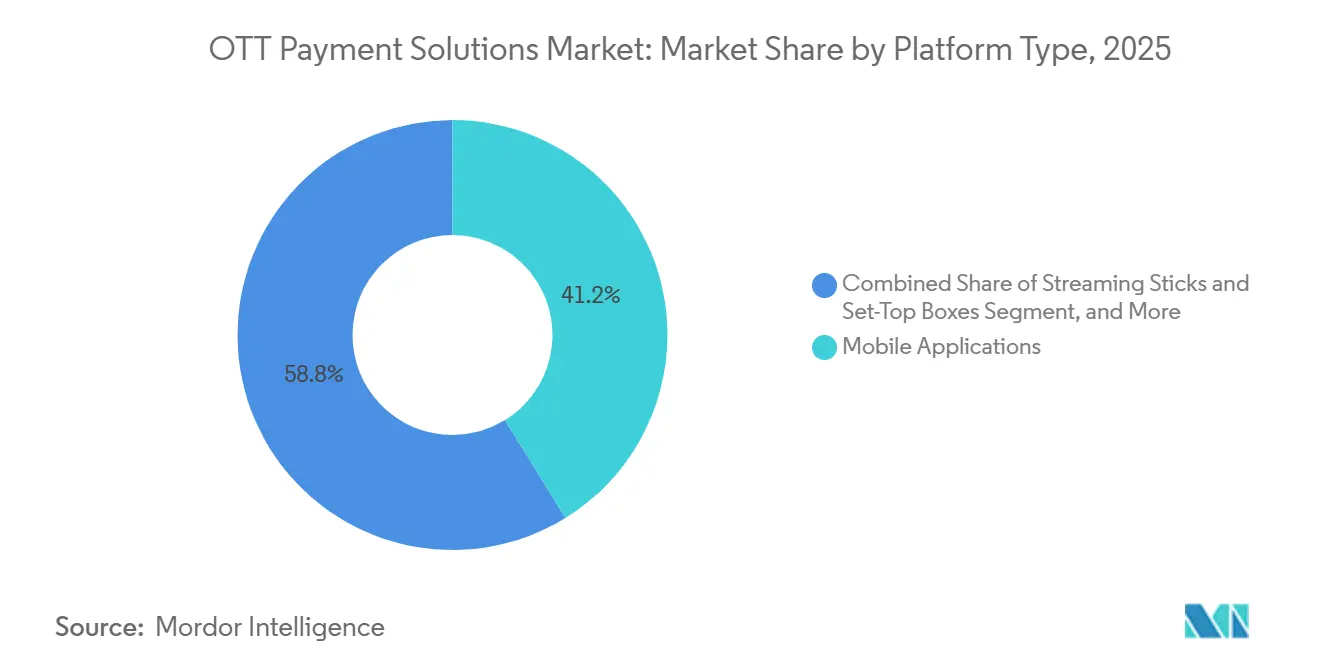
Mobile Applications Lead While Smart TV ExpandsMobile applications held 41.19% of the market share in 2025. This reflects mobile-first viewing patterns across Asia-Pacific and Sub-Saharan Africa. In many markets, smartphone access preceded fixed broadband and connected television adoption. Mobile payment flows need compact checkout interfaces and local wallet software development kits. They can also use SIM-based authentication and carrier billing. These requirements differentiate mobile billing from desktop and television transactions. The OTT Payment Solutions Market must support payment experiences that fit small screens and local mobile behaviors. App-store billing policies can further shape mobile payment choices. Mobile remains an important access point for discovery, subscription, and account management. It also provides the broadest reach for many emerging-market streaming services.
Smart TV is projected to grow at an 11.95% CAGR through 2031. Connected television use and household co-viewing are moving more premium viewing toward living-room screens. Smart TV creates a particular authentication issue because standard SCA challenge screens may not render in its browser environment. This calls for custom compliant flows that maintain convenient checkout. Solidgate reported a 3.5% payment-conversion improvement for MEGOGO after Smart TV checkout became SCA-compliant. Streaming sticks and set-top boxes remain relevant carrier-supported distribution points for bundled subscriptions. Gaming consoles serve a narrower group with higher average revenue potential. These devices can connect entertainment subscriptions with gaming account management. Platform providers must keep payment status and viewing rights consistent across all connected screens. This makes device-level payment data coordination an ongoing operational issue.
By OTT Customer Type:
Broadcasters Lead While Telcos Extend BundlesBroadcasters held 46.32% of the market share in 2025. Legacy media groups are moving toward direct-to-consumer models and require payment systems that support multiple content windows. The same title may appear across SVOD, TVOD, and AVOD services. Broadcasters also manage regional pricing, licensing rules, and large subscriber populations. These conditions require detailed entitlement management at scale. Standard software-as-a-service billing tools may not cover all broadcast-specific needs. The OTT Payment Solutions Market serves this group with payment, access, and subscriber-lifecycle functions. Broadcasters need systems that can apply plan rules without disrupting viewing access. They also need reliable reconciliation for advertising-supported and paid services. This preserves broadcasters' leading role among customer groups.
Telecom and Pay-TV operators are projected to grow at a 12.06% CAGR through 2031. Their growth is linked to subscription bundles that place streaming services on a carrier invoice. KDDI selected Bango's Digital Vending Machine in January 2026 for povo2.0 prepaid subscribers. Bango also partnered with Turkcell in June 2026 to support streaming super-bundles. These arrangements combine onboarding, billing, and account management in a carrier-led experience. They can make payment collection less dependent on an individual card renewal. Carrier billing can reduce involuntary churn because the operator addresses collection within its established billing relationship. Other customer types include niche SVOD operators, sports services, and FAST channel publishers. Their needs are varied and often require specialized billing configuration. Specialist vendors can address this long tail of customized requirements.
Geography Analysis
North America OTT Payment Solutions Market
North America held 35.91% market share in 2025. The region contains global streaming headquarters, advanced fraud tools, and an average of 4.1 streaming subscriptions per household in 2026. The United States and Canada accounted for 74% of global ad impressions tracked by Amagi through June 2026. PCI DSS, NACHA rules for ACH billing, and state cancellation laws shape regional payment operations.
APAC OTT Payment Solutions Market
Asia-Pacific is projected to grow at an 11.81% CAGR through 2031. India had 601 million OTT users, 119 million paying subscribers, and more than 12 billion UPI transactions each month in 2026. Indonesia's urban smartphone e-wallet adoption exceeded 85% in 2025, while Southeast Asian paid streaming accounts rose 19% to more than 61 million. Japan also relies on carrier-led payment options, including Disney+ support for NTT Docomo's d-Pay, au PAY, and SoftBank/Y!Mobile. Payment licensing and data-localization rules influence settlement capabilities throughout the region.
EMEA and South America OTT Payment Solutions Market
Europe held the second-largest regional position in 2025. GoCardless launched Recurring Pay by Bank in the United Kingdom on June 2, 2026, while Wero moved toward subscription payment workflows in Germany and France. South America, Middle East and Africa offer growth opportunities where mobile wallets and carrier billing can be more accessible than cards. Pix Automático supports recurring subscription debit in Brazil, and carrier billing initiatives expanded in Tunisia, Sudan, Mauritania, and Nigeria.

Competitive Landscape
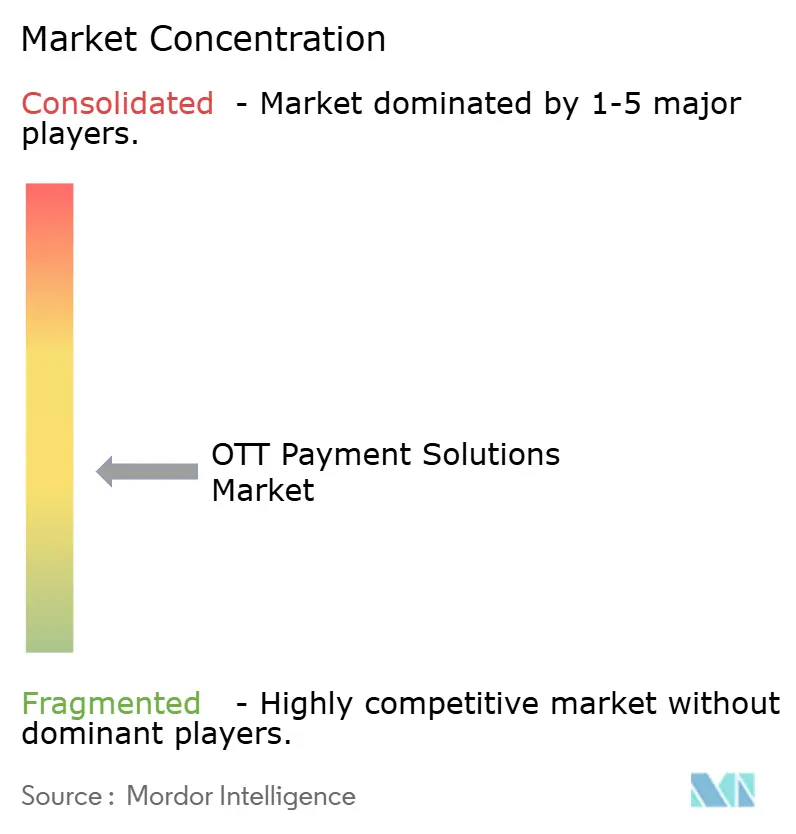
The OTT Payment Solutions Market has a moderately consolidated upper tier and a fragmented specialist group. Stripe, Adyen, and PayPal bring broad payment-processing scale, while Cleeng, Evergent, Recurly, and Chargebee focus on subscription billing. Adyen reported EUR 2.36 billion (USD 2.68 billion) in fiscal year 2025 net revenue and EUR 1.39 trillion (USD 1.58 trillion) in processed volume. It agreed to acquire Orb for USD 335 million in June 2026, extending its offering toward billing lifecycle management. Stripe's June 2025 charter approval in Georgia provided direct Visa and Mastercard access without a sponsoring bank.
Recurly expanded to more than 140 payment methods and local gateways in October 2025. It's May 2026, partnership with Juspay connected merchants to more than 300 payment service providers and acquirers through 1 integration. Boku completed its first cross-border UPI transactions in June 2026. Bango's 2026 partnerships with KDDI and Turkcell covered 70 million and 43 million subscribers, respectively. These providers compete through carrier billing, recovery tools, payment coverage, and entitlement capabilities.
LINE NEXT's Unifi Pay began pre-registration in 2026 for a planned third-quarter launch in Japan, Indonesia, Taiwan, and Thailand. The GSMA Open Gateway initiative standardizes telecom network interfaces for fraud prevention, SIM authentication, and number verification.[3]GSMA, “Open Gateway Initiative,” GSMA, gsma.com PCI DSS Level 1 certification and EMVCo 3D Secure 2.x compliance remain important requirements for enterprise payment providers. The competitive field therefore combines large processors, billing specialists, carrier billing providers, and telecom partners.
OTT Payment Solutions Industry Leaders
Stripe, Inc.
Adyen N.V.
PayPal Holdings, Inc.
Chargebee Inc.
Zuora, Inc.
- *Disclaimer: Major Players sorted in no particular order
OTT Payment Solutions Market Companies Covered in this Report
- Stripe, Inc.
- Adyen N.V.
- PayPal Holdings, Inc.
- Braintree
- Chargebee Inc.
- Zuora, Inc.
- Cleeng B.V.
- Evergent Technologies, Inc.
- Recurly, Inc.
- Paddle.com Market Limited
- FastSpring, Inc.
- Worldpay, LLC
- Fiserv, Inc.
- GoCardless Ltd.
- Boku, Inc.
- Bango plc
- Digital Virgo SA
- DIMOCO Payments GmbH
- Vodafone Group plc
- Telefonica, S.A.
- Orange S.A.
- Cleeng B.V.
- Zuora, Inc.
- Aria Systems, Inc.
- SAP SE
- Oracle Corporation

Recent Industry Developments in OTT Payment Solutions Market
- July 2026: Boku completed its first cross-border transactions through India's Unified Payments Interface (UPI), enabling global OTT merchants to accept UPI from Indian consumers via Boku's PA-CB authorized infrastructure; the milestone opens a direct billing channel into India's 600-million-plus OTT user base without requiring local entity setup.
- June 2026: Bango announced a partnership with Turkcell, Turkey's largest telco with 43 million subscribers, to deploy Bango's Digital Vending Machine for streaming super-bundles; the arrangement manages the full subscription lifecycle, onboarding, billing, and account management, under a single carrier-billed invoice, offering subscribers savings of up to 40% versus standalone streaming subscriptions.
- June 2026: GoCardless became the exclusive integrated payment provider for Intelligent Billing, an enterprise billing platform for telecoms operators and managed service providers, enabling automated direct debit and open banking payment collection synchronized with invoice generation.
- January 2026: KDDI, one of Japan's largest telcos with over 70 million subscribers, selected Bango's Digital Vending Machine to power subscription bundles for its povo2.0 pre-paid service, bundling streaming services seamlessly with flexible mobile data plans.


Global OTT Payment Solutions Market Report Scope
OTT Payment Solutions Market refers to the ecosystem of payment technologies and services that enable subscriptions, rentals, pay-per-view, and other transactions on over-the-top streaming platforms. It includes payment gateways, recurring billing engines, wallets, fraud prevention, and checkout orchestration that support monetization across SVOD, TVOD, AVOD hybrid, and FAST-adjacent models.
The OTT Payment Solutions Market Report is Segmented by Payment Method (Credit and Debit Cards, Digital Wallets and E-Money, Direct Debit and Bank Account Debit, Direct Carrier Billing, and Buy Now, Pay Later), Revenue Model (Recurring Subscription Billing (SVOD), Transactional Billing (TVOD/PPV), Advertising-Supported Billing (AVOD/FAST), and Hybrid Monetization Billing), Deployment Mode (Cloud-Based, On-Premise, and Hybrid), Platform Type (Mobile Applications, Smart TV, Streaming Sticks and Set-Top Boxes, and Gaming Consoles), OTT Customer Type (Broadcasters, and Telecom and Pay-TV Operators), and Geography (North America, South America, Europe, Asia-Pacific, Middle East, and Africa). The Market Forecasts are Provided in Terms of Value (USD).
| Credit and Debit Cards |
| Digital Wallets and E-Money |
| Direct Debit and Bank Account Debit |
| Direct Carrier Billing |
| Buy Now, Pay Later |
| Recurring Subscription Billing (SVOD) |
| Transactional Billing (TVOD/PPV) |
| Advertising-Supported Billing (AVOD/FAST) |
| Hybrid Monetization Billing |
| Cloud-Based |
| On-Premise |
| Hybrid |
| Mobile Applications |
| Smart TV |
| Streaming Sticks and Set-Top Boxes |
| Gaming Consoles |
| Broadcasters |
| Telecom and Pay-TV Operators |
| Other OTT Customer Types |
| North America | United States |
| Canada | |
| South America | Brazil |
| Argentina | |
| Rest of South America | |
| Europe | United Kingdom |
| Germany | |
| France | |
| Italy | |
| Spain | |
| Russia | |
| Rest of Europe | |
| Asia-Pacific | China |
| India | |
| Japan | |
| South Korea | |
| Southeast Asia | |
| Rest of Asia-Pacific | |
| Middle East | United Arab Emirates |
| Saudi Arabia | |
| Turkey | |
| Rest of Middle East | |
| Africa | South Africa |
| Nigeria | |
| Egypt | |
| Rest of Africa |
| By Payment Method | Credit and Debit Cards | |
| Digital Wallets and E-Money | ||
| Direct Debit and Bank Account Debit | ||
| Direct Carrier Billing | ||
| Buy Now, Pay Later | ||
| By Revenue Model | Recurring Subscription Billing (SVOD) | |
| Transactional Billing (TVOD/PPV) | ||
| Advertising-Supported Billing (AVOD/FAST) | ||
| Hybrid Monetization Billing | ||
| By Deployment Mode | Cloud-Based | |
| On-Premise | ||
| Hybrid | ||
| By Platform Type | Mobile Applications | |
| Smart TV | ||
| Streaming Sticks and Set-Top Boxes | ||
| Gaming Consoles | ||
| By OTT Customer Type | Broadcasters | |
| Telecom and Pay-TV Operators | ||
| Other OTT Customer Types | ||
| By Geography | North America | United States |
| Canada | ||
| South America | Brazil | |
| Argentina | ||
| Rest of South America | ||
| Europe | United Kingdom | |
| Germany | ||
| France | ||
| Italy | ||
| Spain | ||
| Russia | ||
| Rest of Europe | ||
| Asia-Pacific | China | |
| India | ||
| Japan | ||
| South Korea | ||
| Southeast Asia | ||
| Rest of Asia-Pacific | ||
| Middle East | United Arab Emirates | |
| Saudi Arabia | ||
| Turkey | ||
| Rest of Middle East | ||
| Africa | South Africa | |
| Nigeria | ||
| Egypt | ||
| Rest of Africa | ||


Key Questions Answered in the Report
What is the size of the OTT payment solutions sector?
The OTT payment solutions market size is USD 1.15 billion in 2026 and is forecast to reach USD 1.99 billion by 2031 at an 11.66% CAGR.
Which payment method holds the largest position for OTT services?
Credit and debit cards held 45.44% share in 2025, although digital wallets and e-money are projected to grow faster at a 12.01% CAGR.
Why are digital wallets important for streaming subscriptions?
Wallets can improve access in markets where card use is limited, including Indonesia and the Philippines, and can support local renewal methods.
Which revenue model is growing fastest in OTT payments?
Advertising-supported billing, including AVOD and FAST, is projected to grow at an 11.89% CAGR through 2031.
Which region is expected to grow fastest for OTT payment solutions?
Asia-Pacific is projected to grow at an 11.81% CAGR through 2031, supported by mobile viewing, local wallets, and bank-based payments.
How do telecom bundles affect streaming payments?
Telecom and Pay-TV operators are projected to grow at a 12.06% CAGR as carriers bundle streaming services and collect fees through mobile invoices.
Page last updated on:





