
OTT Customer Intelligence Market Size and Share
Market Overview
| Study Period | 2020 - 2031 |
|---|---|
| Market Size (2026) | USD 5.98 Billion |
| Market Size (2031) | USD 10.60 Billion |
| Growth Rate (2026 - 2031) | 12.13 % |
| Fastest Growing Market | Asia-Pacific |
| Largest Market | North America |
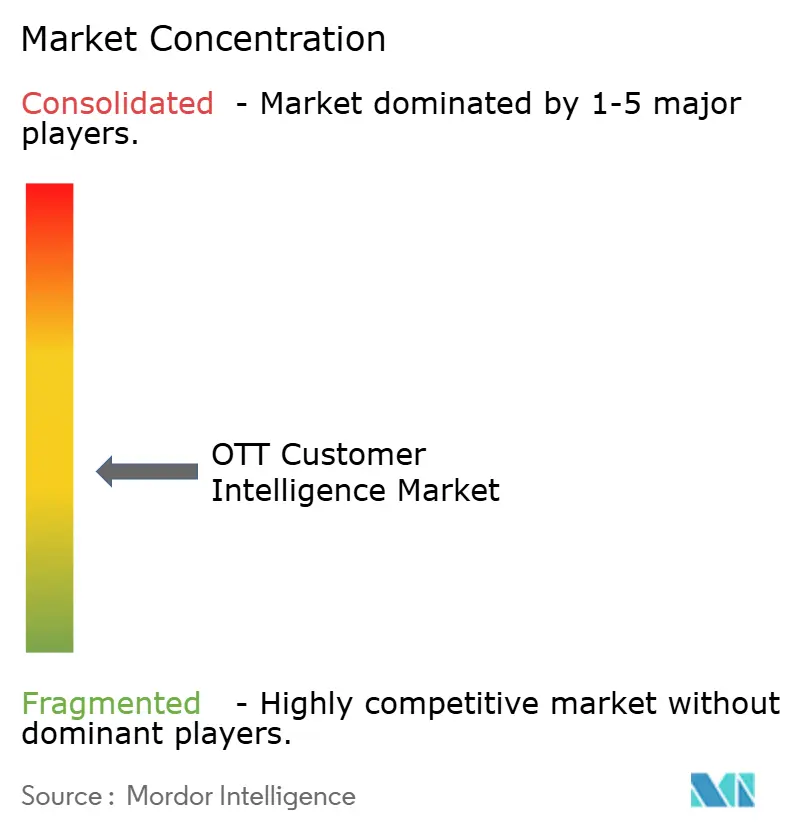
| Market Concentration | Medium |
Major Players *Disclaimer: Major Players sorted in no particular order Image © Mordor Intelligence. Reuse requires attribution under CC BY 4.0. | |
OTT Customer Intelligence Market Analysis by Mordor Intelligence
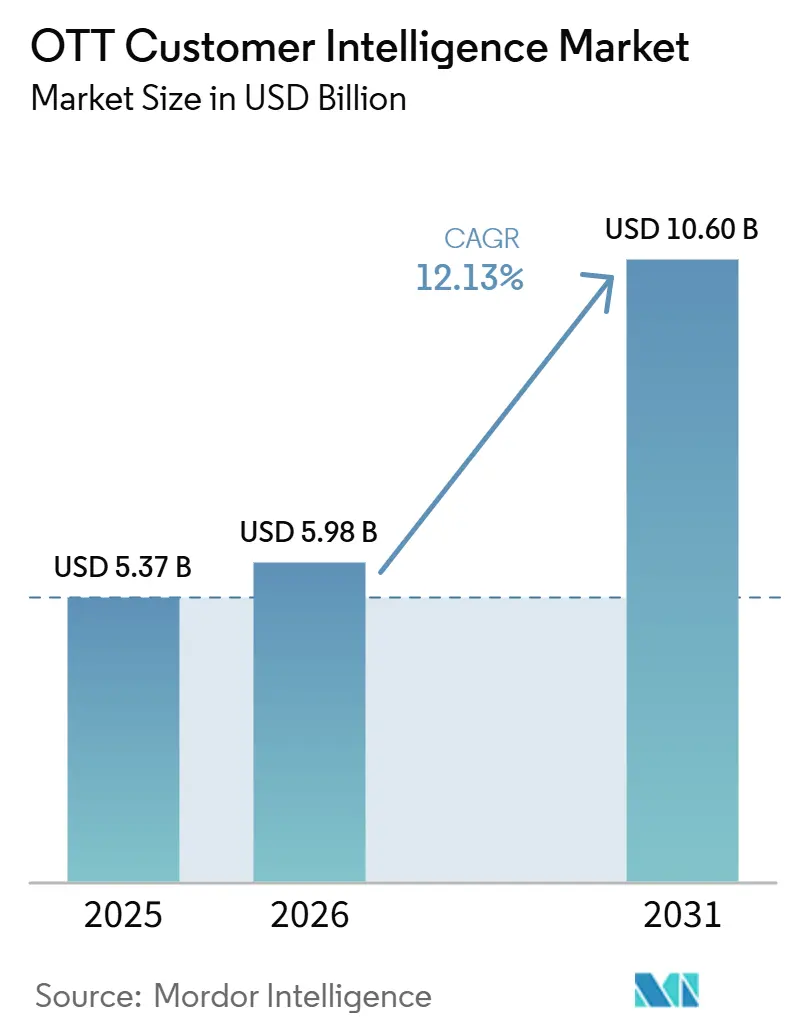
The OTT customer intelligence market size is projected to expand from USD 5.37 billion in 2025 and USD 5.98 billion in 2026 to USD 10.60 billion by 2031, registering a CAGR of 12.13% between 2026 to 2031. The OTT customer intelligence market reflects larger investment in subscriber analytics, real-time decision systems, and advertising audience intelligence by streaming operators. The loss of third-party cookie signals is increasing the value of authenticated first-party data for advertising. FAST services are also creating a larger need for tools that organize audience behavior and support advertising sales. Playback quality has become a commercial issue because buffering, failed starts, and advertising errors can affect retention and advertising outcomes. North America remains the largest regional revenue base, while Asia-Pacific is set for faster expansion as operators manage localized libraries, languages, payment patterns, and data requirements.
Key Report Takeaways
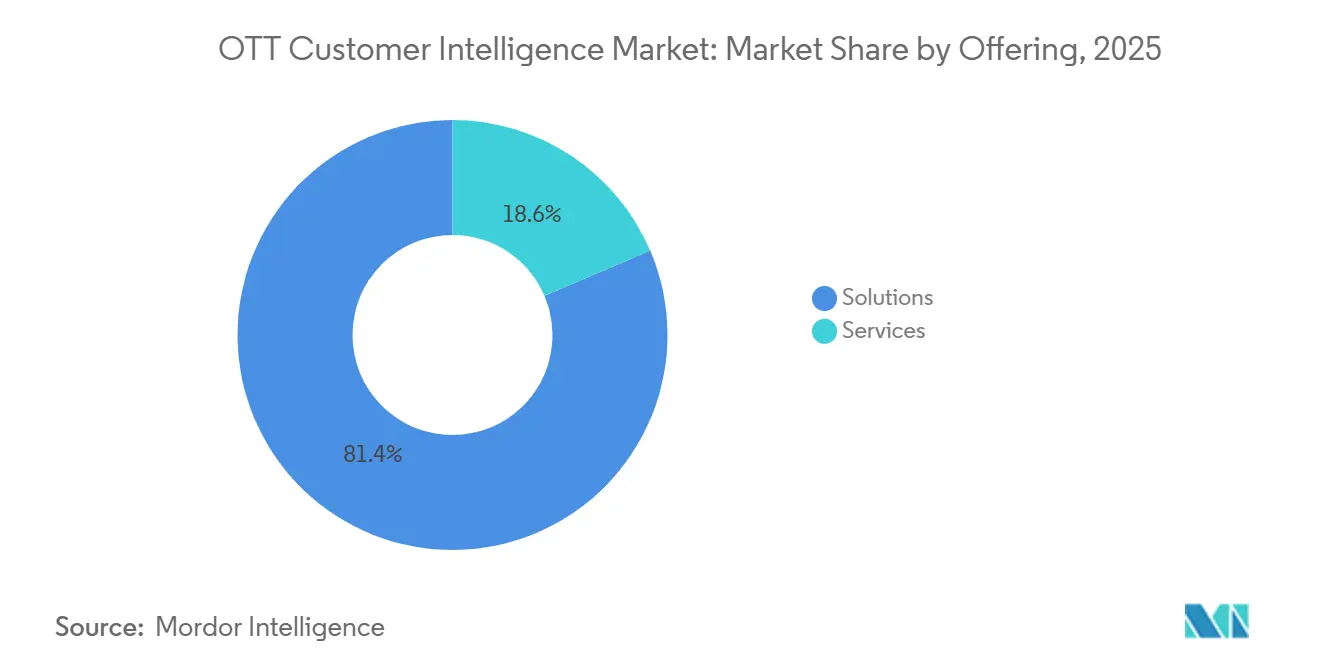
- By offering, software solutions held 81.42% of the OTT customer intelligence market share in 2025, while services are projected to expand at a 13.83% CAGR through 2031.
- By application, engagement, personalization, and content discovery held 25.67% of the OTT customer intelligence market share in 2025, while advertising and audience monetization is projected to expand at a 14.01% CAGR through 2031.
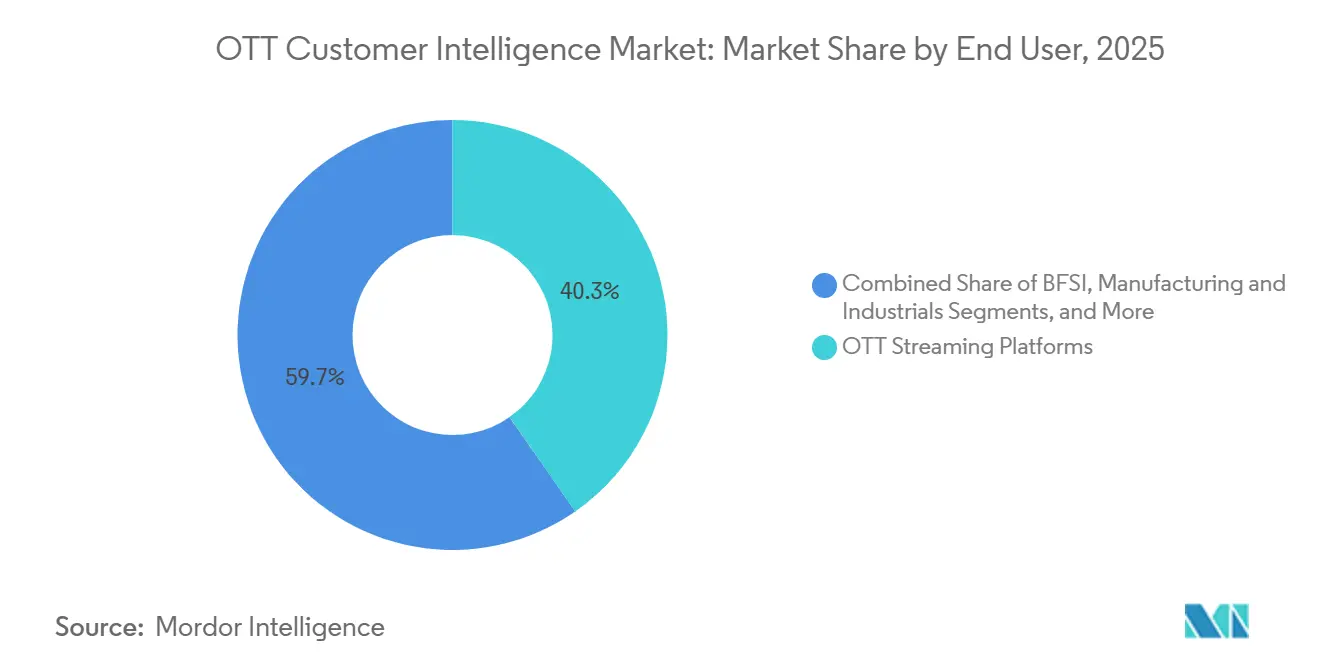
- By end user, OTT streaming platforms held 40.33% of total revenue in 2025, while media and entertainment companies are projected to expand at a 13.68% CAGR through 2031.
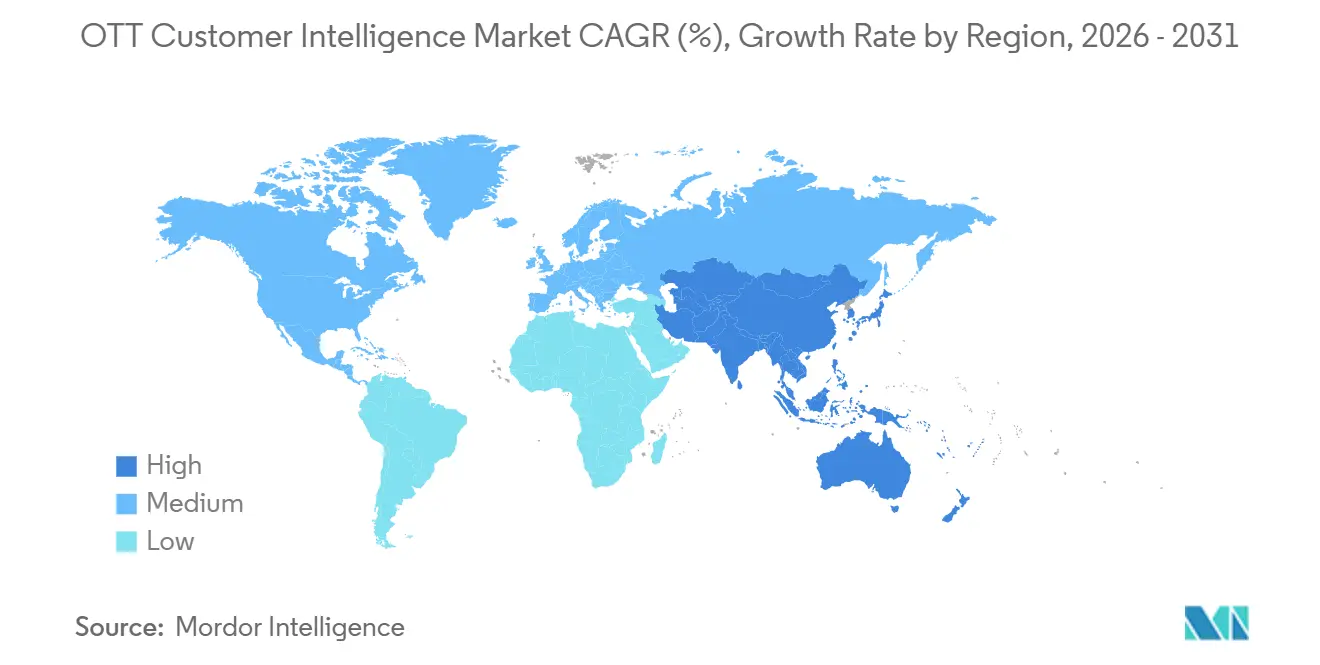
- By geography, North America held 40.82% of 2025 revenue, while Asia-Pacific is projected to expand at a 13.95% CAGR through 2031.
Note: Market size and forecast figures in this report are generated using Mordor Intelligence’s proprietary estimation framework, updated with the latest available data and insights as of January 2026.
Global OTT Customer Intelligence Market Trends and Insights
Drivers Impact Analysis*
| Driver | (~) % Impact on CAGR Forecast | Geographic Relevance | Impact Timeline |
|---|---|---|---|
| Streaming Churn Economics Elevating Predictive Retention Investment | +3.1% | Global, with the highest return concentration in North America and Western Europe | Short term (≤ 2 years) |
| AI-Driven Personalization Expanding Revenue Per Viewer | +2.7% | Global, with the strongest commercial execution in North America and East Asia | Medium term (2-4 years) |
| First-Party Data Activation Under Cookieless Advertising | +2% | North America and Europe, with regulatory-driven demand and scaling in Asia-Pacific | Medium term (2-4 years) |
| Real-Time Experience Telemetry Linking Playback Quality to Revenue | +1.5% | Global, with the highest platform density in North America, the United Kingdom, and South Korea | Short term (≤ 2 years) |
| FAST and Hybrid Monetization Increasing Audience Intelligence Demand | +1% | North America is dominant, while Asia-Pacific and Europe are scaling | Medium term (2-4 years) |
| Localized Content and Payment Complexity Driving Unified Profiles | +0.7% | Asia-Pacific, South America, Middle East, and Africa | Long term (≥ 4 years) |
| Source: Mordor Intelligence | |||
Streaming Churn Economics Elevating Predictive Retention Investment
Subscriber churn has become material enough for streaming services to invest in dedicated customer intelligence systems. These systems can identify lower session frequency, falling completion rates, and narrower device use before a cancellation occurs. A February 2026 peer-reviewed study found that hybrid AI models using behavioral and text data can support churn prediction and targeted retention actions for OTT platforms. The OTT customer intelligence market benefits because operators need repeatable ways to turn those signals into timely offers, messages, or service interventions. Retention data can also improve advertising audience quality, which gives platforms a second return from the same information base. That combination makes the OTT customer intelligence market more relevant to operators seeking lower acquisition pressure and better use of existing subscribers.
AI-Driven Personalization Expanding Revenue Per Viewer
Personalization is moving beyond content recommendations and into broader decisions that affect subscriber value. Streaming services use behavioral signals to guide advertising timing, payment-plan prompts, notification schedules, and content discovery. AWS states that AI-led personalization and engagement optimization can reduce churn by up to 30% for subscription businesses.[1]Amazon Web Services, “AI-Powered Personalization and Engagement Optimization,” Amazon Web Services, aws.amazon.com Brightcove introduced a July 2025 video engagement strategy that included automated metadata, content analysis for advertising, multilingual dubbing, and predictive buffering. Adobe also launched Experience Platform Agent Orchestrator in March 2025 to coordinate AI agents across customer data, content, and journey tools. These actions show why the OTT customer intelligence market is moving toward systems that can execute connected decisions rather than simply report engagement.
First-Party Data Activation Under Cookieless Advertising
The reduction in third-party cookie availability is pushing OTT operators to treat authenticated audience data as a core advertising asset. Login data, purchase history, and viewing behavior can help operators build audience segments without relying on browser-based identifiers. Roku introduced its Data Cloud Collaboration Suite in January 2025 to let advertisers, agencies, and partners use authenticated viewership habits, preferences, and identity signals in a clean-room environment.[2]Roku, “Roku Unveils Data Cloud Collaboration Suite,” Roku, newsroom.roku.com In August 2025, Acxiom, IPG Mediabrands, and IRIS.TV introduced a contextual connected television offering that targets audiences by the genre, context, and emotional tone of viewed content.[3]Acxiom, “IPG Mediabrands, Acxiom and IRIS.TV Launch Contextual CTV Solution,” Acxiom, acxiom.com These approaches help providers in the OTT customer intelligence market use their direct relationship with viewers more effectively. The OTT customer intelligence market therefore gains importance as operators need privacy-aware tools that convert first-party signals into usable advertising decisions.
Real-Time Experience Telemetry Linking Playback Quality to Revenue
Quality-of-experience monitoring is becoming part of revenue management rather than remaining only an operations function. Operators can connect buffering, start failures, and advertising delivery problems with retention risk and advertising commitments. Conviva monitored 26.37 million peak concurrent plays across more than 20 providers during the opening week of the 2026 FIFA World Cup, while its Nexa agent supported automated quality reporting. New Relic introduced a streaming video observability product in February 2025 that brought together experience metrics, application performance, infrastructure telemetry, and ad analytics. MediaMelon also joined Akamai’s Qualified Compute Partner Program to support real-time streaming analytics on distributed delivery infrastructure. The OTT customer intelligence market is responding to a clear need to relate technical service events to customer and advertising outcomes.
Restraints Impact Analysis*
| Restraint | (~) % Impact on CAGR Forecast | Geographic Relevance | Impact Timeline |
|---|---|---|---|
| Consent, Data Sovereignty, and Cross-Border Identity Constraints | -1.7% | Europe, Brazil, India, Canada, and national frameworks across Asia-Pacific | Short term (≤ 2 years) |
| Fragmented Identifiers Across Devices, Households, and Platforms | -1.3% | Global, with greater pressure in North America and Asia-Pacific due to device proliferation | Medium term (2-4 years) |
| High Cost of Low-Latency Data Infrastructure and Cloud Egress | -0.9% | Global, with a larger burden for mid-tier platforms in cost-sensitive emerging markets | Short term (≤ 2 years) |
| Scarcity of Streaming Data Engineering and Model Governance Skills | -0.6% | Global, with the greatest shortage in South America, Africa, and emerging Asia-Pacific markets | Long term (≥ 4 years) |
| Source: Mordor Intelligence | |||
Consent, Data Sovereignty, and Cross-Border Identity Constraints
Data sovereignty rules limit the unified audience architectures used by global streaming operators. The issue is pronounced where consent, behavioral targeting, and data transfers are governed differently across jurisdictions. The General Data Protection Regulation requires clear controls around personal data processing, while local frameworks in Brazil and India add further operational requirements. These rules can reduce the behavioral data available for a global audience model and increase the work required to document consent. Platforms may need to use contextual or cohort-based approaches when individual-level signals cannot be combined across borders. The OTT customer intelligence market must therefore support compliant data design without weakening the usefulness of retention and advertising tools.
Fragmented Identifiers Across Devices, Households, and Platforms
Streaming households often use several connected television devices, mobile devices, and services that do not share a single identity. This makes it harder to connect activity on Roku, Amazon Fire, Samsung, Apple TV, and Google TV to one household or subscriber. The resulting uncertainty affects churn models, personalization, and advertising attribution because a platform may not see the full viewing picture. Identity resolution accuracy can limit how confidently a vendor demonstrates revenue value to an enterprise customer. This constraint can lengthen sales cycles in the OTT customer intelligence market, especially where the buyer needs cross-platform attribution. The need for reliable matching remains a practical barrier to wider use of the OTT customer intelligence market’s data capabilities.
*Our forecasts treat driver/restraint impacts as directional, not additive. The impact forecasts reflect baseline growth, mix effects, and variable interactions.
Segment Analysis
By Offering: Solutions Lead Revenue While Services Gain Strategic Importance
Solutions held 81.42% of the OTT customer intelligence market in 2025. This concentration reflects demand for licensed platforms that can scale across different subscriber base sizes without a matching rise in delivery costs. These platforms bring together customer data integration, unified customer profiles, viewing intelligence, churn analysis, personalization, advertising intelligence, and customer experience functions. A 2025 scholarly study on cloud-based predictive analytics found that integrated media subscription systems can improve customer lifetime value by 30% to 40% through more precise retention interventions.[4]Bethza Eype et al., “Churn Prediction and Customer Retention Strategies for OTT Platforms Using a Hybrid AI Model,” IET Conference Proceedings, doi.org This supports demand for systems that turn fragmented data into actions across the subscriber lifecycle.
Oracle was named a Leader in the 2026 Gartner Magic Quadrant for Customer Data Platforms for its Unity Data Platform, which connects customer data with operational systems, including ERP, sales, and supply chain tools. Services are projected to grow at a 13.83% CAGR through 2031 as operators seek model governance, data engineering support, and implementation help. Conviva reported that its Nexa analytics agent achieved more than 20% week-over-week adoption growth during the 2026 FIFA World Cup. Automated reporting can reduce the manual work that previously required dedicated analytics teams. The OTT customer intelligence industry is therefore likely to retain a strong software base while services become more important for adoption and governance.



By Application: Engagement Leads While Advertising Monetization Grows Faster
Engagement, personalization, and content discovery held 25.67% of total revenue in 2025. This category is central because better content matching can improve loyalty and reduce passive cancellation. Operators use these tools to decide which titles to feature, when to communicate with viewers, and how to adapt recommendations across devices. Customer acquisition, conversion optimization, subscription and payment optimization, and playback support remain distinct application needs. Each requires different data signals, but they increasingly draw on the same customer profile.
Advertising and audience monetization are projected to expand at a 14.01% CAGR through 2031. FAST and hybrid advertising-supported services need behavioral segments based on authenticated first-party data as cookie-based targeting becomes less useful. Churn prevention and win-back systems are also moving from monthly cohort reports to per-subscriber interventions that can refresh daily or weekly. Content and portfolio planning is gaining attention because studios and rights holders need evidence of viewer demand before commissioning or licensing programs, creating an additional use case within the OTT customer intelligence market. NIQ launched Showlabs in Japan in June 2026 to analyze viewing trends across Netflix, Prime Video, Disney+, and Crunchyroll in 7 markets.
By End User: OTT Platforms Lead While Media Companies Expand Use Cases
OTT streaming platforms held 40.33% of total revenue in 2025. Their subscription economics give them a direct reason to improve acquisition, engagement, retention, and advertising performance. These buyers need systems that can combine behavioral data with payment, content, and service-quality signals. Broadcasters are another major buyer group because connected television advertising requires better inventory measurement and pricing. Nielsen introduced its enhanced Big Data and Panel methodology in September 2025 for national television measurement, combining large data sets with panel measurement.
Media and entertainment companies are projected to expand at a 13.68% CAGR through 2031. Studios, independent distributors, and rights holders are using audience data to inform commissioning, distribution windows, and multi-territory licensing choices. Telecom and pay-TV operators use subscriber value intelligence differently because household connectivity data provides added context for retention and bundle design. Twitch expanded its quality-of-user-experience monitoring in June 2025 to include subscriptions, gifting, checkout events, and playback quality. The OTT customer intelligence market is broadening as customer interactions outside viewing become relevant to revenue decisions.
Geography Analysis
North America held 40.82% of the OTT customer intelligence market revenue in 2025. The region has the largest concentration of subscription video services, FAST channels, and connected television advertising systems that require audience intelligence at scale. Streaming accounted for 46.6% of ad-supported television viewing in the first quarter of 2026, supported by events such as the Super Bowl and Olympic programming on Peacock. This setting makes the region an important test case for cross-platform measurement and first-party data activation. Roku’s January 2025 Data Cloud Collaboration Suite added a clean-room option for advertisers and data partners to work with authenticated viewership information.
Europe has a different growth pattern, centered on Germany, the United Kingdom, and France. Zattoo reported that 54% of German households received television through internet-based services in February 2026, compared with 45% in 2025. This shift creates demand for OTT-native intelligence tools among viewers previously measured through cable-based systems. Amagi reported that South American FAST viewing hours grew 190% year over year through June 2026.
Asia-Pacific is projected to grow at a 13.95% CAGR through 2031, the fastest regional rate in the OTT customer intelligence market. India, South Korea, and Japan combine growing OTT audiences with localization needs that put pressure on generic analytics systems. NIQ’s June 2026 Showlabs launch in Japan provides cross-platform viewing analysis across 7 markets, showing demand for tools that reconcile local and global viewing patterns. India’s data protection framework makes local handling of subscriber data an important design issue for global providers. South Africa, Egypt, and Nigeria are early centers of subscriber analytics demand, although bandwidth and infrastructure constraints still limit wider real-time deployment.

Competitive Landscape
The OTT customer intelligence market is moderately fragmented. Large platform vendors, including Adobe, Salesforce, Oracle, Microsoft, and Google, compete for enterprise operators that need customer intelligence across subscriber management, advertising, and content distribution. Their advantage is the ability to integrate customer data platforms, cloud analytics, and AI orchestration with other enterprise systems. Adobe introduced CX Enterprise in April 2026, an agentic system built on Adobe Experience Platform for coordinating personalization, content activation, and commerce. Oracle’s Unity Data Platform is positioned around native links to operational systems such as ERP, sales, and supply chain tools.
Specialist providers include Conviva, MediaMelon, Samba TV, iSpot, Parrot Analytics, TVision Insights, and Xroad Media. These companies compete in the OTT customer intelligence market through proprietary streaming data, measurement capabilities, or quality-of-experience expertise that broad cloud vendors may not provide at the same depth. Conviva’s World Cup deployment showed a related strategy, using agentic reporting to reduce operational work during high-volume live streaming.
The clearest opportunity is the connection between quality-of-experience telemetry and subscriber behavioral data. Few providers currently link a specific playback problem directly to churn risk in a unified data model. A provider that can establish that link can help operators prioritize technical fixes by customer and revenue effect. Competition will also depend on the ability to work within consent rules, local data requirements, and fragmented identity environments. The OTT customer intelligence market rewards vendors that can preserve streaming-specific depth while integrating with the systems buyers already use.
OTT Customer Intelligence Industry Leaders
Conviva Inc.
Adobe Inc.
Nielsen Holdings plc
Amplitude, Inc.
Amazon Web Services, Inc.
- *Disclaimer: Major Players sorted in no particular order

Recent Industry Developments
- July 2026: Amagi released its June 2026 AIRTIME Report covering April 1 to June 15, 2026, documenting 55% year-over-year growth in global FAST viewing hours and 53% growth in ad impressions, with the United States and Canada accounting for 54% of global hours of viewing and 74% of global ad impressions. The report also identified metadata friction as the primary operational barrier to FAST monetization, with 86% of practitioners citing reformatting metadata as their biggest operational drag, directly linking intelligence data quality to advertising revenue performance.
- June 2026: Conviva deployed its Nexa agentic analytics agent across more than 20 streaming providers during the 2026 FIFA World Cup, monitoring 26.37 million peak concurrent plays in real time and recording over 20% week-over-week adoption growth as operations teams replaced manual reporting workflows with natural-language AI analytics. Broadcasters used Nexa to auto-generate executive QoE reports with country and platform breakdowns, demonstrating that agentic analytics can replace multi-day analyst workflows at international broadcast scale.
- June 2026: NIQ launched Showlabs in Japan, a cross-platform video viewing analytics solution developed by Plum Research S.A., an Ampere Analysis company, covering Netflix, Prime Video, Disney+, and Crunchyroll across 7 markets including Japan, the United States, France, Brazil, South Korea, Taiwan, and India. The product enables Japanese content companies to evaluate cross-market audience behavior for overseas expansion and programming strategy without building proprietary global measurement infrastructure.
- April 2026: Adobe unveiled CX Enterprise at Adobe Summit, an end-to-end agentic AI system built on Adobe Experience Platform, architected on open standards including Model Context Protocol and Agent2Agent frameworks, supporting over 20,000 global enterprise customers. The system is designed to orchestrate audience intelligence across personalization, content activation, and commerce in a single AI-driven operational layer.


Global OTT Customer Intelligence Market Report Scope
OTT Customer Intelligence Market refers to the ecosystem of analytics, data platforms, and insight tools used by OTT providers to understand subscriber behavior, preferences, and engagement patterns. It combines customer data from viewing activity, search behavior, churn signals, and content interaction to improve retention, personalization, and monetization.
The OTT Customer Intelligence Market Report is Segmented by Offering (Solutions, Services), Application (Customer Acquisition and Conversion Optimization, Engagement, Personalization, and Content Discovery, Churn Prevention, Retention, and Win-Back, Subscription, Payment, and Customer Value Optimization, Advertising and Audience Monetization, Product, Playback, and Customer-Care Optimization, and Customer-Driven Content and Portfolio Planning), End User (OTT Streaming Platforms, Broadcasters, Telecom Operators, and Media and Entertainment), and Geography (North America, South America, Europe, Asia-Pacific, Middle East, Africa). The Market Forecasts are Provided in Terms of Value (USD).
| Solutions | Customer Data Integration and Unified Customer Profiles |
| Audience, Viewing, and Engagement Intelligence | |
| Subscriber, Churn, and Customer Value Intelligence | |
| Personalization, Content Discovery, and Decision Intelligence | |
| Advertising and Audience Monetization Intelligence | |
| Customer Experience, Product, and Service Intelligence | |
| Services |
| Customer Acquisition and Conversion Optimization |
| Engagement, Personalization, and Content Discovery |
| Churn Prevention, Retention, and Win-Back |
| Subscription, Payment, and Customer Value Optimization |
| Advertising and Audience Monetization |
| Product, Playback, and Customer-Care Optimization |
| Customer-Driven Content and Portfolio Planning |
| OTT Streaming Platforms |
| Broadcasters |
| Telecom and Pay-TV Operators |
| Media and Entertainment Companies |
| Other End Users |
| North America | United States |
| Canada | |
| Mexico | |
| South America | Brazil |
| Argentina | |
| Rest of South America | |
| Europe | United Kingdom |
| Germany | |
| France | |
| Italy | |
| Spain | |
| Russia | |
| Rest of Europe | |
| Asia-Pacific | China |
| Japan | |
| India | |
| South Korea | |
| Australia and New Zealand | |
| Rest of Asia-Pacific | |
| Middle East | Saudi Arabia |
| United Arab Emirates | |
| Turkey | |
| Rest of Middle East | |
| Africa | South Africa |
| Nigeria | |
| Egypt | |
| Rest of Africa |
| By Offering | Solutions | Customer Data Integration and Unified Customer Profiles |
| Audience, Viewing, and Engagement Intelligence | ||
| Subscriber, Churn, and Customer Value Intelligence | ||
| Personalization, Content Discovery, and Decision Intelligence | ||
| Advertising and Audience Monetization Intelligence | ||
| Customer Experience, Product, and Service Intelligence | ||
| Services | ||
| By Application | Customer Acquisition and Conversion Optimization | |
| Engagement, Personalization, and Content Discovery | ||
| Churn Prevention, Retention, and Win-Back | ||
| Subscription, Payment, and Customer Value Optimization | ||
| Advertising and Audience Monetization | ||
| Product, Playback, and Customer-Care Optimization | ||
| Customer-Driven Content and Portfolio Planning | ||
| By End User | OTT Streaming Platforms | |
| Broadcasters | ||
| Telecom and Pay-TV Operators | ||
| Media and Entertainment Companies | ||
| Other End Users | ||
| By Geography | North America | United States |
| Canada | ||
| Mexico | ||
| South America | Brazil | |
| Argentina | ||
| Rest of South America | ||
| Europe | United Kingdom | |
| Germany | ||
| France | ||
| Italy | ||
| Spain | ||
| Russia | ||
| Rest of Europe | ||
| Asia-Pacific | China | |
| Japan | ||
| India | ||
| South Korea | ||
| Australia and New Zealand | ||
| Rest of Asia-Pacific | ||
| Middle East | Saudi Arabia | |
| United Arab Emirates | ||
| Turkey | ||
| Rest of Middle East | ||
| Africa | South Africa | |
| Nigeria | ||
| Egypt | ||
| Rest of Africa | ||


Key Questions Answered in the Report
What is the OTT customer intelligence market size?
The OTT customer intelligence market size is projected to increase from USD 5.98 billion in 2026 to USD 10.60 billion by 2031 at a 12.13% CAGR.
What is driving demand for OTT customer intelligence platforms?
Demand is supported by churn reduction needs, AI-enabled personalization, first-party advertising data, and the need to connect playback quality with commercial outcomes.
Which offering leads OTT customer intelligence spending?
Solutions led with 81.42% of revenue in 2025 because operators need scalable platforms for customer data, viewing behavior, churn, personalization, advertising, and experience management.
Which application is expected to grow fastest through 2031?
Advertising and audience monetization is projected to grow at a 14.01% CAGR as FAST and hybrid services build first-party audience segments for advertising.
Which end users are the largest buyers of customer intelligence tools?
OTT streaming platforms led with 40.33% of revenue in 2025, while broadcasters, telecom operators, media companies, and hybrid digital platforms also use these tools.
Which region is expected to grow fastest in OTT customer intelligence?
Asia-Pacific is projected to grow at a 13.95% CAGR through 2031 because expanding OTT services need localized analytics across different content libraries, languages, payment methods, and data requirements.
Page last updated on:





