
OTT Aggregator Market Size and Share
Market Overview
| Study Period | 2020 - 2031 |
|---|---|
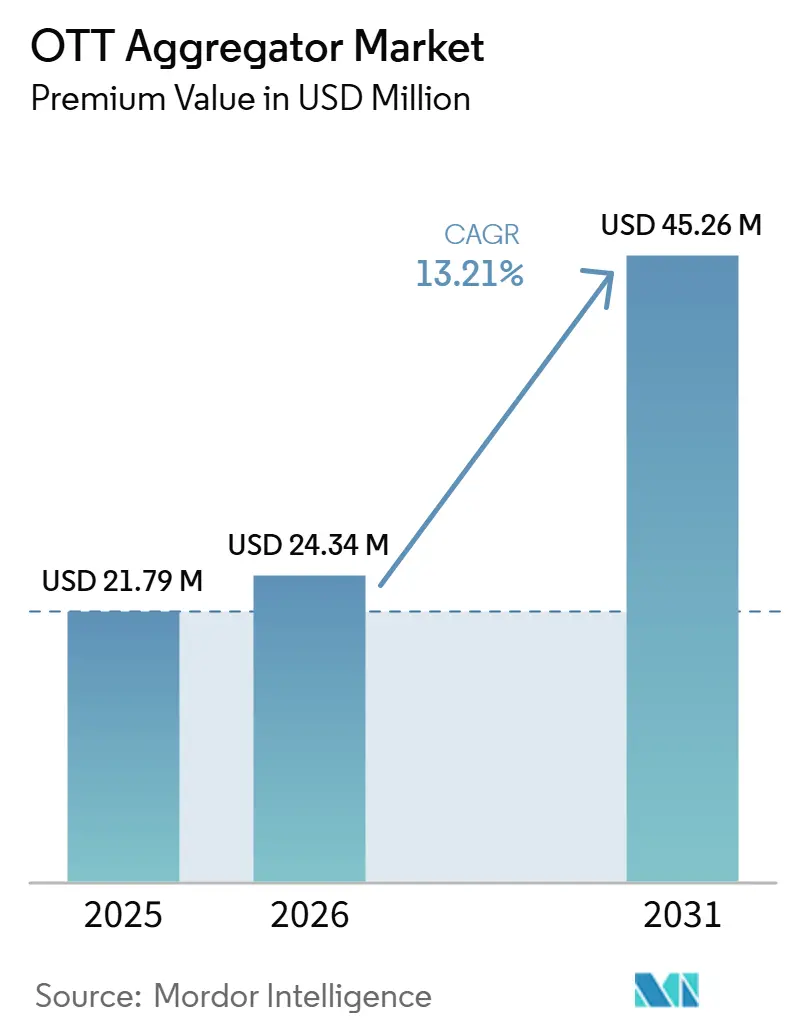
| Market Size (2026) | USD 24.34 Million |
| Market Size (2031) | USD 45.26 Million |
| Growth Rate (2026 - 2031) | 13.21 % |
| Fastest Growing Market | Asia-Pacific |
| Largest Market | North America |
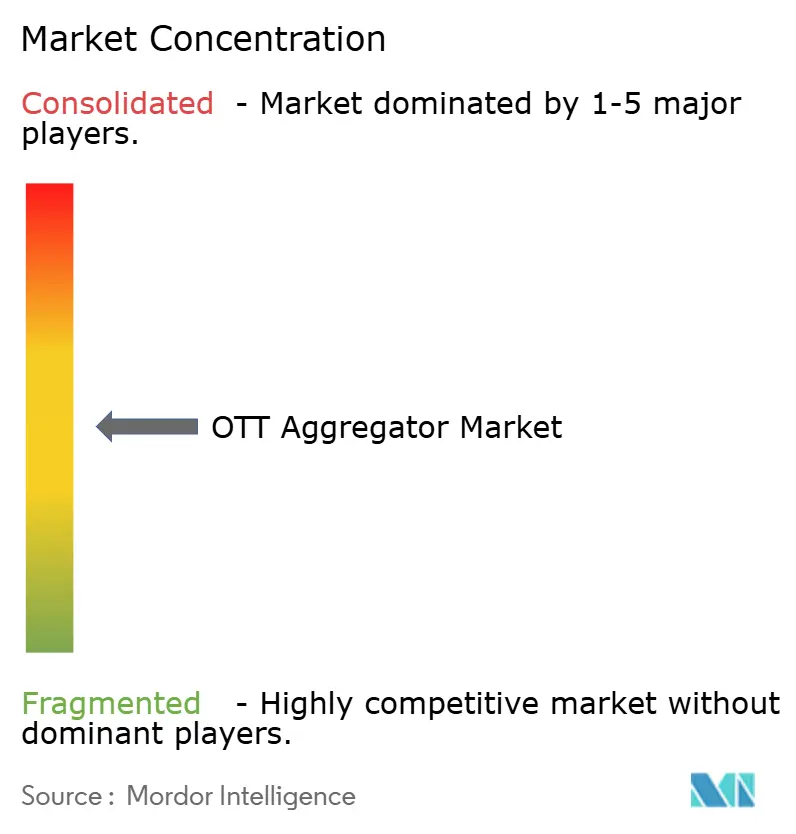
| Market Concentration | Medium |
Major Players *Disclaimer: Major Players sorted in no particular order Image © Mordor Intelligence. Reuse requires attribution under CC BY 4.0. | |
OTT Aggregator Market Analysis by Mordor Intelligence
USD 24.34 million in 2026 to USD 45.26 million by 2031, registering a CAGR of 13.21% between 2026 and 2031. The OTT aggregator market is gaining momentum as viewers increasingly prefer a single interface for billing, search, and service management, rather than managing multiple standalone subscriptions. The OTT aggregator market is also being shaped by stronger competition among connected TV operating systems, telecom operators, and white-label platform providers, all of which want to control the customer relationship. The OTT aggregator market is moving beyond simple bundling, as metadata quality, recommendation depth, and entitlement management now influence which platforms can keep users engaged for longer. The OTT aggregator market is creating space for branded aggregation offers from telecom and broadband providers looking to use streaming bundles to support subscriber retention and lower acquisition costs. The OTT aggregator market still faces pressure from rights fragmentation, platform fee disputes, and privacy rules that can slow content onboarding and limit the value of cross-service viewing data.
Key Report Takeaways
- By service type, unified content aggregators led with 43.12% share of the OTT aggregator market in 2025, while white-label OTT aggregation platforms are projected to expand at a 14.84% CAGR through 2031.
- By revenue model, the subscription-based segment held 58.71% share in 2025, while the hybrid model is expected to expand at a 17.31% CAGR through 2031.
- By device type, smartphones and tablets held 51.34% of the OTT aggregator market share in 2025, while smart TVs are projected to expand at a 15.73% CAGR through 2031.
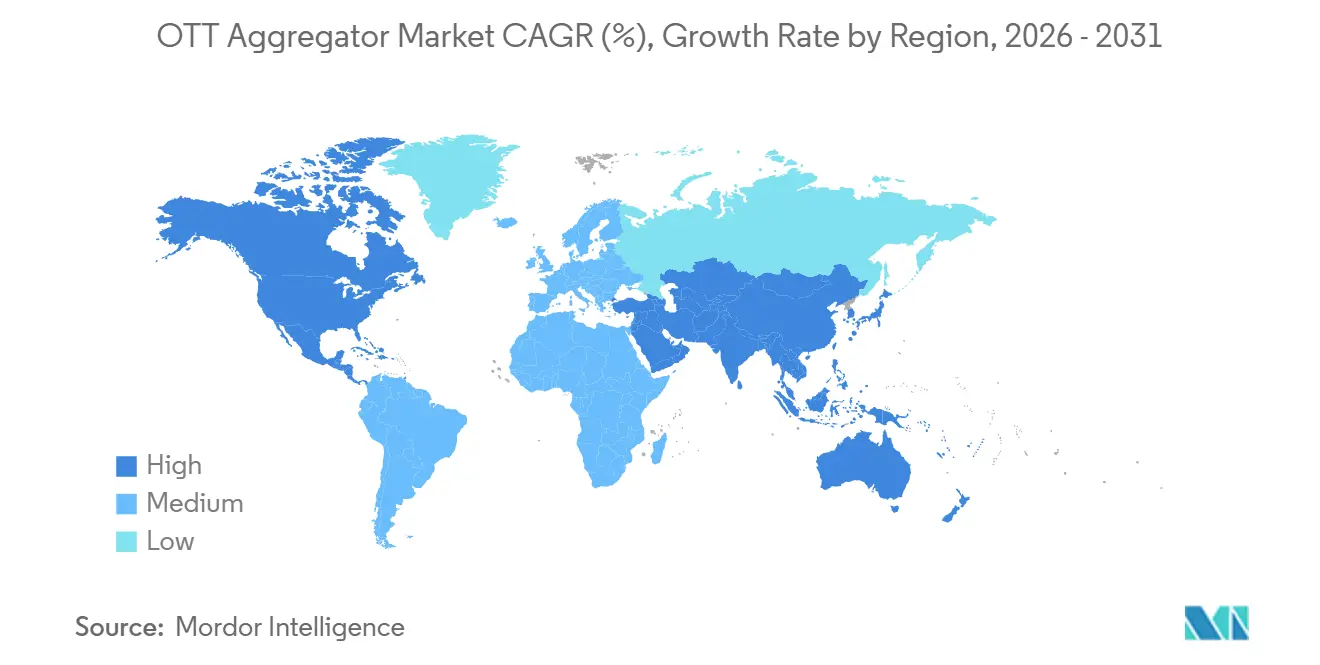
- By geography, North America held 36.19% of the over-the-top (OTT) aggregator market in 2025, while Asia-Pacific is projected to expand at a 17.42% CAGR through 2031.
Note: Market size and forecast figures in this report are generated using Mordor Intelligence’s proprietary estimation framework, updated with the latest available data and insights as of January 2026.
Market Trends and Insights
Drivers Impact Analysis of OTT Aggregator Market*
| Driver | (~) % Impact on CAGR Forecast | Geographic Relevance | Impact Timeline |
|---|---|---|---|
| Subscription Fatigue Accelerating Aggregator Adoption | +3.5% | Global, with peak intensity in North America and Western Europe | Short term (≤ 2 years) |
| Unified Billing and Cross-App Search Reducing Churn | +2.8% | North America and Europe, with growing traction in Asia-Pacific | Medium term (2-4 years) |
| Smart TV Home Screens Becoming the Default Discovery Layer | +2.6% | Global, led by North America, South Korea, and Germany | Medium term (2-4 years) |
| Telco and Broadband Bundles Lowering Customer Acquisition Costs | +2.4% | Asia-Pacific core, North America, and Western Europe | Medium term (2-4 years) |
| Metadata Normalization Making Cross-Platform Recommendation Engines Viable | +1.6% | Global | Long term (≥ 4 years) |
| Ad-Supported Aggregation Expanding Reach Beyond Premium Viewers | +1.2% | North America, with spillover to Asia-Pacific and Middle East and Africa | Short term (≤ 2 years) |
| Source: Mordor Intelligence | |||
Subscription Fatigue is Accelerating Aggregator Adoption
The OTT aggregator market is benefiting from the steady rise in the number of standalone streaming services that households must manage across separate apps and payment cycles. As subscription stacks become more crowded, viewers are increasingly interested in a single access point that reduces friction in discovery and account management. This makes aggregation more than a convenience feature, as it helps consumers keep their desired content while simplifying ongoing service choices. It also strengthens the role of the intermediary, since platforms that remove complexity can gain influence over search behavior, payment flows, and recommendation visibility. The over-the-top (OTT) aggregator market, therefore, benefits from a feedback loop in which more fragmented viewing choices increase the appeal of unified access. That dynamic is helping aggregators move closer to the center of the streaming distribution chain.
Unified Billing and Cross-App Search Reduce Churn
Unified billing changes the way households manage subscriptions by reducing the effort required to review, renew, and use multiple streaming services under a single account. Cross-app search adds another advantage; users can search for a title once instead of repeating the same task across several apps. This reduces discovery friction, which is important in the OTT aggregator market because user frustration often leads to lower engagement and faster cancellation. The benefit becomes stronger when the same interface also keeps subscription details visible and easier to manage across billing cycles. The European Commission's consultation on a forthcoming Digital Fairness Act showed that cancellation transparency and subscription clarity are becoming more important policy themes across digital services.[1]European Commission, “Commission Launches Open Consultation on Forthcoming Digital Fairness Act,” European Commission, digital-strategy.ec.europa.eu As these expectations become more formal, the OTT aggregator market is likely to favor platforms that can combine simpler billing with clearer subscription management tools.
Smart TV Home Screens are Becoming the Default Discovery Layer
The OTT aggregator market is increasingly influenced by smart TV operating systems because the home screen now shapes how viewers discover content before they open any individual app. When the default interface highlights titles, services, or bundles, the platform gains more control over viewing pathways and commercial placement. Roku's May 2026 redesign showed how far this shift has progressed, with a personalized interface rolled out across its connected TV base and built to surface content directly from the home screen. That matters for the OTT aggregator market because discovery power is moving from the content library toward the operating layer that organizes access. Smaller aggregators can still compete when their metadata quality and integration depth improve recommendation accuracy across services. Even so, home screen placement is becoming a stronger gatekeeper for who gets visibility, engagement, and billing leverage in the OTT aggregator market.
Telco and Broadband Bundles Lower Customer Acquisition Costs
Telecom operators already control billing relationships, network access, and device touchpoints, which gives them a built-in advantage in the OTT aggregator market. Bharti Airtel's May 2025 prepaid entertainment pack bundled access to 25+ streaming platforms for INR 279 (USD 3.32) per month, against a declared standalone value of over INR 750 (USD 8.6). Jio Platforms followed in May 2026 with Jio OTT Pass 5G, which bundled 15 streaming applications, 1,000+ live television channels, and unlimited 5G access for INR 200 (USD 2.39) per 28-day period. In Europe, Deutsche Telekom's MagentaTV passed 3.5 million subscribers in early 2026, showing that operator-led aggregation also works in higher-value broadband markets. These moves support the OTT aggregator market because telco bundling can lower subscriber acquisition costs, deepen retention, and bring streaming access into broader connectivity contracts. The OTT aggregator market is therefore seeing telecom distribution evolve into a durable access channel rather than a simple promotional add-on.
Restraints Impact Analysis of OTT Aggregator Market*
| Restraint | (~) % Impact on CAGR Forecast | Geographic Relevance | Impact Timeline |
|---|---|---|---|
| Platform Fee Disputes Delaying Content Onboarding | -1.3% | Global, most acute in North America | Short term (≤ 2 years) |
| Rights and Entitlement Fragmentation Limiting Catalog Depth | -0.9% | Global, amplified in multi-territory markets | Long term (≥ 4 years) |
| Privacy Constraints Restricting Cross-Service Viewing Data Monetization | -0.5% | Europe and Asia-Pacific, with spillover to North America | Medium term (2-4 years) |
| Cord-Cutting Slowing in Price-Sensitive Markets With Low Bundle Spend | -0.4% | South America and Middle East and Africa | Medium term (2-4 years) |
| Source: Mordor Intelligence | |||
Platform Fee Disputes Can Delay Content Onboarding
The OTT aggregator market relies on cooperation between distributors and content services, so commercial disputes can directly slow platform growth. When subscription revenue shares or placement terms become contentious, the result is often a delay in onboarding or a weaker integration model. That weakens the core value of aggregation, because viewers expect a broad catalog and a smooth billing experience within a single interface. If a major service remains outside the bundle, users must still manage part of their viewing separately, which reduces platform stickiness. The OTT aggregator market is especially exposed to this issue when new aggregation layers try to scale quickly but cannot secure acceptable economics with premium content partners. Over time, repeated onboarding delays can push users toward larger ecosystems that already have stronger negotiating power and deeper service coverage.
Rights and Entitlement Fragmentation Limits Catalog Depth
The OTT aggregator market also faces a structural limitation, fragmented content rights that vary by territory, service tier, window, and device type. Even when an aggregator has commercial relationships with multiple platforms, it may still lack the rights to present every title through one consistent interface. This complicates entitlement management because the platform must match what a user can watch with where, when, and on which device that access is valid. The problem becomes more difficult in multi-country deployments, where different rights holders and licensing terms apply across borders. Smaller providers in the OTT aggregator market can find this especially burdensome because they need scalable compliance and catalog-control systems without the same capital base as large operating systems or telecom players. As a result, rights fragmentation continues to limit the extent to which seamless and complete aggregation can occur in practice.
*Our forecasts treat driver/restraint impacts as directional, not additive. The impact forecasts reflect baseline growth, mix effects, and variable interactions.
OTT Aggregator Market Segment Analysis
By Service Type:
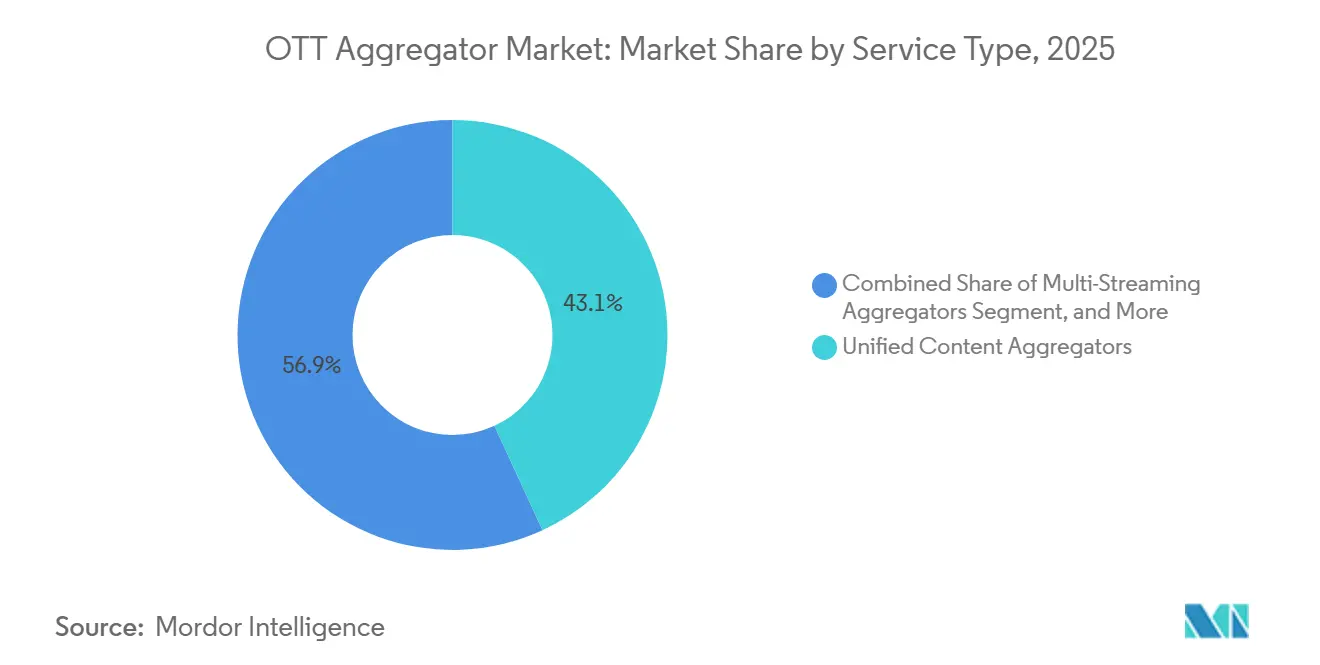
Unified Platforms Mature As White-Label Infrastructure ScalesUnified content aggregators held 43.12% share of the OTT aggregator market size in 2025, while white-label OTT aggregation platforms are projected to expand at a 14.84% CAGR through 2031. The larger position of unified content aggregators reflects the maturity of consumer-facing services that bring billing, search, and recommendations into one visible interface. In the OTT aggregator market, that model fits users who want a direct front-end experience rather than a background infrastructure layer. It also supports stronger consumer recognition because the platform brand stays in front of viewers throughout account management and discovery. Multi-streaming aggregators still matter because they can be deployed quickly and often focus on links, search, and watchlist functions without taking on full billing responsibility.
White-label platforms are gaining speed because telecom operators and broadcasters often prefer to keep the customer relationship under their own brand. Tata Play Binge's white-label offer showed this appeal by promoting the deployment of 30+ OTT apps within a client-branded interface in 4 to 6 months.[2]Tata Play Limited, “Tata Play Binge Whitelabel,” Tata Play Limited, tataplay.com That approach gives regional service providers a faster entry point into the OTT aggregator market without requiring them to build a full proprietary stack. Enterprise video management platforms remain a smaller segment, but they address controlled use cases in education and corporate environments where governance and licensed access matter more than mass discovery. The service mix in the OTT aggregator market is therefore broadening, with consumer aggregation and B2B infrastructure scaling at the same time.



By Revenue Model:
Hybrid Models Capture Price-Stratified AudiencesThe subscription-based model held 58.71% share in 2025, while the hybrid model is projected to expand at a 17.31% CAGR through 2031. This pattern shows that the OTT aggregator market still depends heavily on subscription revenue, especially in regions where households already accept multi-service streaming spend. At the same time, hybrid offers are expanding because they let platforms combine premium paid access with lower-cost or ad-supported entry points. That helps aggregators serve users across different spending levels without giving up monetization flexibility. It also makes the pricing architecture more resilient because the same platform can monetize both high-value subscribers and broader, ad-reached audiences.
Advertising-based models strengthen reach in the over-the-top (OTT) aggregator market, but monetization depends on demand quality, consent management, and platform-level audience data. Transaction-based access still has a role because new releases and premium titles can sit outside standard subscription tiers and serve as in-platform upsells. Unified billing supports that structure because users can add one-off purchases without leaving the broader aggregation environment. In practical terms, the OTT aggregator market is moving toward a mix of monetization models rather than a single dominant commercial model. That keeps hybrid models well-positioned as platforms try to balance scale, affordability, and revenue depth across changing viewer habits.
By Device Type:
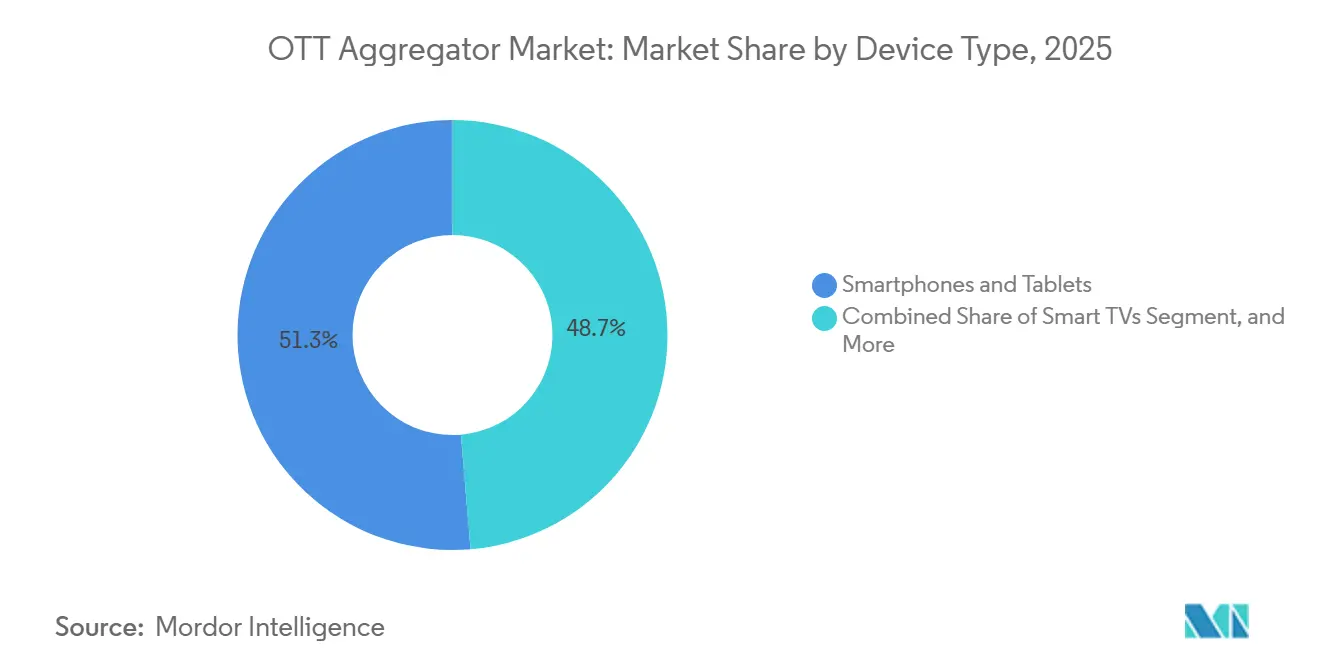
Smart TV Ecosystems Reshape Aggregation HierarchySmartphones and tablets held 51.34% of the OTT aggregator market share in 2025, while smart TVs are projected to expand at a 15.73% CAGR through 2031. Mobile devices kept the lead because they remain the most accessible streaming screen across many households in the Asia-Pacific and South America. In the OTT aggregator market, mobile-first behavior still matters because lower-cost data plans and high smartphone penetration widen the addressable user base. Even so, smart TVs are becoming more influential because household subscription management increasingly begins on the living room screen. That shift changes competition because the device interface itself can shape what users discover, subscribe to, and watch.
Roku's 2026 home screen overhaul highlighted how connected TV operating systems are becoming central distribution points for aggregated streaming discovery.[3]Roku, “Roku Unveils New TV Home Screen for the Next Era of Streaming,” Roku Newsroom, newsroom.roku.com In the OTT aggregator market, this strengthens the role of operating system owners that can control placement, linking depth, and recommendation visibility across services. Laptops and desktops remain relevant in enterprise video management, where browser access and managed permissions still fit institutional workflows. Other device categories, including streaming sticks and set-top boxes, are losing relative importance as smart TVs absorb more of their core functions. Device strategy now matters more in the OTT aggregator market because the winning screen increasingly determines who owns discovery, billing influence, and user attention.
Geography Analysis
North America OTT Aggregator Market
North America accounted for 36.19% of the OTT aggregator market in 2025, making it the largest regional base for aggregation services. The region benefits from a dense streaming ecosystem, high broadband penetration, and consumers who already manage multiple digital subscriptions. In June 2025, Amazon Ads and Roku announced a partnership that combined an estimated 80 million authenticated connected TV households, representing over 80% of all US connected TV households, via Amazon's demand-side platform.[4]Roku, “Amazon Ads and Roku Announce Partnership Creating the Largest Authenticated CTV Footprint in the U.S.,” Roku Newsroom, newsroom.roku.com That move showed how the OTT aggregator market in North America is expanding beyond subscription access into a broader advertising and audience-matching layer. Canada and Mexico are following different paths, with Canada closer to bundled IPTV economics and Mexico more focused on value-led packaging.
APAC OTT Aggregator Market
Asia-Pacific is projected to expand at a 17.42% CAGR through 2031, making it the fastest-growing regional market for OTT aggregators. AVIA reported that Asia-Pacific screen revenues are expected to reach USD 196 billion by 2030, with all net growth coming from online video that is projected to expand at a 7% CAGR. India has become the clearest battleground because Jio Platforms and Bharti Airtel are using mobile and broadband relationships to push bundle depth and price access at scale. That creates a strong structural advantage in the OTT aggregator market, as telecom operators can combine streaming access with network services into a single consumer offer. South Korea and Japan also support the region's momentum because dense local streaming ecosystems increase the value of better cross-service discovery and navigation.
EMEA and South America OTT Aggregator Market
Europe remains a significant but regulation-heavy part of the over-the-top (OTT) aggregator market, and Deutsche Telekom's MagentaTV passed 3.5 million subscribers in early 2026, aggregating Netflix, Disney+, Apple TV+, and DAZN through a single operator-led interface. Deutsche Telekom and ProSiebenSat. 1 expanded that model further in February 2026 through a new five-year cooperation that added ProSiebenSat. 1 content, Joyn, and Joyn PLUS+ to the MagentaTV catalog and extended addressable TV advertising collaboration. The European Commission's Digital Omnibus proposal added another layer of relevance by simplifying some data rules while tightening obligations tied to AI-based profiling and cross-service audience handling. South America, the Middle East, and Africa remain growth markets for OTT aggregators, but lower purchasing power, uneven broadband coverage, and stronger preference for mobile-first or value-oriented offers make regional models more price-sensitive than those in North America and Western Europe.

Competitive Landscape
The OTT aggregator market remains moderately fragmented at the interface level, but it is becoming more concentrated around the infrastructure layers that control discovery and access. Roku OS, Amazon Fire OS, Google TV, and Samsung Tizen sit close to the viewer and therefore shape how services appear, how bundles are presented, and how recommendations are surfaced. That gives operating system owners a structural advantage in the OTT aggregator market because they can influence both content visibility and commercial terms. At the same time, telecom-led aggregators are using broadband and mobile contracts to lock streaming offers into wider household relationships. Smaller search-led platforms, including JustWatch, Reelgood, and Plex, still hold a place, but their scale is more constrained when billing integration matters more than discovery precision alone.
Several strategic moves have made the competition clearer in the OTT aggregator market. Roku rolled out a major home screen redesign in May 2026 to make personalized content discovery more central to the default TV interface. Jio Platforms launched Jio OTT Pass 5G in May 2026, which pushed aggregation directly into mobile data plans and widened its role as a distribution gateway. Bharti Airtel had already done something similar in May 2025 with its all-in-one prepaid entertainment pack, which offers access to 25+ streaming platforms. Deutsche Telekom and ProSiebenSat. 1 then expanded MagentaTV's content and advertising relationship in February 2026, showing that the OTT aggregator market is also becoming a platform for broader monetization partnerships.
Competition is also shifting toward first-party identity, consent-ready audience data, and metadata quality because these capabilities determine how well a platform can unify discovery across services. In the OTT aggregator market, providers with direct device or connectivity relationships are better placed to manage identity in regulated environments. White-label vendors still have significant room to grow, as regional operators seek branded offers without the time and expense of developing a full in-house platform. Enterprise video management also remains a useful niche where rights control and governed access can matter more than mass consumer scale. The wider result is a market in which operating systems, telecoms, and infrastructure providers compete to own the layer between content supply and viewer attention.
OTT Aggregator Industry Leaders
Roku, Inc.
Amazon.com, Inc.
Google LLC
Apple Inc.
Samsung Electronics Co., Ltd.
- *Disclaimer: Major Players sorted in no particular order
OTT Aggregator Market Companies Covered in this Report
- Roku, Inc.
- Amazon.com, Inc.
- Alphabet Inc.
- Apple Inc.
- Comcast Corporation
- Paramount, a Skydance Corporation
- Samsung Electronics Co., Ltd.
- LG Electronics Inc.
- Tata Play Limited
- Bharti Airtel Limited
- Jio Platforms Limited
- JustWatch GmbH
- Plex, Inc.
- Reelgood, Inc.
- Deutsche Telekom AG
- Orange S.A.
- Charter Communications, Inc.
- Verizon Communications, Inc.
- Zattoo AG
- Xperi Inc.

Recent Industry Developments in OTT Aggregator Market
- May 2026: Roku, Inc. unveiled a major home screen redesign, its most significant update in over a decade, deploying an AI-powered personalized interface across all Roku TVs and streaming devices in the US, with international rollout planned for subsequent months. The new interface, built on behavioral intelligence models offering billions of possible configurations, surfaced personalized content across all subscribed services without requiring users to navigate individual apps, directly competing with unified aggregator interfaces.
- May 2026: Jio Platforms Limited launched the Jio OTT Pass 5G, bundling 15 streaming applications, including JioHotstar, Prime Video Mobile Edition, and YouTube Premium, with 30 GB of high-speed data and unlimited 5G access for INR 200 (USD 2.39) per 28-day period, targeting India's expanding 5G subscriber base with a full-stack aggregation offering under a single mobile data add-on.
- February 2026: Deutsche Telekom AG and ProSiebenSat.1 Media SE signed a new five-year expanded distribution and technology cooperation agreement, adding full ProSiebenSat.1 content, Joyn, and Joyn PLUS+ to the MagentaTV aggregated catalog and extending the addressable TV advertising collaboration between the two companies.
- January 2026: JioHotstar introduced monthly subscription plans across all pricing tiers, effective January 28, 2026, enhancing accessibility for Indian consumers and supporting customized large-screen viewing configurations across urban and Tier 2 markets.


Global OTT Aggregator Market Report Scope
The OTT Aggregator Market comprises platforms and services that consolidate content from multiple over-the-top (OTT) streaming providers into a unified interface, enabling users to discover, access, manage, and consume video content across various streaming services through a single application. OTT aggregators enhance the user experience by offering features such as unified search, personalized recommendations, single sign-on, integrated billing, content discovery, and cross-platform content management while reducing the complexity of managing multiple streaming subscriptions.
The OTT Aggregator Market Report is segmented by Service Type (Multi-Streaming Aggregators, Unified Content Aggregators, White-Label OTT Aggregation Platforms, and Enterprise Video Management Platforms), Revenue Model (Subscription-Based (SVOD), Advertising-Based (AVOD), Transaction-Based (TVOD), and Hybrid (Subscription + Advertising), Device Type (Smartphones and Tablets, Smart TVs, Laptops and Desktops, and Other Device Types), and Geography (North America, South America, Europe, Asia-Pacific, Middle East, and Africa). The Market Forecasts are Provided in Terms of Value (USD).
| Multi-Streaming Aggregators |
| Unified Content Aggregators |
| White-label OTT Aggregation Platforms |
| Enterprise Video Management Platforms |
| Subscription-Based (SVOD) |
| Advertising-Based (AVOD) |
| Transaction-Based (TVOD) |
| Hybrid (Subscription + Advertising) |
| Smartphones and Tablets |
| Smart TVs |
| Laptops and Desktops |
| Other Device Types |
| North America | United States |
| Canada | |
| Mexico | |
| South America | Brazil |
| Argentina | |
| Chile | |
| Rest of South America | |
| Europe | Germany |
| United Kingdom | |
| France | |
| Italy | |
| Spain | |
| Rest of Europe | |
| Asia-Pacific | China |
| Japan | |
| India | |
| South Korea | |
| Australia | |
| Rest of Asia-Pacific | |
| Middle East | Saudi Arabia |
| United Arab Emirates | |
| Qatar | |
| Rest of Middle East | |
| Africa | South Africa |
| Egypt | |
| Nigeria | |
| Rest of Africa |
| By Service Type | Multi-Streaming Aggregators | |
| Unified Content Aggregators | ||
| White-label OTT Aggregation Platforms | ||
| Enterprise Video Management Platforms | ||
| By Revenue Model | Subscription-Based (SVOD) | |
| Advertising-Based (AVOD) | ||
| Transaction-Based (TVOD) | ||
| Hybrid (Subscription + Advertising) | ||
| By Device Type | Smartphones and Tablets | |
| Smart TVs | ||
| Laptops and Desktops | ||
| Other Device Types | ||
| By Geography | North America | United States |
| Canada | ||
| Mexico | ||
| South America | Brazil | |
| Argentina | ||
| Chile | ||
| Rest of South America | ||
| Europe | Germany | |
| United Kingdom | ||
| France | ||
| Italy | ||
| Spain | ||
| Rest of Europe | ||
| Asia-Pacific | China | |
| Japan | ||
| India | ||
| South Korea | ||
| Australia | ||
| Rest of Asia-Pacific | ||
| Middle East | Saudi Arabia | |
| United Arab Emirates | ||
| Qatar | ||
| Rest of Middle East | ||
| Africa | South Africa | |
| Egypt | ||
| Nigeria | ||
| Rest of Africa | ||


Key Questions Answered in the Report
What is the current and forecast value of the OTT aggregator space?
The OTT aggregator market stood at USD 24.34 million in 2026 and is forecast to reach USD 45.26 million by 2031, growing at a 13.21% CAGR.
Which region leads OTT aggregation demand?
North America led in 2025 with a 36.19% share, supported by dense streaming competition, strong broadband access, and mature bundle economics.
Which region is expanding the fastest for OTT aggregators?
Asia-Pacific is projected to grow at a 17.42% CAGR through 2031, helped by telecom-led bundle models in India and stronger online video momentum across the region.
Which service model is growing fastest in OTT aggregation?
White-label OTT aggregation platforms are projected to grow at a 14.84% CAGR because telecom operators and broadcasters want branded platforms without full in-house development.
What revenue model is changing fastest across aggregator platforms?
The hybrid model is projected to grow at a 17.31% CAGR as platforms combine subscription income with ad-supported access to serve different price points.
Which device category matters most for future platform control?
Smartphones and tablets led in 2025 with 51.34% share, but smart TVs are projected to grow fastest at 15.73% CAGR because the home screen increasingly controls discovery and service visibility.
Page last updated on:





