Oral Solid Dosage CDMO Market Size and Share
Market Overview
| Study Period | 2020 - 2031 |
|---|---|
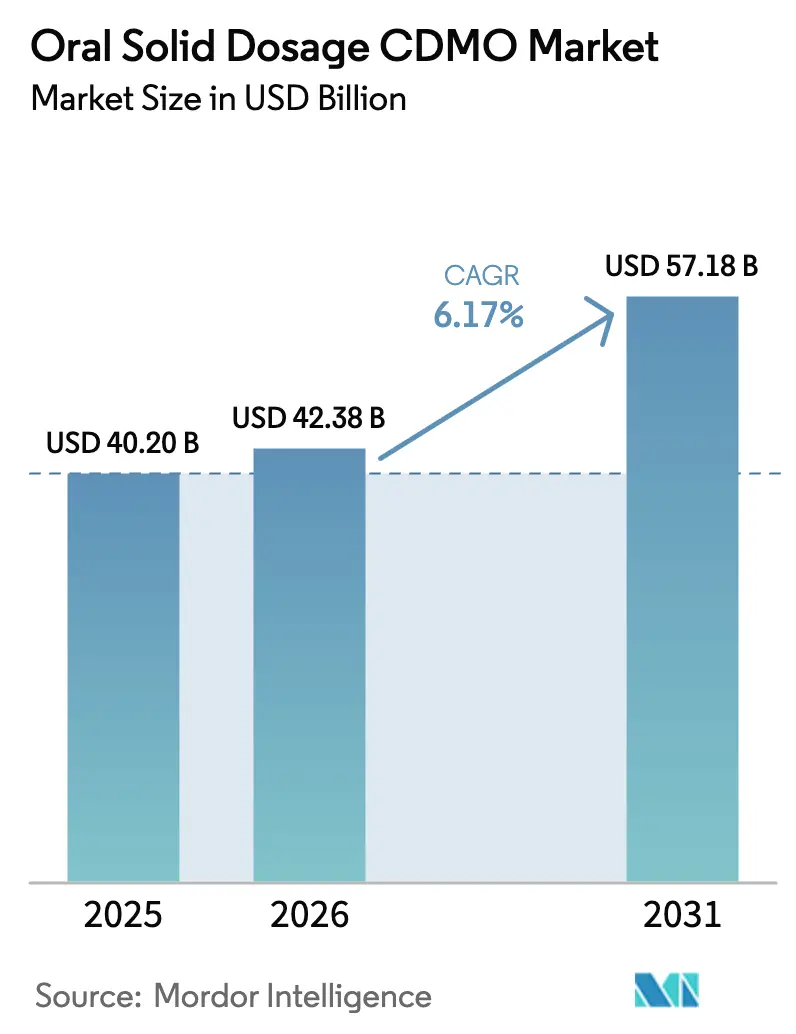
| Market Size (2026) | USD 42.38 Billion |
| Market Size (2031) | USD 57.18 Billion |
| Growth Rate (2026 - 2031) | 6.17% CAGR |
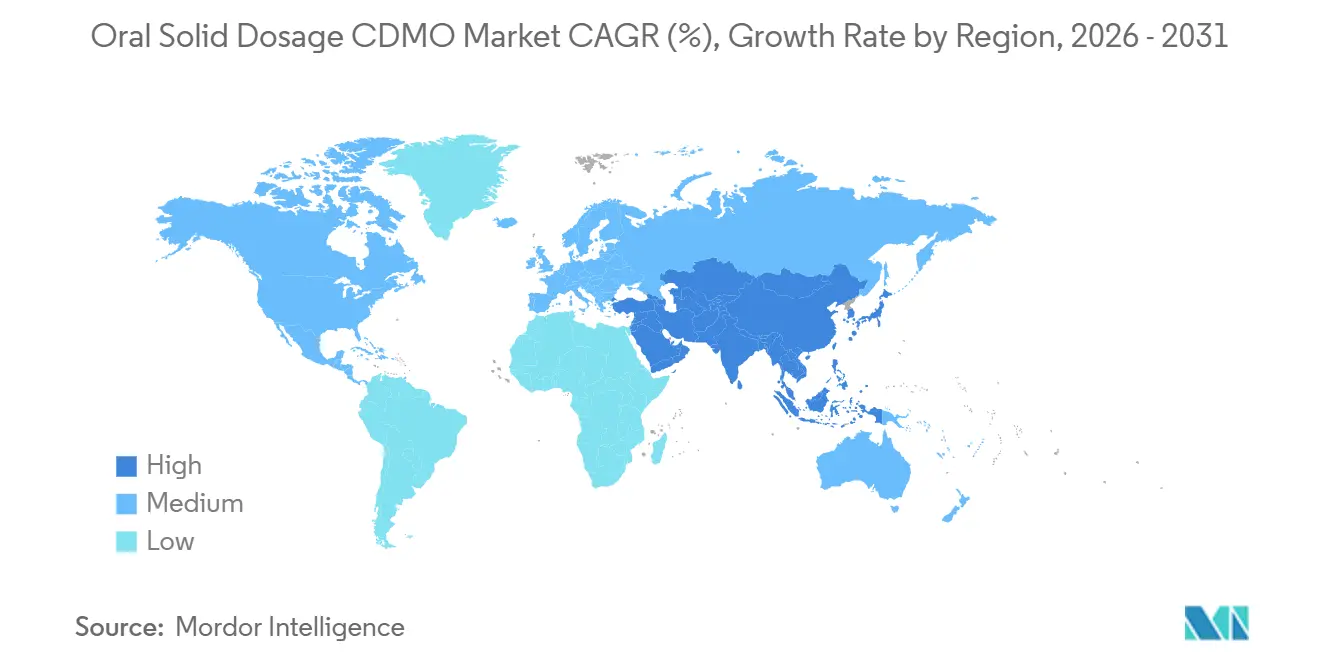
| Fastest Growing Market | Asia Pacific |
| Largest Market | North America |
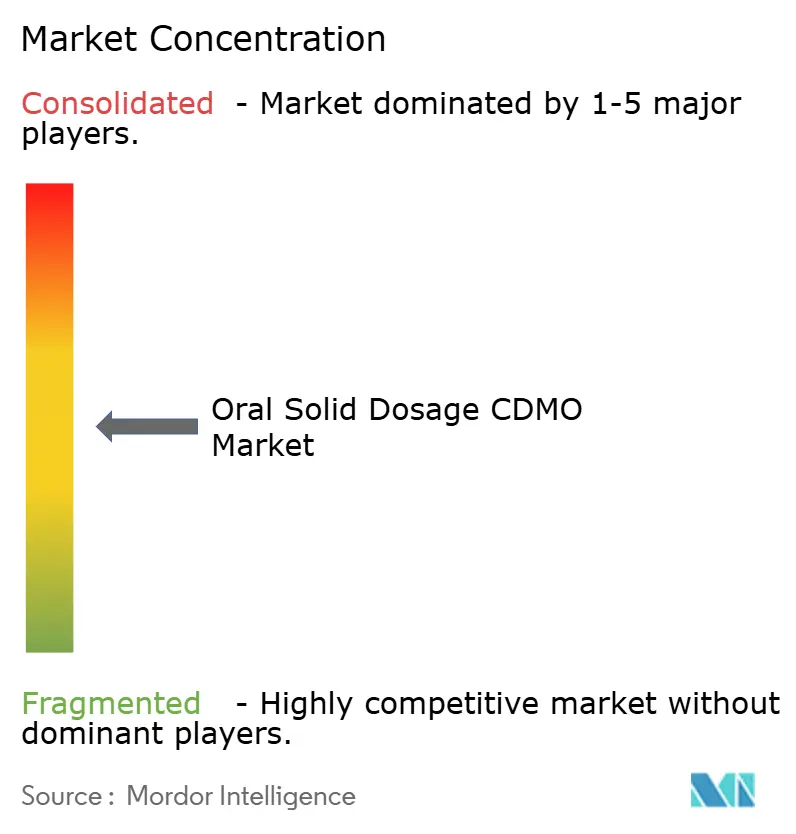
| Market Concentration | Medium |
Major Players *Disclaimer: Major Players sorted in no particular order Image © Mordor Intelligence. Reuse requires attribution under CC BY 4.0. | |
Oral Solid Dosage CDMO Market Analysis by Mordor Intelligence
The Oral Solid Dosage CDMO Market size is expected to grow from USD 40.20 billion in 2025 to USD 42.38 billion in 2026 and is forecast to reach USD 57.18 billion by 2031 at 6.17% CAGR over 2026-2031.
Intensifying outsourcing by large sponsors, rising formulation complexity, and expanding regulatory support for continuous manufacturing are expanding addressable revenue pools for specialized contractors. Poorly soluble small molecules dominate discovery pipelines, prompting sponsors to seek CDMOs with spray-drying, hot-melt extrusion, and high-potency containment capabilities. Continuous-manufacturing approvals doubled between 2024 and 2025, demonstrating regulator confidence in data-rich, real-time-release platforms that compress timelines. Meanwhile, supply-chain realignments following catalytic acquisitions, most notably Novo Holdings’ purchase of Catalent, have concentrated buying power in the hands of fewer, larger clients, heightening price competition but also favoring integrated service models that reduce technology-transfer risk. Finally, nitrosamine and elemental-impurity compliance mandates are enlarging analytical workloads, uplifting demand for CDMOs with in-house LC-MS expertise.
Key Report Takeaways
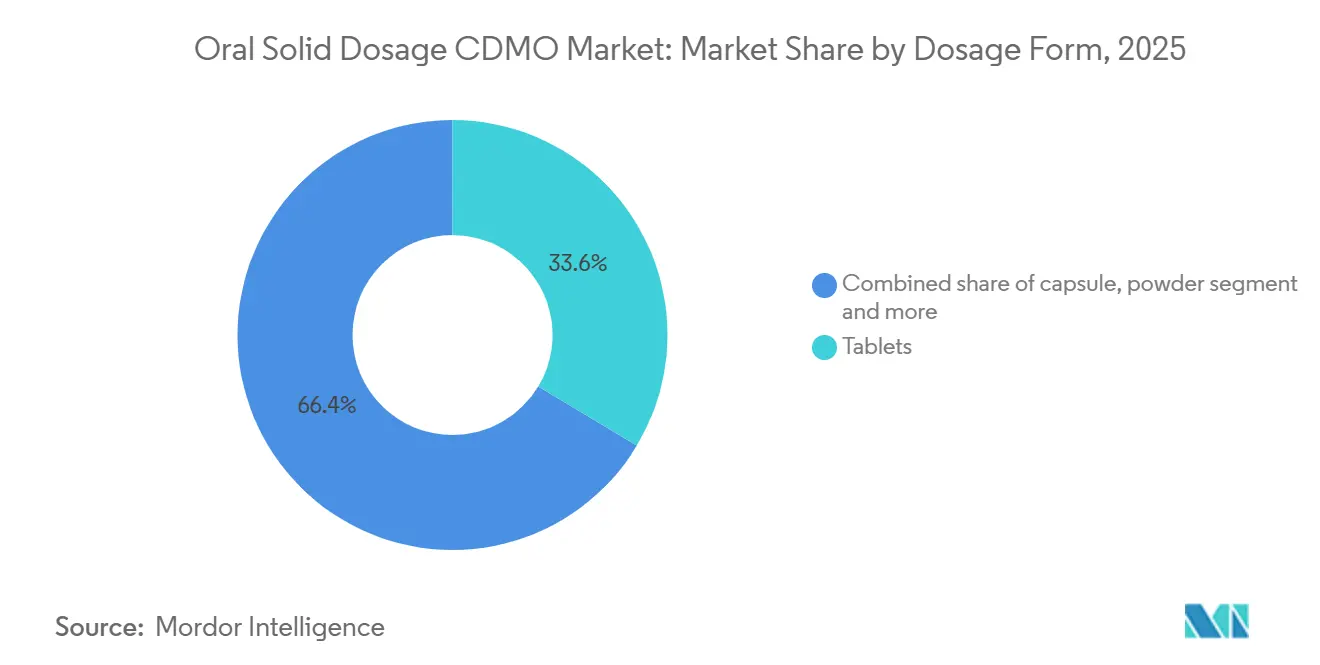
- By dosage form, tablets led with 33.6% revenue share in 2025; capsules are forecast to expand at a 7.23% CAGR to 2031.
- By release mechanism, immediate-release formats held 55.23% share in 2025, while controlled/modified-release systems are projected to grow at an 8.85% CAGR through 2031.
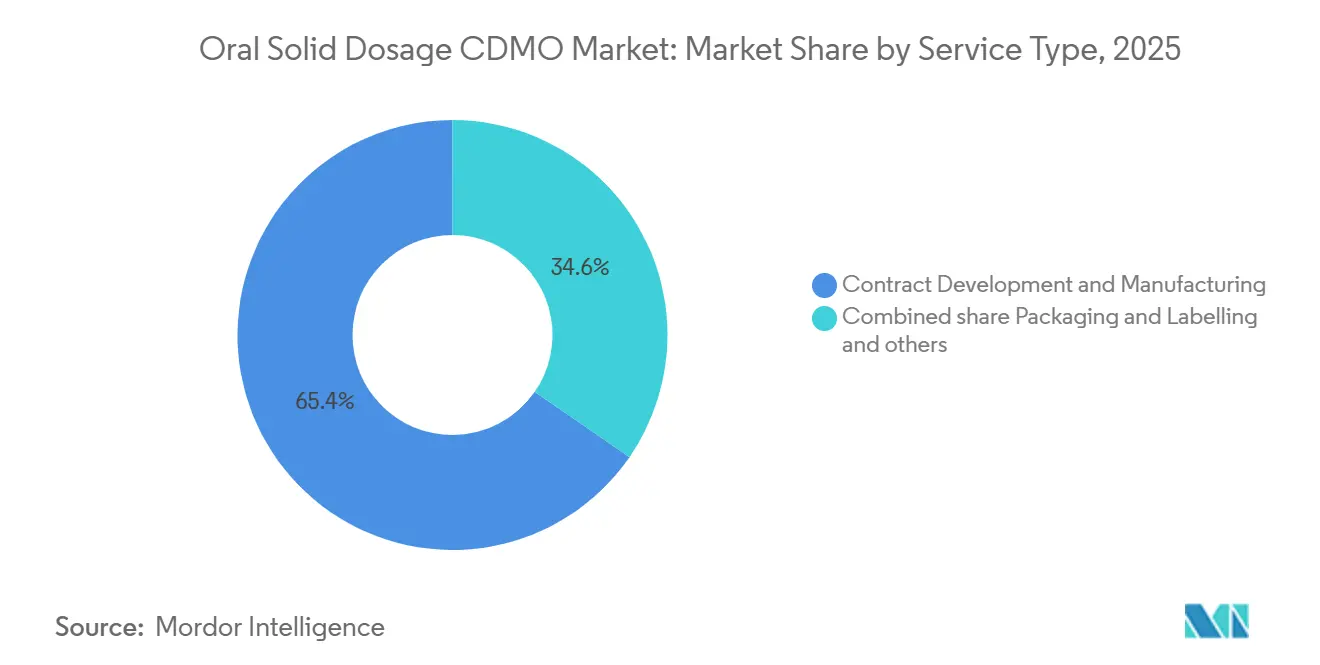
- By service type, contract development and manufacturing captured 65.38% of the Oral Solid Dosage CDMO market size in 2025 and is advancing at a 6.90% CAGR to 2031.
- By end user, large pharma and biotech controlled 58.38% revenue in 2025; medium and small sponsors exhibit the fastest expansion, at a 6.58% CAGR through 2031.
- By geography, North America dominated with 44.25% share of the Oral Solid Dosage CDMO market size in 2025, whereas Asia-Pacific is the fastest-growing region at an 8.48% CAGR to 2031.
Note: Market size and forecast figures in this report are generated using Mordor Intelligence’s proprietary estimation framework, updated with the latest available data and insights as of January 2026.
Global Oral Solid Dosage CDMO Market Trends and Insights
Drivers Impact Analysis*
| Driver | (~) % Impact on CAGR Forecast | Geographic Relevance | Impact Timeline |
|---|---|---|---|
| Outsourcing acceleration for OSD drug product development and manufacturing | +1.8% | North America & Europe | Medium term (2-4 years) |
| Poorly soluble small molecules drive enabling technologies | +1.5% | Global technology hubs | Long term (≥ 4 years) |
| Rising HPAPI and cytotoxic oral therapies require high-containment OSD capacity | +1.2% | Europe, North America, Asia-Pacific | Medium term (2-4 years) |
| Regulatory support and adoption of continuous manufacturing for OSD | +0.9% | North America, Europe, Asia-Pacific | Long term (≥ 4 years) |
| Nitrosamine remediation and NDSRIs spur reformulations and analytics programs | +0.6% | Global | Short term (≤ 2 years) |
| 505(b)(2) lifecycle reformulations expand CDMO addressable work | +0.7% | North America & Europe | Medium term (2-4 years) |
| Source: Mordor Intelligence | |||
Outsourcing Acceleration for OSD Drug Product Development and Manufacturing
Capital allocation has shifted decisively toward molecule pipelines, with big-pharma sponsors redirecting more than USD 50 billion in 2024-2025 away from fixed assets. High-profile commitments—Eli Lilly (USD 27 billion) and Novartis (USD 23 billion)—signal that in-house oral solid capacity no longer delivers compelling returns. Large sponsors confronting patent cliffs are rerouting legacy brands to CDMOs, while virtual biotechs with zero manufacturing footprint accounted for 38% of FDA NDAs in 2025 [1]U.S. Food and Drug Administration, “Novel Drug Approvals 2024,” FDA, fda.gov Drivers. Contractors offering integrated formulation-through-commercial services are winning a disproportionate share because single-source models eliminate costly hand-offs.
Poorly Soluble Small Molecules Drive Enabling Technologies
More than 70% of pipeline candidates exhibit poor solubility, motivating rapid deployment of spray-drying and hot-melt extrusion. Commercial installations of spray-dried-dispersion towers tripled in 2024-2025 [2]S. Kumar et al., “Amorphous Solid Dispersions: A Strategy for Enhancing Oral Bioavailability,” AAPS PharmSciTech, aaps.org. Capital intensity remains a barrier; single dryers cost USD 3-5 million, creating structural advantages for incumbents. FDA draft guidance issued in 2024 clarified recrystallization-stability expectations, influencing CDMO selection by sponsors intent on derisking approval timelines.
Rising HPAPI and Cytotoxic Oral Therapies Require High-Containment OSD Capacity
High-potency molecules now represent 35% of oncology pipelines, yet only 18 CDMOs operate OEB 5 facilities, stretching project lead times to 24 months. Pfizer CentreOne’s USD 120 million containment suite in Freiburg, commissioned in 2024, was fully booked within six months. ISPE guidance released the same year raised engineering standards, adding 40% to build-out costs [3]International Society for Pharmaceutical Engineering, “Containment Strategies for High-Potency APIs,” ISPE, ispe.org.
Regulatory Support and Adoption of Continuous Manufacturing for OSD
FDA’s Emerging Technology Program approved 12 continuous lines between 2024 and 2025, slashing cycle times from weeks to days. Vertex gained cost savings of 30% on its cystic-fibrosis tablet after FDA’s 2024 approval. EMA granted its first continuous-manufacturing approval in 2025, signaling convergence that lowers adoption risk.
Restraints Impact Analysis*
| Restraint | (~) % Impact on CAGR Forecast | Geographic Relevance | Impact Timeline |
|---|---|---|---|
| Evolving compliance burden (nitrosamines, elemental impurities) increases cost/time | -0.8% | North America & Europe | Short term (≤ 2 years) |
| Pricing pressure and procurement consolidation compress margins | -1.1% | Global | Medium term (2-4 years) |
| Talent gaps in containment/process engineering slow HP-OSD scale-up | -0.5% | Asia-Pacific & emerging markets | Long term (≥ 4 years) |
| Specialized-capacity bottlenecks extend lead times | -0.7% | Europe & North America | Medium term (2-4 years) |
| Source: Mordor Intelligence | |||
Evolving Compliance Burden Increases Cost and Time
ICH Q3D elemental-impurity limits plus nitrosamine testing raised per-product compliance costs by an average of USD 1.2 million in 2025. CDMOs without in-house LC-MS now outsource assays at USD 5,000-15,000 per sample, eroding generic margins.
Pricing Pressure and Procurement Consolidation Compress Margins
Top-10 pharma companies cut CDMO rosters by a significant share during 2024-2025, extracting price concessions that lowered gross margins at leading contractors. For example, Catalent’s oral-technologies margin fell from 28% to 24%. Extended payment terms further stress working capital.
*Our forecasts treat driver/restraint impacts as directional, not additive. The impact forecasts reflect baseline growth, mix effects, and variable interactions.
Segment Analysis
By Dosage Form: Capsules Gain on Swallowability and HP Suitability
Tablets held 33.6% market share in 2025, yet capsules are forecast for a 7.23% CAGR through 2031, outstripping tablets’ 5.8% advance. Hard-shell gelatin and HPMC capsules mitigate dust generation, making them preferred for OEB 4-5 compounds. Capsule formats were specified in 42% of 505(b)(2) approvals in 2024 because they better accommodate lipid-based or spray-dried dispersions. Patient studies show 68% favor capsules for ease of swallowing.
Lonza expanded capsule-filling in Portsmouth in 2024, adding 2 billion units of annual capacity focused on high-potency oncology products. While immediate-release tablets remain entrenched for commoditized generics, modified-release tablets capture incremental value through polymer-coated matrices that enable once-daily dosing.


By Release Mechanism: Modified Release Captures Lifecycle Extensions
Immediate-release formats commanded 55.23% revenue in 2025, yet controlled/modified-release variants are projected to grow 8.85% CAGR to 2031. Once-daily dosing boosts adherence to 78% versus 62% for twice-daily regimens. Delayed-release share reached a notable share in 2025, supported by enteric coatings for gastric protection. GLP-1 agonists reformulated into oral modified-release versions are expanding the scope of swallowable peptides; Novo Nordisk’s improved oral semaglutide, launched in 2024, demonstrated the feasibility of this approach. CDMOs with in-silico dissolution-modeling and IVIVC expertise accelerate submission readiness, reinforcing integrated service demand.
By Service Type: Integrated CDMO Models Capture Share
Contract development and manufacturing generated 65.38% of 2025 revenue and will rise at 6.90% CAGR through 2031. A 2024 survey showed 42% of tech transfers between separate organizations suffered six-month delays, prompting sponsors to favor single-source partners. Serialization regulations such as DSCSA are propelling packaging and labeling outsourcing, which held a notable share in 2025. Thermo Fisher’s Patheon unit, spanning 40 sites, captured a smaller share of the global Oral Solid Dosage CDMO market share in 2025.
By End User: Mid-Tier Pharma Drives Outsourcing Growth
Large pharma/biotech delivered 58.38% of 2025 revenue, but mid-size and emerging sponsors show faster expansion, at 6.58% CAGR. Venture-backed companies that outsourced manufacturing reached clinical milestones 30% sooner than peers that built internal capacity. Alcami’s biotech-focused model, launched in 2024, captured 15 new clients within a year. Roster consolidation among big sponsors squeezes unit prices yet opens opportunities for niche CDMOs specialized in flexible batch sizes.
Geography Analysis
North America accounted for 44.25% of the Oral Solid Dosage CDMO market share in 2025, underpinned by proximity to FDA headquarters and the Emerging Technology Program’s endorsement of 12 continuous-manufacturing platforms between 2024 and 2025. Regional revenue is projected to expand through 2031 as sponsors prioritize supply chains that reduce audit complexity and enable rapid regulatory engagement; a 2024 poll showed 72% of U.S. companies favor domestic contractors despite 15-25% cost premiums over Asian options. Thermo Fisher’s USD 180 million Greenville upgrade added three continuous lines in January 2025, targeting biotech clients that require flexible batches and fast turnarounds. Canada and Mexico jointly held notable share of regional sales in 2025; PCI Pharma Services’ USD 75 million Monterrey plant illustrates Mexico’s appeal for nearshoring under USMCA trade rules. High domestic labor costs 40-60% above Asia-Pacific continue to push commodity tablet work offshore while preserving high-value continuous-manufacturing and high-potency projects locally.
Asia-Pacific is forecast to grow at an 8.48% CAGR, the fastest among all regions of the Oral Solid Dosage CDMO market, driven by large-scale investments in China and India. India’s Production-Linked Incentive scheme spurred USD 4.2 billion of spending during 2024-2025; Granules India’s USD 220 million Gagillapur expansion, approved by FDA in December 2024, added continuous-manufacturing capability aimed at U.S. biotech clients. China’s sector grew 22% in 2024 as players such as WuXi AppTec acquired an oral-solids plant in Wuxi with 5 billion-tablet output for both domestic and export supply. Japan's regional revenue in 2025 faces headwinds from aging assets, whereas South Korea benefited from Samsung Biologics’ USD 310 million tablet-facility purchase in 2024. Australia kept a modest share, yet recent TGA alignment with ICH rules is drawing clinical-trial production from Northern Hemisphere sponsors. Although labor costs run 50-70% below those in North America and Europe, longer inspection lead times limit penetration in controlled-substance and cytotoxic segments.
Europe contributed significantly to the Oral Solid Dosage CDMO market size in 2025, anchored by Germany and Switzerland, which together house majority of the world’s OEB 5 facilities. Energy prices in Europe surged above pre-2022 levels during 2024, encouraging relocation of low-margin work to cheaper locales . Germany held notable share of of European revenue in 2025 following Siegfried’s USD 85 million Minden extrusion expansion for poorly soluble molecules. The United Kingdom has shortened MHRA approval timelines for CDMO output from 15 to 11 months, boosting its attractiveness for fast launches. France, Italy, and Spain collectively held notable share, highlighted by Recipharm’s USD 300 million Novo Nordisk contract for oral semaglutide tablets signed in September 2024. Middle East and Africa revenue share in 2025 is supported by Saudi Arabia’s USD 1.3 billion localization incentives, while South America’s stake reflects Brazil’s move to cut CDMO approval cycles from 18 to 12 months in 2024, enticing U.S. sponsors to nearshore Latin American supply.

Competitive Landscape
The five largest contractors, Catalent, Thermo Fisher, Lonza, Recipharm, and Piramal, collectively controlled a significant revenue share, underscoring moderate concentration. Novo Holdings’ USD 16.5 billion Catalent acquisition in 2024 marked the sector’s largest transaction and signaled a vertical-integration play to secure GLP-1 capacity. Technology differentiation governs pricing: CDMOs touting continuous-manufacturing lines achieved 28% premiums, while those with OEB 5 suites commanded 35%. Lonza filed 12 capsule-filling patents in 2024, and CordenPharma submitted eight covering continuous granulation, indicating active IP strategies. Compliance records remain a decisive factor; contractors with three years of zero Form 483 observations win mandates even at higher unit costs. Capacity bottlenecks in specialized equipment create temporary moats for early investors, enabling retention of premium margins despite intensifying price pressure for commodity tablet work.
Oral Solid Dosage CDMO Industry Leaders
Catalent
Thermo Fisher Scientific
Lonza
Recipharm
Piramal Pharma Solutions
- *Disclaimer: Major Players sorted in no particular order

Recent Industry Developments
- January 2026: Halo Pharma announced it would operate as a stand-alone drug-product CDMO while launching a sterile business by H2 2026. Halo will continue to offer oral solids, liquids and semi-solids from both Halo sites.
- August 2025: Piramal Pharma Solutions opened a dedicated OSD suite in Sellersville, Pennsylvania.
- February 2025: Ardena acquired a Catalent facility to bolster late-stage oral-formulation capabilities.


Global Oral Solid Dosage CDMO Market Report Scope
As per the scope of the report, Oral Solid Dosage (OSD) CDMO is a specialized contract partner that provides end-to-end development and manufacturing services for drugs in solid forms, such as tablets, capsules, powders, and granules. These organizations support pharmaceutical and biotech companies by offering scientific expertise in formulation development, analytical testing, and commercial-scale production, helping to move a drug molecule from initial discovery to market launch.
The Oral Solid Dosage (OSD) CDMO Market is segmented by dosage form, release mechanism, service type, end-users, and geography. By dosage form, the market is categorized into tablets, capsules, powders, and others (lozenges, gummies, etc.). By release mechanism, the market is divided into immediate release, delayed release, and controlled/modified release. By service type, it is segmented into contract development and manufacturing, packaging & labelling, and others (Regulatory Affairs, Logistics, etc.). By end-users, the segmentation includes large pharma/biotech and medium & small pharma/biotech. Geographically, the market is segmented across North America, Europe, the Asia-Pacific region, the Middle East & Africa, and South America. The market report also covers the estimated market sizes and trends for 17 countries across major regions globally. For each segment, the market size and forecast are provided in terms of value (USD).
| Tablets |
| Capsules |
| Powders |
| Others (Lozenges, Gummies, etc.) |
| Immediate Release |
| Delayed Release |
| Controlled/Modified Release |
| Contract Development and Manufacturing |
| Packaging & Labelling |
| Others (Regulatory Affairs, Logistics, etc.) |
| Large Pharma/Biotech |
| Medium & Small Pharma/Biotech |
| North America | United States |
| Canada | |
| Mexico | |
| Europe | Germany |
| United Kingdom | |
| France | |
| Italy | |
| Spain | |
| Rest of Europe | |
| Asia Pacific | China |
| Japan | |
| India | |
| Australia | |
| South Korea | |
| Rest of Asia Pacific | |
| Middle East and Africa | GCC |
| South Africa | |
| Rest of Middle East and Africa | |
| South America | Brazil |
| Argentina | |
| Rest of South America |
| By Dosage Form | Tablets | |
| Capsules | ||
| Powders | ||
| Others (Lozenges, Gummies, etc.) | ||
| By Release Mechanism | Immediate Release | |
| Delayed Release | ||
| Controlled/Modified Release | ||
| By Service Type | Contract Development and Manufacturing | |
| Packaging & Labelling | ||
| Others (Regulatory Affairs, Logistics, etc.) | ||
| By End User | Large Pharma/Biotech | |
| Medium & Small Pharma/Biotech | ||
| By Geography | North America | United States |
| Canada | ||
| Mexico | ||
| Europe | Germany | |
| United Kingdom | ||
| France | ||
| Italy | ||
| Spain | ||
| Rest of Europe | ||
| Asia Pacific | China | |
| Japan | ||
| India | ||
| Australia | ||
| South Korea | ||
| Rest of Asia Pacific | ||
| Middle East and Africa | GCC | |
| South Africa | ||
| Rest of Middle East and Africa | ||
| South America | Brazil | |
| Argentina | ||
| Rest of South America | ||


Key Questions Answered in the Report
How large is the Oral Solid Dosage CDMO market in 2026 and what growth is expected?
The market is estimated to reach USD 42.38 billion in 2026 and is projected to reach USD 57.18 billion by 2031, growing at a 6.17% CAGR.
Which dosage form is expanding fastest in Oral Solid Dosage CDMO contracts?
Capsules show the fastest growth, with a 7.23% CAGR forecast to 2031, driven by swallowability benefits and suitability for high-potency payloads
Why are sponsors adopting continuous manufacturing for oral solids?
Continuous manufacturing cuts cycle times from weeks to 24-48 hours, enables real-time release testing, and enjoys regulator support, making it attractive for cost and speed advantages.
What is the main regulatory challenge facing CDMOs today?
Meeting nitrosamine and elemental-impurity guidelines adds USD 0.5-2 million per product and requires advanced LC-MS analytics, straining contractors without in-house capabilities.
Which region is the fastest-growing hub for Oral Solid Dosage CDMO capacity?
Asia-Pacific leads with an 8.48% CAGR through 2031, catalyzed by India’s Production-Linked Incentive scheme and ongoing capacity additions in China.
Page last updated on:


