Optical Preclinical Imaging Market Size and Share
Market Overview
| Study Period | 2020 - 2031 |
|---|---|
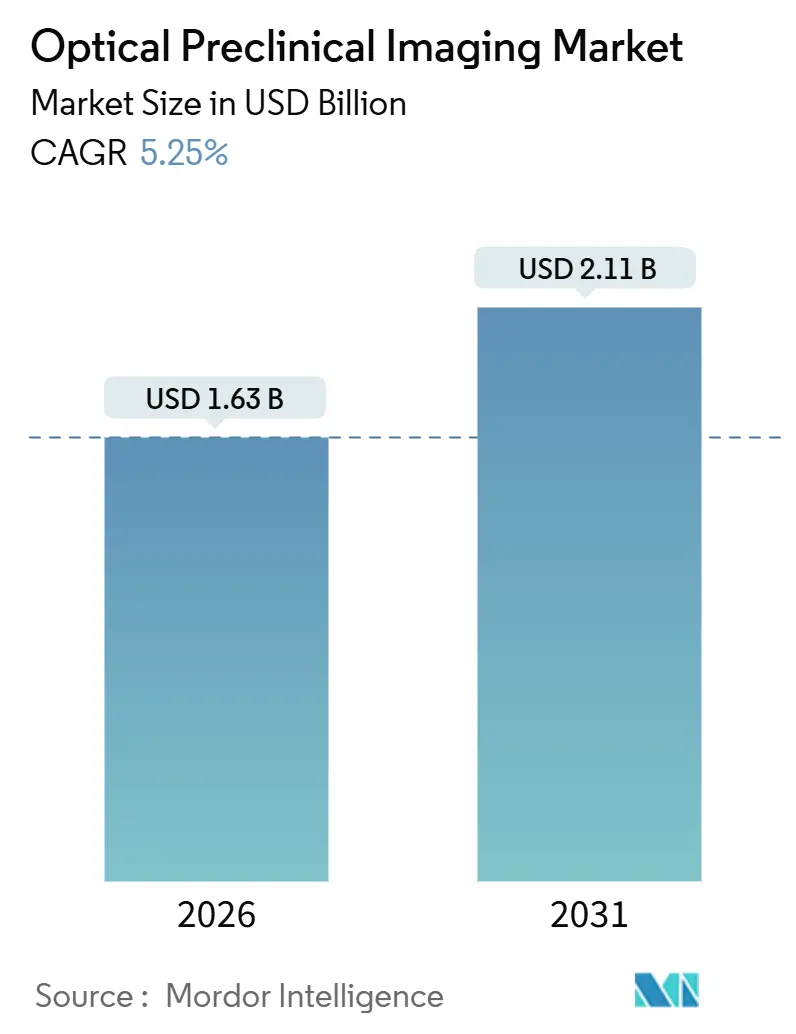
| Market Size (2026) | USD 1.63 Billion |
| Market Size (2031) | USD 2.11 Billion |
| Growth Rate (2026 - 2031) | 5.25% CAGR |
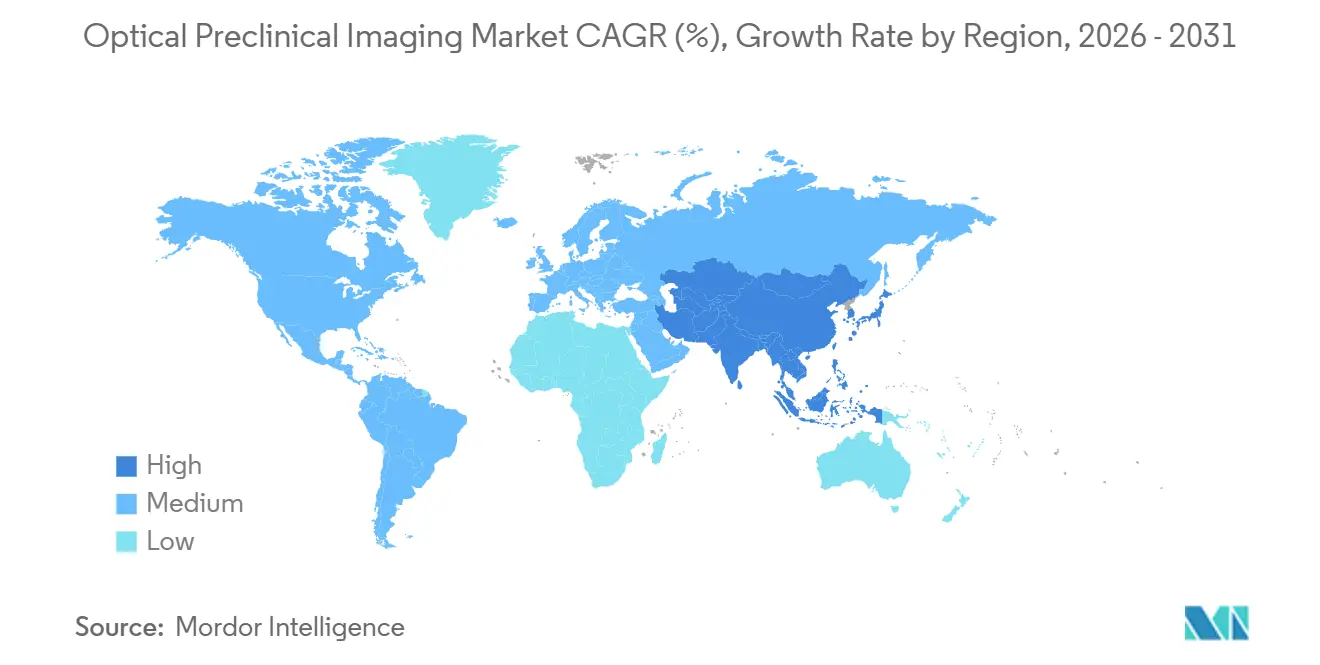
| Fastest Growing Market | Asia Pacific |
| Largest Market | North America |
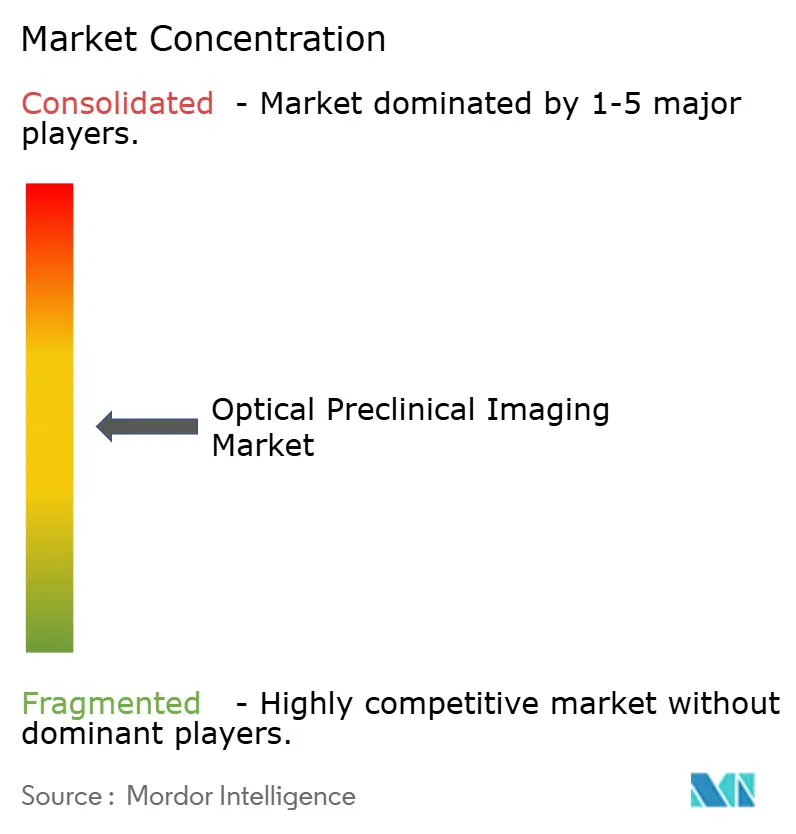
| Market Concentration | Medium |
Major Players *Disclaimer: Major Players sorted in no particular order Image © Mordor Intelligence. Reuse requires attribution under CC BY 4.0. | |
Optical Preclinical Imaging Market Analysis by Mordor Intelligence
The Optical Preclinical Imaging market size is estimated at USD 1.63 billion in 2026 and is projected to reach USD 2.11 billion by 2031, advancing at a CAGR of 5.25% over the forecast period. Current expansion pivots on a shift from single-sale instrumentation toward integrated service models in which contract research organizations (CROs) and shared academic cores shoulder capital outlays while pharmaceutical sponsors pay study-based fees. Uptake of fluorescence, bioluminescence, Cherenkov, and photoacoustic systems is bolstered by AI-enabled reconstruction that reduces scan time and boosts sensitivity, thereby increasing throughput and lowering unit costs. Oncology programs continue to dominate demand, yet neurology and cardiovascular research are registering faster growth as CRISPR gene editing and photoacoustic hybrids unlock previously inaccessible endpoints. Regional growth differentials persist: North America’s mature infrastructure supports incremental upgrades, whereas Asia-Pacific’s greenfield build-outs create sizeable first-install opportunities. Against this backdrop, vendors are diversifying into reagents, cloud software, and subscription models to secure recurring revenue streams and hedge against hardware price compression.
Key Report Takeaways
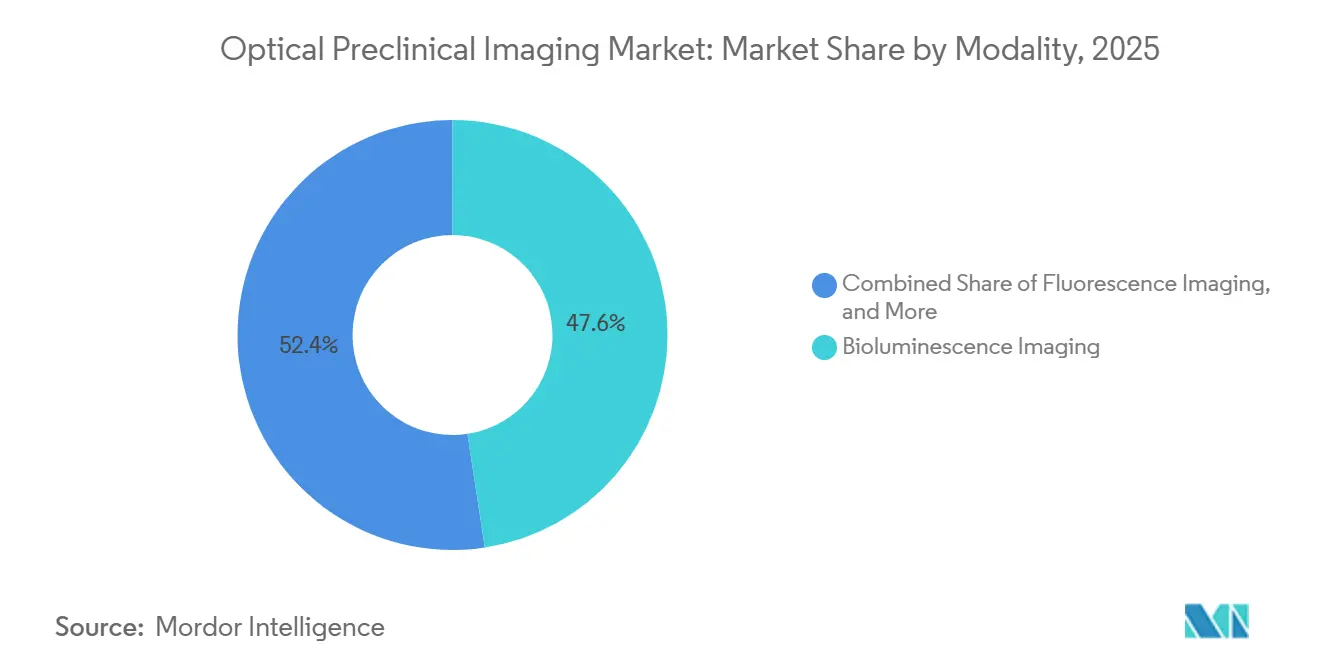
- By modality, fluorescence commanded 47.55% Optical Preclinical Imaging market share in 2025, while Cherenkov luminescence is forecast to expand at a 9.25% CAGR through 2031.
- By application, oncology led with 45.53% revenue share in 2025, whereas neurology is projected to grow at an 8.85% CAGR to 2031.
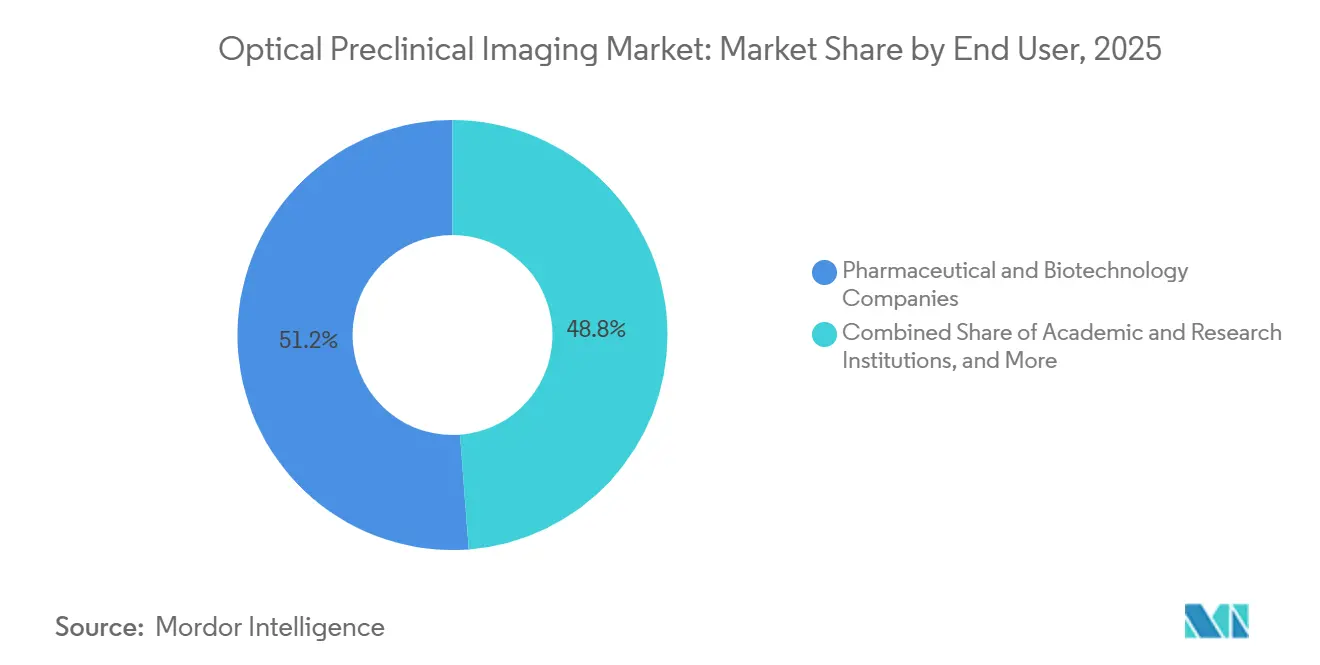
- By end user, pharmaceutical and biotechnology companies held 51.23% share in 2025, and CROs are expected to record the highest 8.55% CAGR during 2026-2031.
- By geography, North America retained a 41.13% share in 2025, whereas Asia-Pacific is predicted to rise at an 8.81% CAGR through 2031.
Note: Market size and forecast figures in this report are generated using Mordor Intelligence’s proprietary estimation framework, updated with the latest available data and insights as of January 2026.
Global Optical Preclinical Imaging Market Trends and Insights
Driver Impact Analysis*
| Driver | (~) % Impact on CAGR Forecast | Geographic Relevance | Impact Timeline |
|---|---|---|---|
| Bioluminescent Probe Cost Declines Unlock in-Vivo Screening Scale-Ups | +0.8% | Global, strongest in North America and Europe | Medium term (2-4 years) |
| Growing Use of CRISPR-Based Disease Models Demanding High-Throughput Optical Read-Outs | +1.1% | North America, Europe, Asia-Pacific | Long term (≥ 4 years) |
| Pharma Oncology Pipeline Expansion Needs Longitudinal Tumor-Burden Tracking | +0.9% | Global, led by North America and Europe | Medium term (2-4 years) |
| Academic Consortia Pooling Cap-Ex via Shared-Instrument Cores | +0.6% | North America, Europe, emerging Asia-Pacific | Long term (≥ 4 years) |
| AI-Assisted Image Reconstruction Boosts Sensitivity Beyond Hardware Limits | +0.7% | Global | Short term (≤ 2 years) |
| Adoption of Fiber-Optic Photoacoustic Hybrids for Deep-Tissue Metabolic Imaging | +0.5% | North America, Europe, select Asia-Pacific hubs | Medium term (2-4 years) |
| Source: Mordor Intelligence | |||
Bioluminescent Probe Cost Declines Unlock In-Vivo Screening Scale-Ups
Firefly luciferase substrates, priced at USD 0.18 per mg in 2025, down 42% from 2022, are enabling weekly 500-animal oncology screens rather than monthly campaigns[1]PerkinElmer, “Annual Report 2024,” perkinelmer.com. Cost relief stems from recombinant production scale-ups and patent expirations on coelenterazine analogs, which have triggered biosimilar competition. Pharmaceutical discovery groups capitalize by shifting early target validation from ex vivo histology to live imaging, compressing decision cycles by up to 8 weeks. NIH-funded laboratories documented a 63% jump in bioluminescent experiments between 2023 and 2025, underscoring broad adoption[2]National Institutes of Health, “NIH RePORTER Database,” reporter.nih.gov. The throughput gained per animal also aligns with institutional mandates to reduce vertebrate usage. As a result, the Optical Preclinical Imaging market absorbs durable reagent demand, adding recurring revenue to vendor portfolios.
Growing Use of CRISPR-Based Disease Models Demanding High-Throughput Optical Read-Outs
CRISPR-edited mice accounted for 47% of new preclinical models in 2025, up from 29% in 2022. Gene-edited strains require non-invasive, longitudinal imaging over 12- to 24-month lifespans to correlate genotype with phenotypic kinetics. Fluorescence and bioluminescence platforms provide weekly tumor, neurodegeneration, or immune infiltration metrics without euthanasia, reducing total animal numbers by up to 40%. A 2025 survey of 340 researchers showed 68% adoption of optical imaging specifically for CRISPR models. CROs expanded capacity by 35% in 2024-2025 to meet the surge, strengthening the Optical Preclinical Imaging market’s service revenue base.
Pharma Oncology Pipeline Expansion Needs Longitudinal Tumor-Burden Tracking
FDA records list 1,847 active oncology Investigational New Drug dossiers as of December 2025, 22% higher than in 2023. Solid-tumor candidates require preclinical efficacy data over 4- to 8-week regimens; optical imaging delivers twice-weekly volumetric read-outs without sacrificing animals, trimming cohort counts and costs. Developers of antibody–drug conjugates use these modalities to shorten lead selection by up to 5 months. Regulatory confidence rose after the FDA’s 2024 guidance recognized bioluminescence as an acceptable surrogate in certain immuno-oncology studies.
Academic Consortia Pooling Cap-Ex via Shared-Instrument Cores
Shared cores lower per-investigator imaging costs by 58%, enabling deployment of USD 800,000–1.2 million multimodal systems that serve up to 60 research groups. The NIH’s Shared Instrumentation Grant program disbursed USD 127 million in 2025 to optical platforms, up 30% from 2023, prioritizing open-access scheduling. Euro-BioImaging manages 23 optical nodes across 14 countries, enabling cross-border use. A PLOS ONE analysis found that core users publish imaging data 18 months faster than labs with departmental instruments. Concentrating cap-ex in cores broadens the Optical Preclinical Imaging market’s installed base without inflating individual lab budgets.
Restraints Impact Analysis*
| Restraint | (~) % Impact on CAGR Forecast | Geographic Relevance | Impact Timeline |
|---|---|---|---|
| Light-Scattering Limits Quantitative Depth Accuracy in Large-Animal Models | -0.4% | Global, high in North America and Europe | Medium term (2-4 years) |
| Ethical Push to Replace Animal Studies Dampening Installed-Base Growth | -0.6% | Europe strongest, also North America, Asia-Pacific | Long term (≥ 4 years) |
| Limited Reimbursement Pathways for Translational Optical Tracers | -0.3% | Global, acute in North America and Europe | Long term (≥ 4 years) |
| Import Tariffs on Precision Optics Raising System ASPs in South America | -0.2% | Argentina, Brazil; spillover to other emerging markets | Short term (≤ 2 years) |
| Source: Mordor Intelligence | |||
Light-Scattering Limits Quantitative Depth Accuracy in Large-Animal Models
Optical photons lose 90% intensity beyond 8 mm in mice and 5 mm in swine or primates, causing >50% quantification error for deep organs. Consequently, 41% of 180 surveyed labs reverted to nuclear imaging for large-animal pharmacokinetics in 2025, despite per-scan costs that were three times higher. Photoacoustics partially alleviates the limitations of shallow organs but lacks whole-body coverage. These physics constraints cap the Optical Preclinical Imaging market’s addressable scope in late-stage translational programs.
Ethical Push to Replace Animal Studies Dampening Installed-Base Growth
EU member states cut animal use 18% between 2022 and 2025 under Directive 2010/63/EU[3]European Commission, “Statistical Report on Animal Use 2025,” europa.eu. The Netherlands and Germany achieved reductions exceeding 20%. NIH launched a USD 95 million alternative methods initiative in 2025, aiming to reduce the use of mammalian models by 30% by 2030. Imaging vendors pivot toward organoid platforms, yet unit prices of USD 180,000–250,000 are roughly half those of in-vivo systems, suppressing per-unit revenue.
*Our forecasts treat driver/restraint impacts as directional, not additive. The impact forecasts reflect baseline growth, mix effects, and variable interactions.
Segment Analysis
By Modality: Fluorescence Dominance Meets Cherenkov Disruption
Fluorescence imaging captured 47.55% share of the Optical Preclinical Imaging market in 2025, anchored by versatile probe chemistries and capacity for five-channel multiplexing. Cherenkov luminescence is expanding at a 9.25% CAGR through 2031 because radiopharmaceutical developers value its label-free read-outs, which accelerate theranostic validation workflows[4]Nature Biomedical Engineering, “Cherenkov Luminescence Imaging for Radiopharmaceutical Biodistribution,” nature.com. Bioluminescence held roughly a 28% share, thanks to low background noise and its suitability for longitudinal oncology studies, though reliance on transgenic lines delays study initiation. Photoacoustics secured about 12% share, gaining traction in cardiovascular and metabolic research where deeper penetration and hemoglobin sensitivity deliver unique insights.
The segment’s competitive landscape now favors multimodal chassis that accommodate fluorescence, bioluminescence, and X-ray or CT overlays, shielding labs from technological dead-ends as experimental needs evolve. Bruker’s June 2025 acquisition of AAT Bioquest’s probe portfolio exemplifies a reagent-led moat strategy that ties consumable chemistry tightly to hardware ecosystems. As AI reconstruction diffuses across vendor offerings, differentiation migrates from raw hardware specs toward integrated workflows, cloud archiving, and regulatory-ready analytics suites. The Optical Preclinical Imaging market size for multimodal systems is projected to expand as labs consolidate footprints to optimize grant budgets and animal facility space.


By Application: Oncology Leadership Yields to Neurology Momentum
Oncology maintained a 45.53% revenue share in 2025, mirroring its 38% proportion of global R&D spending. Tumor xenograft and syngeneic mouse models remain core to biopharma pipelines, reinforcing consistent instrument utilization rates. Neurology applications, however, are accelerating at an 8.85% CAGR because CRISPR-generated Alzheimer’s and Parkinson’s models demand monthly tracking of neurodegeneration that histology cannot provide[5]Cell Reports Methods, “CRISPR-Edited Mouse Models in Neuroscience Research,” cell.com . Cardiovascular research benefits from photoacoustics for plaque and perfusion imaging, yet nuclear techniques continue to dominate translational large-animal work, tempering optical growth.
The optical preclinical imaging market size for neurology studies is expected to grow further as large consortia pool longitudinal datasets in cloud repositories, inviting cross-site analytics that reward standardized, high-resolution fluorescence protocols. The Oncology-weighted installed base is being partially repurposed as gene editing pushes brain and metabolic disease models to the fore. Vendor roadmaps increasingly feature neuro-optimized optics and fiber-optic probes to satisfy this modality shift.
By End User: Pharma Incumbency Faces CRO Disruption
Pharmaceutical and biotechnology companies held a 51.23% share in 2025, justified by internal imaging suites that safeguard proprietary compounds and provide near-real-time data to discovery teams. CROs, advancing at an 8.55% CAGR, appeal to mid-tier biotech firms that prefer per-study fees to capital commitments of USD 1.8 million. Academic institutions sustain a notable share through NIH and Horizon Europe grants, but their growth moderates as funding agencies emphasize alternative models and data sharing that de-emphasize instrument ownership.
The optical preclinical imaging market share attributable to CROs is likely to continue rising, as vendors now tailor service contracts, reagent rentals, and deferred payments to this segment. LI-COR’s 2025 reagent-rental launch reduced upfront cash by 42%, illustrating a subscription pivot that stabilizes revenue while lowering customer entry barriers. Pharmaceutical companies simultaneously retain core imaging capability for lead optimization but outsource bulk efficacy studies, creating a hybrid workflow that broadens instrument utilization cycles and expands consumable pull-through.
Geography Analysis
North America accounted for 41.13% of the 2025 Optical Preclinical Imaging market revenue, supported by 340 NIH-funded cores and FDA guidance that legitimizes optical endpoints. The region’s replacement demand centers on AI-ready upgrades and cloud-linked archives, fostering premium pricing opportunities for software bundles. Europe follows as a sizeable but slower-growing market, hemmed in by Directive 2010/63/EU and a societal shift toward non-animal methodologies; growth therefore tilts toward high-content organoid imaging rather than large-scale in-vivo system expansion.
Asia-Pacific is the fastest-growing region, with an 8.81% CAGR, propelled by China’s CNY 12 billion (USD 1.65 billion) in translational infrastructure grants and India’s 17 new imaging facilities across Bangalore, Hyderabad, and Pune. Japan’s AMED allocated JPY 8.4 billion (USD 56 million) to regenerative medicine imaging in 2025, further inflating regional demand. Vendors respond with local service hubs, extended payment terms, and Mandarin- or Hindi-localized software, thereby embedding themselves in early-stage procurement cycles.
South America remains price-sensitive; tariffs inflate unit costs, pushing institutions toward refurbished systems and extending replacement intervals. Middle East and Africa register low volumes but offer strategic beachheads: Saudi Arabia’s KAUST installed a USD 1.4 million multimodal suite in February 2025 as part of a USD 220 million life-science initiative. Over time, sovereign wealth investments could seed incremental demand, although political stability and procurement transparency remain gating factors for sustained Optical Preclinical Imaging market penetration.

Competitive Landscape
Competitive intensity is moderate. PerkinElmer Inc., Bruker Corporation, FUJIFILM Holdings Corp. (VisualSonics), LI-COR Biosciences, and Miltenyi Biotec B.V. & Co. KG collectively hold a significant combined position, yet specialized entrants claim niche modality share. Incumbents differentiate through AI software, reagent verticals, and cloud ecosystems that together represented 32% of vendor revenue in 2025. PerkinElmer’s real-time bioluminescence tomography patent (US 2024/0234567) aims to extend hardware life cycles through computational upgrades. Bruker’s acquisition of AAT Bioquest secures probe compatibility and doubles the capture of consumables margins.
Mid-tier vendors such as MR Solutions and Mediso focus on geographic expansion; MR Solutions’ Shanghai service hub offers 24-hour on-site coverage to de-risk procurement for Chinese academics. Disruptors like Alpenglow Biosciences pitch USD 120,000 portable fluorescence carts that bypass facility renovation requirements and target CRO overflow capacity. Hybrid optical-ultrasound-photoacoustic systems are emerging as the next competitive frontier, demanding integration expertise that favors well-capitalized players while leaving room for agile innovators with modular architectures.
Service-oriented models proliferate. Vendors now offer reagent subscriptions, per-hour cloud analytics, and pay-per-scan financing that dovetail with CRO budget cycles. Such arrangements smooth revenue and offset the elongating hardware replacement curve in mature territories. Intellectual-property pipelines increasingly feature AI algorithms, deep-learning datasets, and bio-conjugate chemistry rather than purely mechanical advances, signaling a long-term transition toward software-majority value capture within the Optical Preclinical Imaging market.
Optical Preclinical Imaging Industry Leaders
Bruker Corporation
FUJIFILM Holdings Corp. (VisualSonics)
LI-COR Biosciences
Miltenyi Biotec B.V. & Co. KG
PerkinElmer Inc.
- *Disclaimer: Major Players sorted in no particular order

Recent Industry Developments
- September 2025: Revvity released Living Image Synergy AI, integrating cloud-based multimodal analytics across fluorescence, bioluminescence, and photoacoustic scans.
- February 2024: Bruker completed the acquisition of Spectral Instruments Imaging LLC, expanding the BioSpin Preclinical Imaging division with complementary in vivo optical platforms that enhance its disease research toolkit.


Global Optical Preclinical Imaging Market Report Scope
As per the report's scope, optical preclinical imaging refers to non-invasive imaging techniques used in preclinical research to visualize biological processes in living animal models using light-based technologies. It commonly includes fluorescence, bioluminescence, and near-infrared imaging modalities. These systems enable real-time monitoring of disease progression, gene expression, and drug response at the molecular and cellular levels. Optical preclinical imaging is widely used in drug discovery, oncology research, and translational studies due to its high sensitivity and relatively low cost.
The optical preclinical imaging market segmentation includes modality, application, end user, and geography. By modality, the market is segmented into bioluminescence imaging, fluorescence imaging, photoacoustic imaging, cherenkov luminescence imaging, and other modalities. By application, the market is segmented into oncology, cardiovascular disorders, neurology, inflammation & infectious diseases, and other applications. By end user, the market is segmented into pharmaceutical & biotechnology companies, academic & research institutions, contract research organisations (CROs), and hospitals & diagnostic centres.By geography, the global market is segmented into North America, Europe, Asia-Pacific, the Middle East and Africa, and South America. The market report also covers the estimated market sizes and trends for 17 countries across major regions globally. The report offers the value (in USD) for the above segments.
| Bioluminescence Imaging |
| Fluorescence Imaging |
| Photoacoustic Imaging |
| Cherenkov Luminescence Imaging |
| Other Modalities |
| Oncology |
| Cardiovascular Disorders |
| Neurology |
| Inflammation & Infectious Diseases |
| Other Applications |
| Pharmaceutical & Biotechnology Companies |
| Academic & Research Institutions |
| Contract Research Organisations (CROs) |
| Hospitals & Diagnostic Centres |
| North America | United States |
| Canada | |
| Mexico | |
| Europe | Germany |
| United Kingdom | |
| France | |
| Italy | |
| Spain | |
| Rest of Europe | |
| Asia-Pacific | China |
| India | |
| Japan | |
| Australia | |
| South Korea | |
| Rest of Asia-Pacific | |
| Middle East and Africa | GCC |
| South Africa | |
| Rest of Middle East and Africa | |
| South America | Brazil |
| Argentina | |
| Rest of South America |
| By Modality | Bioluminescence Imaging | |
| Fluorescence Imaging | ||
| Photoacoustic Imaging | ||
| Cherenkov Luminescence Imaging | ||
| Other Modalities | ||
| By Application | Oncology | |
| Cardiovascular Disorders | ||
| Neurology | ||
| Inflammation & Infectious Diseases | ||
| Other Applications | ||
| By End User | Pharmaceutical & Biotechnology Companies | |
| Academic & Research Institutions | ||
| Contract Research Organisations (CROs) | ||
| Hospitals & Diagnostic Centres | ||
| By Geography | North America | United States |
| Canada | ||
| Mexico | ||
| Europe | Germany | |
| United Kingdom | ||
| France | ||
| Italy | ||
| Spain | ||
| Rest of Europe | ||
| Asia-Pacific | China | |
| India | ||
| Japan | ||
| Australia | ||
| South Korea | ||
| Rest of Asia-Pacific | ||
| Middle East and Africa | GCC | |
| South Africa | ||
| Rest of Middle East and Africa | ||
| South America | Brazil | |
| Argentina | ||
| Rest of South America | ||


Key Questions Answered in the Report
What is the forecast value of the Optical Preclinical Imaging market in 2031?
It is projected to reach USD 2.11 billion by 2031, growing at a 5.25% CAGR.
Which modality is growing fastest within optical preclinical imaging?
Cherenkov luminescence leads with a 9.25% CAGR, driven by label-free radiopharmaceutical read-outs.
Why are CROs expanding optical imaging capacity?
Mid-tier biotechs favor per-study fees over multimillion-dollar equipment purchases, propelling CRO demand at an 8.55% CAGR.
What regional market is accelerating most rapidly?
Asia-Pacific is advancing at an 8.81% CAGR thanks to sizable Chinese and Indian research infrastructure investments.
How is AI influencing preclinical optical imaging workflows?
Deep-learning reconstruction halves scan time and cuts cohort sizes by 25%, enabling higher throughput and cost savings.
What restrains wider adoption in large-animal studies?
Light-scattering limits quantitative accuracy beyond 5–8 mm, pushing researchers toward nuclear imaging for deep-organ pharmacokinetics.
Page last updated on:


