
Oncology Biosimilars Market Size and Share
Market Overview
| Study Period | 2020 - 2031 |
|---|---|
| Market Size (2026) | USD 12.81 Billion |
| Market Size (2031) | USD 24.96 Billion |
| Growth Rate (2026 - 2031) | 14.25 % |
| Fastest Growing Market | Asia-Pacific |
| Largest Market | North America |
| Market Concentration | Medium |
Major Players *Disclaimer: Major Players sorted in no particular order Image © Mordor Intelligence. Reuse requires attribution under CC BY 4.0. | |
Oncology Biosimilars Market Analysis by Mordor Intelligence
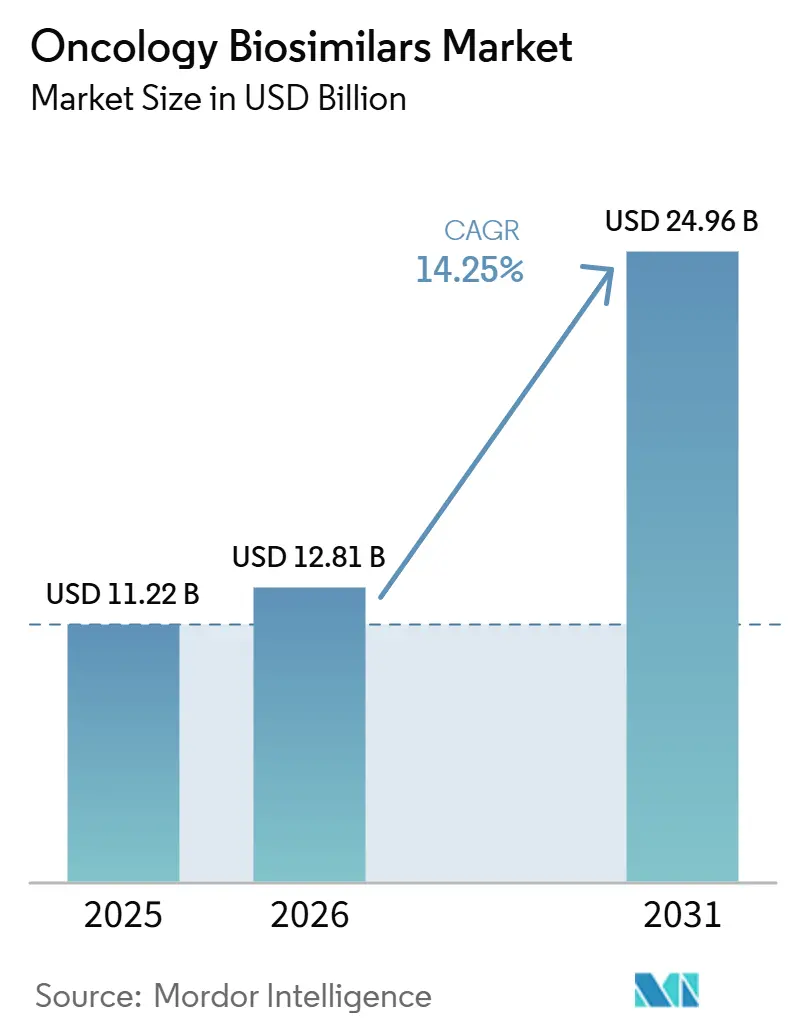
The Oncology Biosimilars Market size was valued at USD 11.22 billion in 2025 and is estimated to grow from USD 12.81 billion in 2026 to reach USD 24.96 billion by 2031, at a CAGR of 14.25% during the forecast period (2026-2031).
The oncology biosimilars market is moving into a broader expansion phase because mature products such as trastuzumab, bevacizumab, and rituximab already have established uptake, while the pipeline is starting to move toward more complex oncology biologics that can widen the future addressable base. Institutional adoption is already strong in major hospital settings, with biosimilar use reaching 93% for bevacizumab, 87% for trastuzumab, and 84% for rituximab across a large U.S. hospital sample by 2024, which shows that switching is no longer limited to isolated pilot programs. Demand is also supported by the rising global cancer burden, with 20.6 million new cancer cases recorded in 2024 and incidence projected to reach 34.4 million by 2050, which keeps the treatment pool for the oncology biosimilars market on a firm upward path.[1] North America continues to anchor current revenue in the oncology biosimilars market, while Asia-Pacific is expanding faster as local manufacturing capacity, pricing pressure, and treatment access needs reshape competitive behavior across large population bases. Competition in the oncology biosimilars market is also becoming more execution driven, as partnerships, regulatory wins, manufacturing scale, and the ability to navigate complex launch pathways now matter as much as molecule selection.
Key Report Takeaways
- By indication, breast cancer led with 28.15% share in 2025, while lung cancer is projected to expand at a 16.75% CAGR through 2031.
- By drug class, monoclonal antibodies held 68.54% share in 2025, while the others category is forecast to grow at an 18.16% CAGR through 2031.
- By route of administration, intravenous delivery accounted for 79.15% share in 2025, while subcutaneous delivery is projected to grow at a 17.45% CAGR through 2031.
- By distribution channel, hospital pharmacies captured 68.11% share in 2025, while other pharmacies are projected to expand at a 16.73% CAGR through 2031.
- By geography, North America held 36.18% share in 2025, while Asia-Pacific is forecast to grow at an 18.05% CAGR through 2031.
Note: Market size and forecast figures in this report are generated using Mordor Intelligence’s proprietary estimation framework, updated with the latest available data and insights as of January 2026.
Market Trends and Insights
Drivers Impact Analysis of Oncology Biosimilars Market*
| Driver | (~) % Impact on CAGR Forecast | Geographic Relevance | Impact Timeline |
|---|---|---|---|
| Expiring Blockbuster Oncology Biologic Patents | +3.6% | Global, with a concentration in North America and Europe | Short term (≤ 2 years) |
| Payer Pressure to Lower Oncology Treatment Costs | +2.9% | North America and Europe, with spillover to the Asia-Pacific | Medium term (2-4 years) |
| Rising Global Cancer Incidence and Treatment Volumes | +2.4% | Global, with the strongest intensity in Asia-Pacific and Middle East and Africa | Long term (≥ 4 years) |
| Hospital and Oncology Group Purchasing Adoption of Biosimilar Contracts | +2.1% | North America and Western Europe | Medium term (2-4 years) |
| Biosimilar Switching and Formulary Expansion in Supportive Care Molecules | +1.3% | North America, EU5, South Korea, and Japan | Medium term (2-4 years) |
| Tender-Based Uptake in Public Cancer Programs | +1.1% | Europe, Asia-Pacific, and South America | Short term (≤ 2 years) |
| Source: Mordor Intelligence | |||
Expiring Blockbuster Oncology Biologic Patents
Patent expiry remains one of the clearest structural supports for the oncology biosimilars market because it opens access to therapies that historically carried some of the highest oncology biologic revenues. The current opportunity is not limited to older monoclonal antibodies, because the next wave increasingly includes complex oncology assets where even a small number of entrants can materially change treatment economics. Samsung Bioepis reported positive preliminary Phase 1 and Phase 3 data in June 2026 for SB27, its proposed biosimilar to pembrolizumab, which shows that the oncology biosimilars market is already moving closer to follow-on competition in a very high-value checkpoint inhibitor category. The April 2026 European Commission approval of POHERDY as the first approved pertuzumab biosimilar in Europe adds another sign that large oncology molecules are entering the next stage of commercialization beyond first-generation biosimilar classes.[2] As more oncology biologics move toward loss of exclusivity, the oncology biosimilars market should see faster portfolio broadening, but the companies that move first will still have an advantage in payer contracting and hospital access. This pattern matters because the oncology biosimilars market is no longer defined only by mature substitutions, but also by who can reach the next launch window with clinical, regulatory, and commercial readiness already in place.
Payer Pressure to Lower Oncology Treatment Costs
Payer pressure is reinforcing growth in the oncology biosimilars market because lower-cost substitution now aligns with both budget control and broader treatment access goals. A 2025 survey of oncology pharmacy practices also found that payer-specified biosimilar selections and reimbursement limits are shaping product choice at the practice level, which confirms that the oncology biosimilars market is increasingly being steered through reimbursement design instead of only physician preference. This pressure helps the oncology biosimilars market because cost savings become more visible to institutions when switching decisions are tied to contracting, preferred products, and portfolio standardization. It also raises the importance of launch sequencing, because companies that secure payer alignment early can convert clinical similarity into routine utilization faster than late entrants can. Over time, this dynamic should keep the oncology biosimilars market on a path where access expansion and pricing discipline continue to reinforce each other.
Rising Global Cancer Incidence and Treatment Volumes
The oncology biosimilars market is also being supported by the basic expansion of the oncology treatment population, which gives biosimilar suppliers a larger clinical base to serve even without major share gains from originators. A 2026 Lancet Oncology study also projected diagnosed global cancer incidence to rise from 13.58 million in 2025 to 19.32 million by 2050, with lung, breast, and prostate cancers remaining among the largest diagnosed volumes, which is especially relevant because several of these settings already use biologics or are likely to attract future biosimilar development.[3] This means the oncology biosimilars market benefits not only from substitution, but also from the arrival of new patients who may enter treatment through lower-cost biologic options from the start. The effect is especially important in price-sensitive health systems, where biosimilar availability can move biologic therapy from limited access to broader routine use. As a result, the oncology biosimilars market has a growth base that combines rising cancer incidence with continued pressure to improve affordability.
Hospital and Oncology Group Purchasing Adoption of Biosimilar Contracts
Hospital procurement remains one of the strongest operating drivers in the oncology biosimilars market because many leading oncology biosimilars are still administered in institutional infusion settings. The same JAMA study showed that hospital adoption in the United States had already become highly advanced for bevacizumab, trastuzumab, and rituximab by 2024, which indicates that institutional systems have become comfortable converting biologic demand into preferred biosimilar purchasing patterns. A 2025 oncology pharmacy survey found that more than 90% of institutions had at least one preferred biosimilar on formulary, although reimbursement constraints still limited access to preferred contract pricing for many respondents, which means procurement discipline is strong but not frictionless. This matters for the oncology biosimilars market because contracting power can consolidate volume quickly once a product becomes the preferred institutional option. It also creates a two-speed pattern, where integrated systems move faster than smaller community settings that face more reimbursement or administrative complexity. The result is that the oncology biosimilars market still has room to deepen inside hospital channels even before every molecule reaches full physician-level comfort.
Restraints Impact Analysis of Oncology Biosimilars Market*
| Restraint | (~) % Impact on CAGR Forecast | Geographic Relevance | Impact Timeline |
|---|---|---|---|
| Oncology Prescriber Caution on Interchangeability and Immunogenicity | -1.8% | Global, with highest sensitivity in Asia-Pacific and South America | Medium term (2-4 years) |
| Complex Clinical Development and Manufacturing Requirements | -1.5% | Global | Long term (≥ 4 years) |
| Patent Litigation and Reference Product Exclusivity Extensions | -1.3% | North America and Europe | Short term (≤ 2 years) |
| Uneven Reimbursement and Pharmacy Substitution Policies Across Countries | -1.0% | Asia-Pacific, Middle East and Africa, and South America | Medium term (2-4 years) |
| Source: Mordor Intelligence | |||
Oncology Prescriber Caution on Interchangeability and Immunogenicity
Prescriber caution remains a real restraint for the oncology biosimilars market because institutional contracting can move product selection faster than individual clinical confidence changes. BioDrugs also reported that 31.4% to 56.8% of Korean oncologists were reluctant to switch patients already established on originator biologics, with the hesitation centered on immunogenicity and continuity concerns rather than broad doubt about efficacy.[4] An Indian clinician survey published in 2025 found that 69.2% believed deviations beyond the standard 80% to 125% bioequivalence margin would affect clinical use, which shows that technical interpretation still influences practical adoption. For the oncology biosimilars market, this means education, real-world evidence, and switching familiarity still matter because clinical hesitation can slow utilization even when products are approved and available. It also means that uptake may continue to be stronger in institution-led pathways than in settings where the final decision still rests mainly on individual physician comfort.
Complex Clinical Development and Manufacturing Requirements
The oncology biosimilars market faces a deeper technical restraint because the next wave of products is more complex than the first generation of monoclonal antibody biosimilars. The AAPS Journal noted in 2026 that even standard monoclonal antibody biosimilarity assessment requires multi-step analytical preparation and tightly controlled degradation testing, which shows how small procedural differences can influence quality interpretation. This complexity becomes more important as developers move toward checkpoint inhibitors and other advanced oncology biologics, where manufacturing precision, comparability packages, and regulatory consistency all become harder to manage at scale. The oncology biosimilars market, therefore, does not expand simply because patents move closer to expiry, because each launch still depends on expensive development work, robust analytics, and reliable commercial production. These requirements can stretch timelines, limit the number of credible entrants, and raise the risk that some opportunities remain underdeveloped even when demand conditions are favorable. In practical terms, the oncology biosimilars market may keep growing quickly. However, the technical threshold means expansion will still favor companies with deep biologics capabilities over firms that only bring pricing ambition.
*Our forecasts treat driver/restraint impacts as directional, not additive. The impact forecasts reflect baseline growth, mix effects, and variable interactions.
Oncology Biosimilars Market Segment Analysis
By Indication:
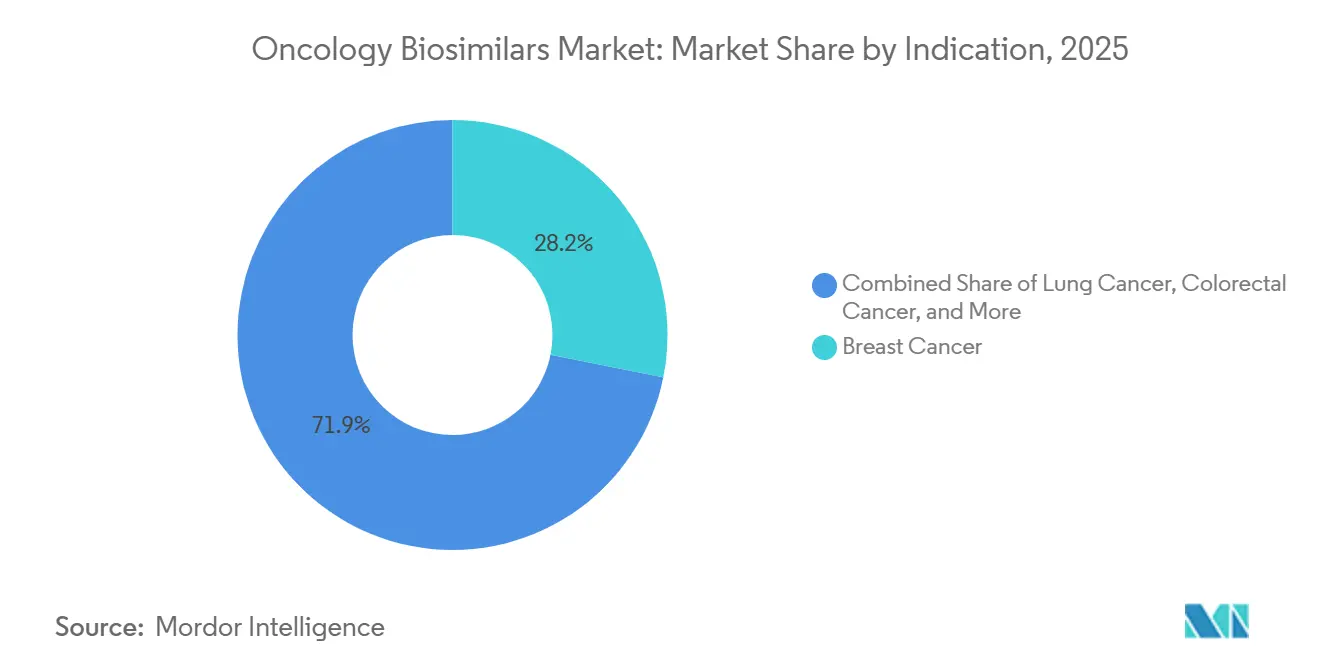
Breast Cancer Anchors Revenue; Lung Cancer Redefines GrowthBreast cancer accounted for 28.15% of the oncology biosimilars market share in 2025, which kept it in the lead because trastuzumab biosimilars are already deeply embedded in HER2-positive treatment pathways. This position reflects both clinical familiarity and commercial maturity, since trastuzumab biosimilars have had enough time to move beyond early adoption and into routine use across major institutional settings. In the United States, the trastuzumab biosimilar category entered 2026 with seven competing products, and Samsung Bioepis reported category shares of 31% for Kanjinti, 25% for Trazimera, and 24% for Ogivri, which shows how dense competition has already become inside this segment of the oncology biosimilars market. Blood cancer also remains a meaningful revenue base because rituximab biosimilars have moved into advanced institutional adoption, with biosimilar use reaching 84% by 2024 in the U.S. hospital sample covered by JAMA. Colorectal cancer adds another important layer because bevacizumab biosimilars already have a validated economic role in metastatic treatment settings.
A 2025 Journal of Medical Economics study found that bevacizumab-bvzr delivered the greatest cost savings and the lowest number needed to convert among biosimilar options in metastatic colorectal cancer, which reinforces why this indication remains commercially relevant to the oncology biosimilars market. Lung cancer is the fastest-growing indication at a 16.75% CAGR, and that outlook is supported by disease burden as well as the future expansion potential of checkpoint inhibitor biosimilars. IARC identified lung cancer as the most incident cancer globally in 2024, with 2.6 million new cases, and also the leading cause of cancer death, which means the patient base behind this part of the oncology biosimilars market is both large and persistent. Ovarian, gastric, and other lower-share indications remain smaller today. However, they still matter because label breadth across bevacizumab-related treatment settings allows the oncology biosimilars industry to extend value across multiple oncology departments without needing a separate commercialization model for each tumor type.

By Drug Class:
Monoclonal Antibodies Dominate; Checkpoint Inhibitor Candidates AccelerateMonoclonal antibodies held 68.54% of the oncology biosimilars market size in 2025, which reflects the strong commercial position of trastuzumab, bevacizumab, and rituximab biosimilars across both solid tumor and hematologic oncology use. Their lead is tied to a combination of mature reference products, well-understood clinical pathways, and the fact that hospitals already know how to contract and administer these therapies at scale. G-CSFs form the second major class because they support chemotherapy-related neutropenia management, and a 2025 oncology pharmacy survey reported weighted average biosimilar utilization of 88% for filgrastim and 52% for pegfilgrastim, which suggests that supportive care still has meaningful conversion room in the oncology biosimilars market.[5] Hematopoietic agents also remain a mature part of demand, with the user draft indicating institutional penetration near 84%, which supports their role as a steady but less dynamic component of the oncology biosimilars market. The current class structure, therefore, still leans heavily toward established molecules, and that makes revenue concentration look stronger at the molecule level than at the company level.
The faster shift is happening in the other category, which is forecast to grow at an 18.16% CAGR through 2031 because it captures future checkpoint inhibitor and VEGF-related biosimilar opportunities. Samsung Bioepis announced positive preliminary Phase 1 and Phase 3 data in June 2026 for SB27, its proposed pembrolizumab biosimilar, including pharmacokinetic equivalence and an equivalent objective response rate in NSCLC at Week 24, which makes this one of the clearest signs that the oncology biosimilars industry is approaching the next commercial frontier. As these assets move closer to filing and launch, the oncology biosimilars market should become less dependent on first-generation monoclonal antibody pricing cycles alone. That shift is important because the next phase of the oncology biosimilars market may be shaped less by how many entrants exist in older classes and more by which firms arrive first in newer, more complex immuno-oncology categories.
By Route of Administration:
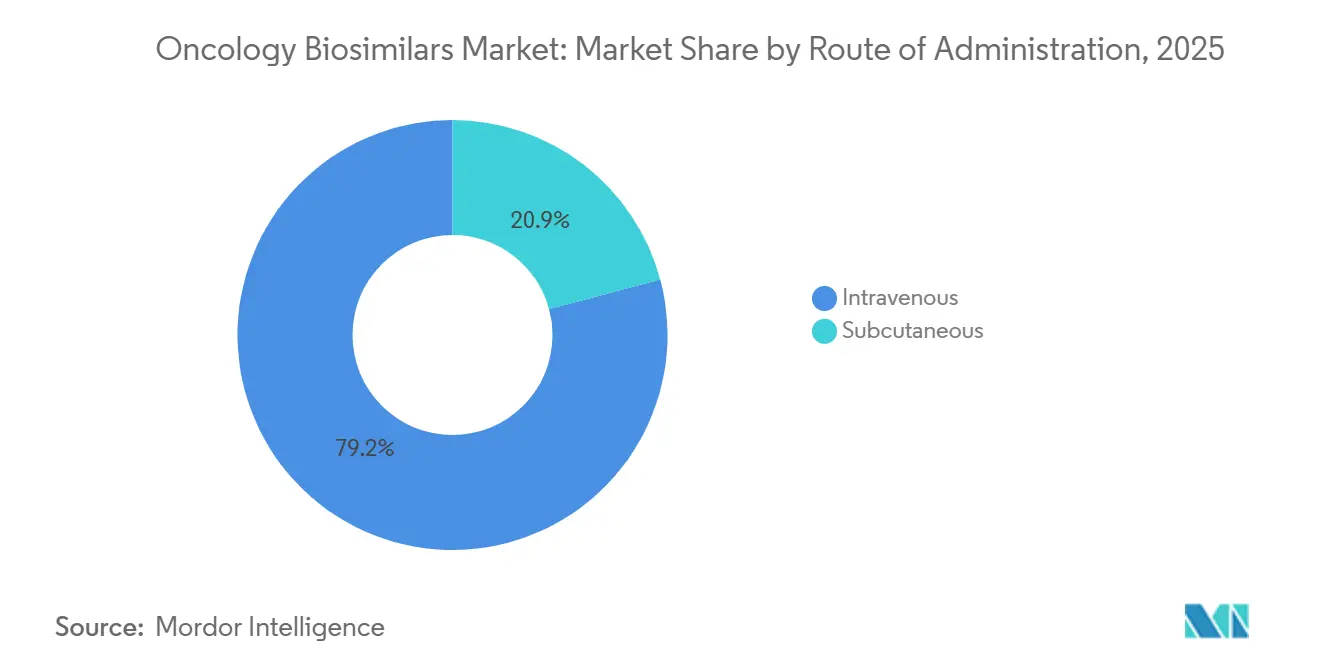
Intravenous Entrenched; Subcutaneous Gaining UrgentlyIntravenous delivery accounted for 79.15% share in 2025, which shows that the oncology biosimilars market still sits firmly inside the hospital infusion model, where physician-administered biologics dominate revenue. This route remains strongest because the most widely used oncology biosimilars today, including trastuzumab, bevacizumab, and rituximab, were built around infusion-based care settings and established reimbursement workflows. The route mix also reflects the fact that institutional procurement is easier to standardize when products move through centralized infusion centers rather than dispersed self-administration settings. That gives intravenous products a structural advantage in the current oncology biosimilars market, especially when hospital systems are trying to align contracting, stocking, and reimbursement through a smaller set of preferred products. It also explains why route concentration remains high even while the broader treatment environment is looking for faster and less resource-intensive administration models.
Subcutaneous delivery is forecast to grow at a 17.45% CAGR through 2031, which makes it the fastest-moving route as providers look for shorter encounters and better patient throughput. The February 2026 approval of Samsung Bioepis denosumab biosimilars helped strengthen confidence in subcutaneous oncology-related biosimilar administration and added momentum to the idea that non-infusion formats can support wider use when the clinical setting allows it. This route should gain from both patient convenience and system efficiency, because shorter administration can relieve pressure on infusion capacity while opening more room for care outside traditional high-intensity settings. Manufacturers are also likely to use device design and administration simplicity as differentiators, which means route competition inside the oncology biosimilars market can increasingly involve service model choices as well as molecule pricing. Over time, the oncology biosimilars industry should see route mix become more balanced, but intravenous delivery is likely to remain the larger base across most of the forecast period.
By Distribution Channel:
Hospital Pharmacies Command Volume; Specialty Channels Demonstrate Faster MomentumHospital pharmacies captured 68.11% of revenue in 2025, which confirms that the oncology biosimilars market still depends most on institution-led dispensing tied to infusion therapy and centralized formulary control. This channel leads because product selection often begins with procurement economics, contract terms, and reimbursement logic rather than with direct consumer choice. A 2025 oncology pharmacy survey stated that formulary decisions in these settings are driven first by acquisition cost and then by reimbursement, which fits the current operating reality of the oncology biosimilars market where hospitals look for predictable savings and operational simplicity. Retail pharmacies play a smaller role because most oncology biosimilars still do not move through routine retail dispensing patterns, although some supportive care products can extend into that channel. Online pharmacy penetration also remains limited because the product mix and care pathways still center more on controlled clinical administration than on broad home distribution.
The faster growth is in the other category, which is projected to expand at a 16.73% CAGR through 2031 as specialty pharmacies, government cancer institutes, and structured patient access programs gain greater relevance. Biocon Biologics partnered with the National Cancer Society of Malaysia in June 2025 to provide biosimilar trastuzumab, pegfilgrastim, and bevacizumab to patients facing treatment delays because of budget constraints, which shows how non-hospital channels can support targeted expansion in the oncology biosimilars market. This channel is gaining because health systems are looking for ways to extend access without building every step around hospital outpatient infusion capacity. It also aligns with the broader shift toward more flexible care delivery, where specialty distribution and public access programs can complement formal institutional purchasing. As a result, the oncology biosimilars market is likely to remain hospital-led, but incremental channel growth should increasingly come from these more specialized and access-oriented pathways.
,
Geography Analysis
North America Oncology Biosimilars Market
North America held 36.18% of the oncology biosimilars market size in 2025, which kept it as the largest regional contributor because hospital adoption, biologics familiarity, and commercialization depth remain strongest there. A JAMA study showed that U.S. hospital biosimilar use had already reached 93% for bevacizumab, 87% for trastuzumab, and 84% for rituximab by 2024, which points to a mature institutional environment for the oncology biosimilars market.[6] This region also continues to benefit from a broad installed base of oncology infusion care, large payers, and sophisticated formulary management, all of which make product switching easier to implement at scale. North America, therefore, remains the most developed revenue base for the oncology biosimilars market, even as newer molecules begin to change the competitive mix.
Europe Oncology Biosimilars Market
Europe remains a core region for the oncology biosimilars market because regulatory acceptance and procurement discipline have historically supported earlier biosimilar normalization than in many other regions. The April 2026 European Commission approval of POHERDY as the first approved pertuzumab biosimilar in Europe marked another important portfolio expansion point for the oncology biosimilars market across the region. The European Medicines Agency also adopted a positive opinion in June 2026 for Denosumab Ascend, recommended as a biosimilar to Xgeva for the prevention of bone complications in adults with advanced cancer involving bone, which adds to future oncology biosimilar breadth in European channels. These steps reinforce Europe’s role as a region where the oncology biosimilars market continues to broaden through both policy familiarity and a steady expansion of available products.
APAC Oncology Biosimilars Market
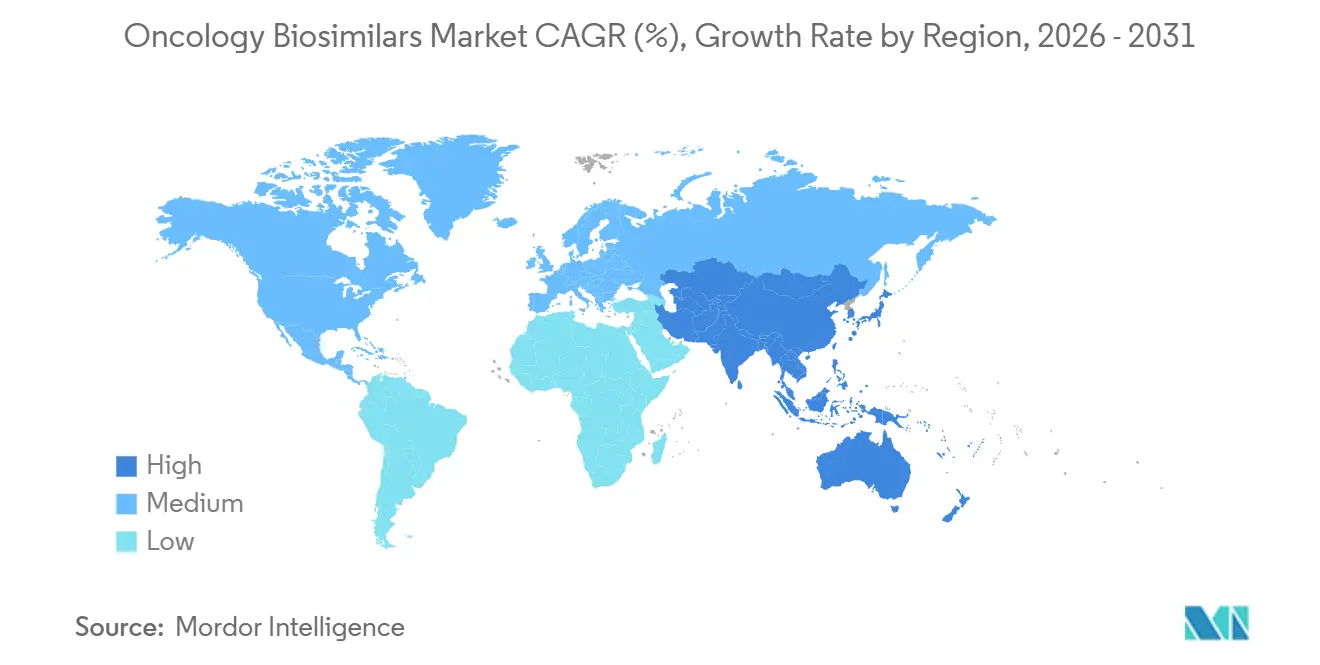
Asia-Pacific is the fastest-growing region at an 18.05% CAGR through 2031, which shows that the oncology biosimilars market has its strongest future momentum in large, cost-sensitive healthcare systems. The regional growth profile reflects rising cancer burden, expanding domestic manufacturing capabilities, and a stronger need to deliver biologic therapy at lower treatment cost across wider patient populations. IARC’s latest global cancer statistics support that backdrop, with cancer incidence continuing to rise worldwide and creating durable demand pressure in high-population regions that need affordable oncology treatment capacity.
Competitive Landscape
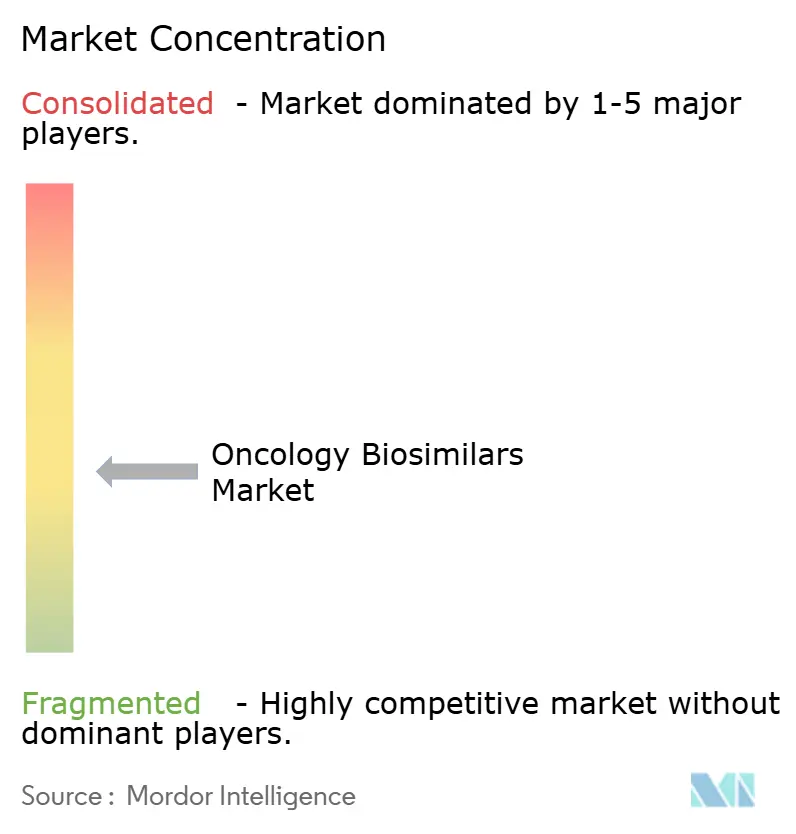
The oncology biosimilars market is moderately concentrated at the company level, even though commercial competition is clustering around a smaller number of high-volume molecules and emerging pipeline assets. No single company controls more than 15% of global revenue in the oncology biosimilars market, which means leadership still depends more on molecule position, contracting depth, and regional reach than on outright global dominance. South Korean developers remain particularly visible because they are pushing next-generation programs while also keeping a presence in established monoclonal antibody categories. Samsung Bioepis strengthened that position in March 2026 by entering a global license, development, and commercialization agreement with Sandoz for up to 5 next-generation biosimilar candidates, which shows how the oncology biosimilars market is increasingly pairing Asian development strength with European market access infrastructure. That kind of partnership structure matters because it reduces launch friction and allows companies to combine manufacturing capability, clinical development, and commercialization coverage without building every piece alone.
The oncology biosimilars market is also becoming more competitive through direct portfolio expansion by established biosimilar players. Biocon Biologics received U.S. FDA approval in April 2025 for Jobevne, its bevacizumab biosimilar, which extended its oncology biosimilar reach beyond OGIVRI and FULPHILA and reinforced its role in hospital-administered oncology categories. Organon and Henlius also widened competitive pressure through POHERDY approvals in both the United States and Europe, which added the first pertuzumab biosimilar entry to a strategically important HER2 treatment area. These moves show that the oncology biosimilars market is no longer defined only by price competition in mature classes, because portfolio timing and the ability to secure first-wave approvals in new molecules are becoming equally important.
The next phase of the oncology biosimilars market will likely reward companies that can prove both scientific depth and commercial discipline across complex launches. Samsung Bioepis’ June 2026 SB27 clinical update suggests that pembrolizumab biosimilar competition is moving closer to a point where the first credible entrants may influence future oncology treatment economics well beyond today’s mature trastuzumab and bevacizumab categories. Teva also added competitive pressure in March 2026 when it received U.S. FDA approval for Ponlimsi as a biosimilar to Prolia and simultaneously advanced its omalizumab biosimilar review, showing that large companies are still widening biologics exposure through regulatory execution. Overall, the oncology biosimilars market remains fragmented. Still, the firms that can combine timely approvals, scalable supply, and a disciplined partnership strategy are likely to shape the next tier of leadership.
Oncology Biosimilars Industry Leaders
-
Amgen Inc.
-
Celltrion, Inc.
-
Pfizer Inc.
-
Samsung Bioepis Co., Ltd.
-
Sandoz Group AG
- *Disclaimer: Major Players sorted in no particular order
Oncology Biosimilars Market Companies Covered in this Report
- Accord Healthcare Limited
- Amgen
- Apotex
- Aurobindo Pharma
- Biocon Biologics Limited
- Celltrion, Inc.
- Cipla
- Dr. Reddy’s Laboratories
- Fresenius
- Gedeon Richter Plc.
- Hetero Labs Limited
- Hikma Pharmaceuticals
- Intas Pharmaceutical
- Mabxience S.L.U.
- Pfizer
- Samsung Bioepis Co., Ltd.
- Sandoz Group AG
- Shanghai Henlius Biotech, Inc.
- Stada Arzneimittel
- Teva Pharmaceutical Industries
Recent Industry Developments in Oncology Biosimilars Market
- June 2026: Samsung Bioepis reported positive preliminary Phase 1 and Phase 3 data for SB27, its proposed Keytruda (pembrolizumab) biosimilar. Phase 1 demonstrated pharmacokinetic equivalence. Phase 3 demonstrated an equivalent objective response rate in NSCLC at Week 24.
- June 2026: The European Medicines Agency CHMP adopted a positive opinion for Denosumab Ascend as a biosimilar to Xgeva, recommended for prevention of bone complications in adults with advanced cancer involving bone.
- April 2026: The European Commission granted marketing authorisation for POHERDY as the first approved pertuzumab biosimilar in Europe, covering all indications of the reference product PERJETA.
- March 2026: Samsung Bioepis entered a global license, development, and commercialisation agreement with Sandoz for up to 5 next-generation biosimilar candidates, including SB36.
- March 2026: Teva Pharmaceutical received FDA approval for Ponlimsi as a biosimilar to Prolia and also had its omalizumab biosimilar candidate accepted for review by both the FDA and EMA.
Global Oncology Biosimilars Market Report Scope
The Oncology Biosimilars Market comprises biologic medicines that are highly similar to approved reference biologics and are used for the treatment and supportive care of various cancers. These products demonstrate no clinically meaningful differences in terms of safety, efficacy, and quality while offering a more cost-effective alternative to originator biologics. The market is driven by the increasing global burden of cancer, patent expirations of blockbuster oncology biologics, favorable regulatory pathways, and growing adoption of biosimilars to improve patient access and reduce healthcare expenditures.
The oncology biosimilars market is segmented by indication, drug class, route of administration, distribution channel, and geography. By indication, it is further divided into breast cancer, lung cancer, colorectal cancer, blood cancer, liver cancer, prostate cancer, gastric cancer, ovarian cancer, and others. By drug class, it is segmented into monoclonal antibodies, granulocyte colony-stimulating factors, hematopoietic agents, and others. By route of administration, the market is segmented into intravenous and subcutaneous. By distribution channel, the market is segmented into hospital pharmacies, retail pharmacies, online pharmacies, and others. The geography segment is further divided into North America, Europe, Asia-Pacific, the Middle East and Africa, and South America. The report also covers the estimated market sizes and trends for 17 countries across major regions globally. The report offers the market size and forecasts in value (USD) for the above segments.
Segmentation Overview
| Breast Cancer |
| Lung Cancer |
| Colorectal Cancer |
| Blood Cancer |
| Liver Cancer |
| Prostate Cancer |
| Gastric Cancer |
| Ovarian Cancer |
| Others (Pancreatic Cancer, Multiple Myeloma, etc.) |
| Monoclonal Antibodies |
| Granulocyte Colony-Stimulating Factors |
| Hematopoietic Agents |
| Others (Immune Checkpoint Inhibitors, VEGF Inhibitors, etc.) |
| Intravenous |
| Subcutaneous |
| Hospital Pharmacies |
| Retail Pharmacies |
| Online Pharmacies |
| Others (Specialty Pharmacies, Government Cancer Institutes, etc.) |
| North America | United States |
| Canada | |
| Mexico | |
| Europe | Germany |
| United Kingdom | |
| France | |
| Italy | |
| Spain | |
| Rest of Europe | |
| Asia-Pacific | China |
| India | |
| Japan | |
| South Korea | |
| Australia | |
| Rest of Asia-Pacific | |
| Middle East and Africa | GCC |
| South Africa | |
| Rest of Middle East and Africa | |
| South America | Brazil |
| Argentina | |
| Rest of South America |
| By Indication | Breast Cancer | |
| Lung Cancer | ||
| Colorectal Cancer | ||
| Blood Cancer | ||
| Liver Cancer | ||
| Prostate Cancer | ||
| Gastric Cancer | ||
| Ovarian Cancer | ||
| Others (Pancreatic Cancer, Multiple Myeloma, etc.) | ||
| By Drug Class | Monoclonal Antibodies | |
| Granulocyte Colony-Stimulating Factors | ||
| Hematopoietic Agents | ||
| Others (Immune Checkpoint Inhibitors, VEGF Inhibitors, etc.) | ||
| By Route of Administration | Intravenous | |
| Subcutaneous | ||
| By Distribution Channel | Hospital Pharmacies | |
| Retail Pharmacies | ||
| Online Pharmacies | ||
| Others (Specialty Pharmacies, Government Cancer Institutes, etc.) | ||
| By Geography | North America | United States |
| Canada | ||
| Mexico | ||
| Europe | Germany | |
| United Kingdom | ||
| France | ||
| Italy | ||
| Spain | ||
| Rest of Europe | ||
| Asia-Pacific | China | |
| India | ||
| Japan | ||
| South Korea | ||
| Australia | ||
| Rest of Asia-Pacific | ||
| Middle East and Africa | GCC | |
| South Africa | ||
| Rest of Middle East and Africa | ||
| South America | Brazil | |
| Argentina | ||
| Rest of South America | ||
Key Questions Answered in the Report
What is the current growth outlook for oncology biosimilars through 2031?
The oncology biosimilars market is projected to rise from USD 12.81 billion in 2026 to USD 24.96 billion by 2031 at a 14.25% CAGR, supported by hospital adoption, payer pressure, and a growing cancer treatment population.
Which indication contributes the most revenue today?
Breast cancer is the leading indication, with 28.15% share in 2025, largely because trastuzumab biosimilars are already well established in HER2-positive treatment pathways.
Which part of the product mix is growing the fastest?
The others drug class is projected to grow at an 18.16% CAGR through 2031, reflecting the commercial potential of future checkpoint inhibitor and related biosimilar launches.
Why does North America remain the largest regional contributor?
North America held 36.18% share in 2025 because hospital biosimilar adoption is already high for bevacizumab, trastuzumab, and rituximab, and the region has deep institutional purchasing capability.
What is the biggest challenge slowing wider adoption?
Prescriber caution remains a meaningful barrier, especially around switching and immunogenicity, even though institutional use is already strong in many hospital systems.
Which distribution channel matters the most right now?
Hospital pharmacies remain the dominant channel with 68.11% share in 2025, while specialty and other structured access channels are growing faster at a 16.73% CAGR.