Market Overview
| Study Period | 2021 - 2031 |
|---|---|
| Forecast Data Period | 2026 - 2031 |
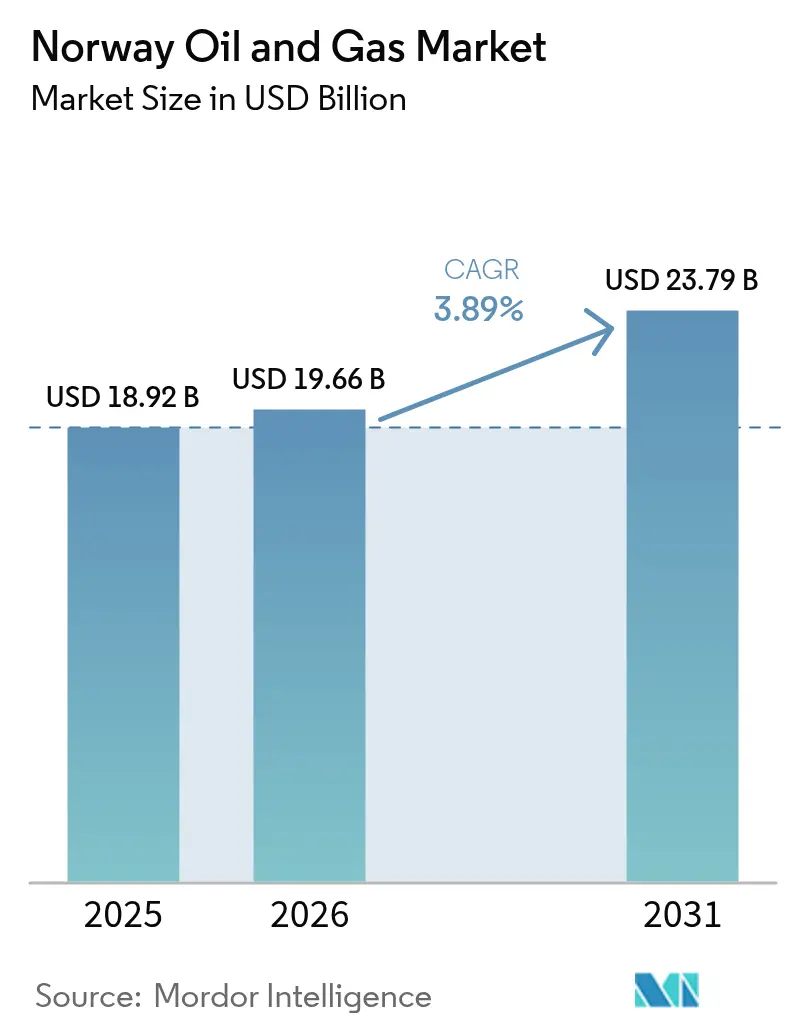
| Base Year Market Size (2025) | USD 18.92 Billion |
| Market Size (2026) | USD 19.66 Billion |
| Market Size (2031) | USD 23.79 Billion |
| Growth Rate (2026 - 2031) | 3.89% CAGR |
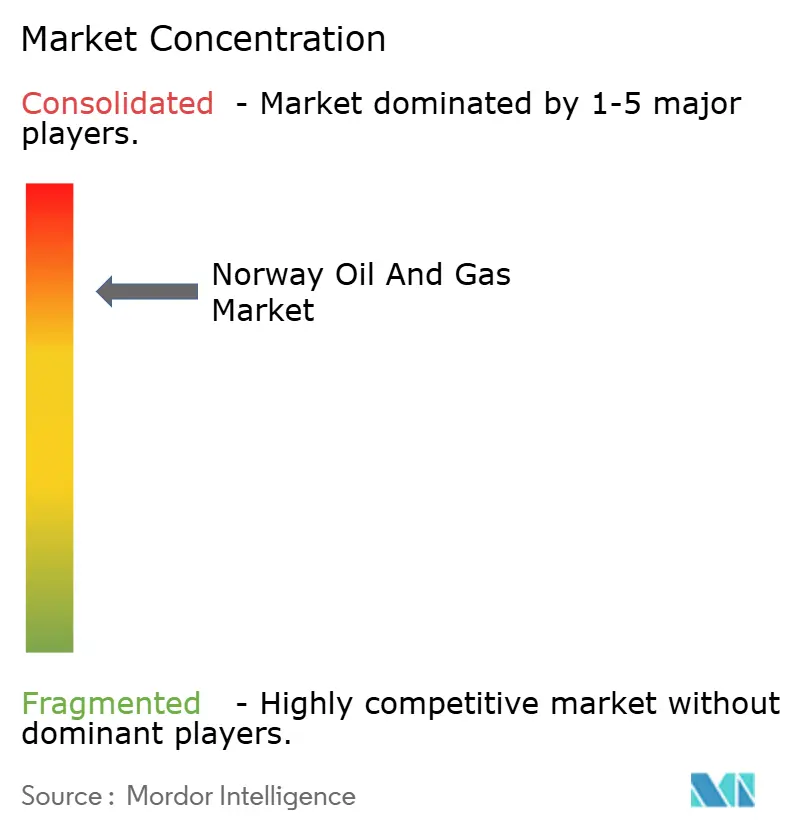
| Market Concentration | High |
Major Players *Disclaimer: Major Players sorted in no particular order Image © Mordor Intelligence. Reuse requires attribution under CC BY 4.0. | |
Norway Oil And Gas Market Analysis by Mordor Intelligence
The Norway Oil And Gas Market size was valued at USD 18.92 billion in 2025 and estimated to grow from USD 19.66 billion in 2026 to reach USD 23.79 billion by 2031, at a CAGR of 3.89% during the forecast period (2026-2031).
Mature offshore infrastructure, steady tax-driven investment flows, and Europe’s post-Ukraine demand have kept the market’s growth trajectory stable. Heightened energy security concerns continue to favor Norwegian gas exports, while downstream decarbonization projects and commercial carbon storage hubs are opening up new revenue streams. On the competitive front, controlled consolidation around Equinor, Aker BP, and Vår Energi is enabling the coordinated development of marginal fields, whereas digital twin rollouts and subsea tie-backs are lowering operating costs. Workforce reskilling and emissions-reduction mandates create cost pressures, but also accelerate the adoption of automation, robotics, and offshore electrification, which together underpin medium-term productivity gains.
Key Report Takeaways
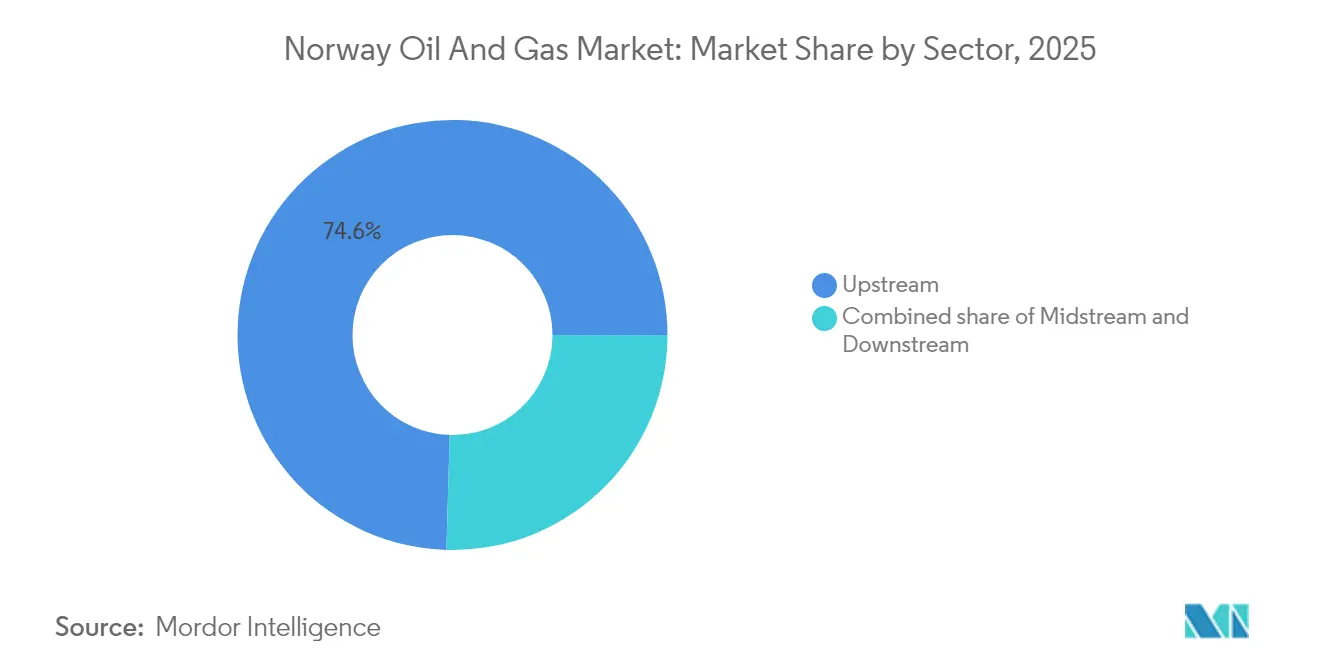
- By sector, upstream operations commanded 74.55% of the Norway oil and gas market share in 2025; downstream operations recorded the highest projected CAGR at 4.70% through 2031.
- By location, offshore assets held 94.62% of revenue in 2025, with a 4.18% CAGR expected to 2031.
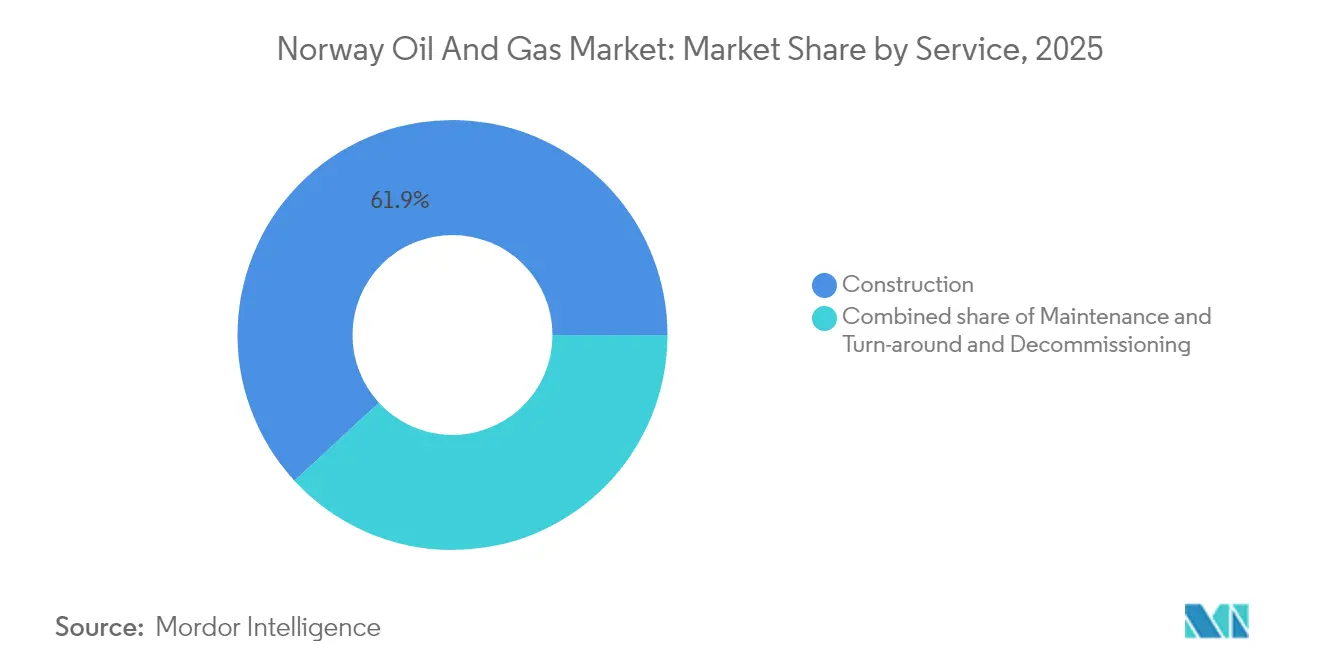
- By service, construction accounted for 61.85% of the Norwegian oil and gas market size in 2025, while maintenance and turn-around is expected to advance at a 4.95% CAGR to 2031.
Note: Market size and forecast figures in this report are generated using Mordor Intelligence’s proprietary estimation framework, updated with the latest available data and insights as of 2026.
Norway Oil And Gas Market Trends and Insights
Drivers Impact Analysis*
| Driver | (~) % Impact on CAGR Forecast | Geographic Relevance | Impact Timeline |
|---|---|---|---|
| Rising European gas demand post-Ukraine crisis | +0.80% | EU, notably Germany | Medium term (2-4 years) |
| Tax incentives for NCS investments | +0.60% | Norwegian Continental Shelf | Short term (≤2 years) |
| Mature offshore infrastructure | +0.40% | North Sea, Norwegian Sea, Barents Sea | Long term (≥4 years) |
| Commercialisation of CO₂ storage hubs | +0.30% | North Sea formations | Medium term (2-4 years) |
| Digital-twin-driven OPEX reduction | +0.20% | Norwegian Continental Shelf | Short term (≤2 years) |
| Sub-sea tie-back optimisation | +0.30% | Marginal fields, NCS | Medium term (2-4 years) |
| Source: Mordor Intelligence | |||
Rising European Gas Demand Post-Ukraine Crisis
Record European gas shortfalls after 2022 led to Norwegian exports reaching historic highs and solidifying Norway's oil and gas market as the continent's primary non-Russian supplier. Germany sourced 48% of its gas from Norway in 2024, significantly widening a structural demand gap that is expected to last until at least 2030. Although EU climate targets indicate a 32% decline in overall gas use by 2030, near-term offtake contracts remain robust, providing Norwegian producers with room to maximize cash flow while preparing for a gradual taper in volumes. The government's emphasis on secure delivery windows and predictable pipeline throughput adds further stability for upstream investors. However, domestic political debates over deeper EU energy alignment occasionally introduce regulatory uncertainty that companies must watch closely.
Tax Incentives for NCS Investments
Norway’s 78% marginal tax rate looks onerous on paper, but when combined with full-cost expensing and accelerated depreciation, it creates compelling after-tax economics for new projects. The temporary relief mechanism introduced in 2020 allowed operators to deduct most capital outlays immediately, spurring a wave of 29 project sanctions that will peak in spending around 2025. Budget revisions released for 2025 preserve these deductions and extend resource-rent provisions to carbon-management ventures, broadening the incentive base.(1)Ministry of Finance, “Norway National Budget 2025,” regjeringen.no Investors, however, expect a natural slowdown once today’s backlog of sanctioned workstreams completes after 2027, unless updated policies again refresh the project pipeline.
Mature Offshore Infrastructure
Over the past five decades, continuous build-out has led to the development of dense networks of platforms, pipelines, and onshore terminals, resulting in average tie-back costs that are up to 30% lower compared to those of greenfield builds. Recent examples include Fram Sør and Bestla, where 10-15 km flowlines link new wells to existing hubs, delivering breakeven prices well below USD 40 per barrel. Shore-power upgrades to Troll B and Troll C are curbing operational emissions by 160,000 tCO₂ each year while extending topside life. These advantages shorten development cycles, preserve capital, and position the Norwegian Continental Shelf as a template for brownfield optimization worldwide.
Commercialisation of CO₂ Storage Hubs
The Northern Lights project achieved operational status in 2025 and now handles cross-border CO₂ shipments, making Norway an early mover in monetizing geological storage. The initial 1.5 Mt/yr capacity is fully booked, and Phase 2 will lift throughput beyond 5 Mt/yr by 2028. Past learnings from Sleipner and Snøhvit’s 22 Mt of cumulative injections reduce technical risk, while a supportive fiscal mix of CO₂ tax credits and state co-investment underwrites commercial viability. This emerging service line partly counterbalances the long-term decline of upstream volumes and could evolve into a leading export sector for subsurface know-how.(2)TotalEnergies, “Northern Lights Milestone Press Release,” totalenergies.com
Restraints Impact Analysis*
| Restraint | (~) % Impact on CAGR Forecast | Geographic Relevance | Impact Timeline |
|---|---|---|---|
| Price volatility (oil & gas) | -0.40% | Global commodity markets affecting Norwegian exports | Short term (≤ 2 years) |
| Net-zero emission compliance costs | -0.30% | Norwegian Continental Shelf operations | Medium term (2-4 years) |
| Skilled-labour shift to renewables | -0.50% | Norwegian Continental Shelf, North Sea region | Medium term (2-4 years) |
| Rising decommissioning liabilities | -0.60% | North Sea mature fields, Norwegian Continental Shelf | Long term (≥ 4 years) |
| Source: Mordor Intelligence | |||
Price Volatility (Oil & Gas)
Fluctuations in crude and gas benchmarks complicate capital-allocation planning for offshore operators whose wellhead breakevens vary between USD 11 and 40 per barrel. Short-term European gas spot prices remain vulnerable to seasonal weather patterns and unplanned platform outages, leading to significant fluctuations in revenue. While the industry’s pipeline of low-cost tie-backs softens the blow, sustained price weakness could delay marginal projects and reduce future reserve additions. Currency shifts add another layer of complexity, with a weaker NOK inflating imported equipment costs even as it lifts export receipts.
Net-Zero Emission Compliance Costs
The industry spent NOK 16 billion in 2024 on CO₂ taxes, EU Emissions Trading allowances, and platform-electrification upgrades.(3)Norwegian Petroleum Directorate, “Emissions from petroleum activities,” norskpetroleum.no Targets to cut offshore emissions 50% by 2030 require high-voltage cable links, on-platform battery systems, and increased use of floating wind power. Projects such as Oseberg’s NOK 10 billion partial electrification highlight the capital intensity involved. Operators face the dual challenge of keeping costs competitive with global peers while meeting some of the strictest environmental regulations worldwide.
*Our forecasts treat driver/restraint impacts as directional, not additive. The impact forecasts reflect baseline growth, mix effects, and variable interactions.
Segment Analysis
By Sector: Extraction Dominance With Emerging Downstream Upside
Upstream activities retained a 74.55% revenue share in 2025, supported by giant fields like Johan Sverdrup, which produced 260 million barrels that year while maintaining a carbon intensity of less than 5 kg CO₂ per barrel. Combined ownership of pipelines and terminals offers cost advantages and underpins the Norway oil and gas market’s integrated value chain. Midstream assets, including Europe’s most extensive offshore gas pipeline grid, were secured with state backing through a USD 1.6 billion acquisition, reinforcing national control over strategic export arteries. Downstream EBITDA has risen on the back of refinery conversions: Mongstad’s shift toward blue hydrogen and sustainable aviation fuels is projected to cut site emissions by 70%, underscoring how value-added processing can outpace traditional refining margins.
The Norway oil and gas market size for the downstream segment is forecast to reach USD 3.34 billion by 2031, expanding at a 4.70% CAGR, the fastest within the sectoral breakdown. Although upstream remains the backbone, blended business models that combine hydrocarbons with low-carbon fuels are redefining profit pools. Consequently, producers are diversifying earnings to hedge against long-term declines in raw hydrocarbon demand.


By Location: Offshore Supremacy and Barents Upside
Offshore installations accounted for 94.62% of 2025 revenues and are forecast to post a 4.18% CAGR to 2031, underscoring how subsea infrastructure dominates the Norway oil and gas market. Recent startups, most notably Johan Castberg, with a capacity of 220,000 barrels per day, underscore the Barents Sea's growing contribution to the region's oil production. Onshore operations remain primarily limited to processing, storage, and emerging renewable-energy hybrids. The locale's harsh Arctic conditions demand robust, winterized FPSOs and subsea concepts; once in place, these units yield long plateau production profiles that stabilize national output.
Offshore electrification is scaling, too. The Hywind Tampen floating wind farm now meets 35% of the electricity needs of five Tampen platforms, reducing annual CO₂ emissions by 200,000 tons. Such hybridization blends traditional hydrocarbons with renewables, reinforcing competitiveness as carbon prices climb.
By Service: Construction Scale Drives Maintenance Innovation
Maintenance and turn-around work is now the fastest-growing service line on the Norwegian Continental Shelf, set to expand at a 4.95% CAGR through 2031. The surge reflects a clear industry pivot: operators are squeezing more value out of existing platforms instead of betting on brand-new builds. For example, shore-power upgrades on Troll C and Troll B call for fresh skills in hybrid-energy upkeep as high-voltage cables replace traditional gas turbines. Added to that are predictive-maintenance dashboards and remote sensors that let crews stretch service intervals, cut offshore headcounts, and lower safety exposure.
Decommissioning continues to grow steadily as aging North Sea installations approach retirement, and the limited fleet of heavy-lift vessels keeps day rates high. Exploration support holds its own; 45 wells are slated for 2025, but spending is increasingly funneled into near-field prospects. Engineering teams, meanwhile, devote more hours to tie-back layouts and carbon-capture hookups than to frontier wildcats.
Construction still rules the revenue charts, claiming 61.85% of 2025 spending thanks to headline projects such as the USD 8 billion Johan Castberg development and Northern Lights Phase 2. Norway’s contractors excel at marrying big-ticket builds with low-carbon technology, a skill set showcased by Aker BP’s rollout of ANYmal X inspection robots, which come pre-integrated into new platforms from day one. Subsea crews are equally busy: the Bestla tie-back’s 13-kilometer flowline to Brage proves how smart routing can avoid the cost of a standalone installation. Increasingly, clients want one partner to design, construct, and maintain a field throughout its life, turning integrated delivery into the new standard for offshore service contracts.
Geography Analysis
Production on the North Sea shelf still contributes the lion’s share of national output thanks to its dense network of processing platforms and multiple gas-export pipelines connecting directly to continental landing points. The Norwegian Sea follows with incremental volumes sourced from tie-backs to the Åsgard and Njord hubs, while the Barents Sea is evolving from a frontier province to a significant growth engine after the Johan Castberg startup. In total, the Norway oil and gas market produced 233.2 million Sm³ o.e. in 2024 across these three regions.
The North Sea benefits from low unit costs, partly because decades of investment have resulted in heavy infrastructure, allowing cash-generative extension projects, such as Fram Sør, to proceed at moderate prices. The Norwegian Sea’s layered geology supports gas-condensate plays that seamlessly integrate into the existing export network, maintaining competitive tariff levels. Barents Sea developments, though capital-intensive, unlock new high-quality resources and reinforce Norway’s long-term supply role to Europe.
Integrated power solutions set Norway apart. Shore-power cables to Troll B, Troll C, and Sleipner East trim emissions and ready the basin for strict EU carbon rules. Floating wind concepts tested at Hywind Tampen are now being assessed for Barents Sea platforms, combining high-capacity factors with reduced logistic-support costs. Such innovations make the Norway oil and gas market a bellwether for low-carbon offshore operations.
Overall, regional diversification within national waters balances geological risk, sustains pipeline throughput, and aligns with the government’s commitment to keep production near current levels through at least 2035 without breaching emissions targets. This approach safeguards fiscal revenues and maintains Norway’s reputation as a dependable supplier to a transforming European energy system.
Regulatory Landscape
Norway regulates petroleum activities on the Norwegian Continental Shelf (NCS) under the Petroleum Act (1996), with the Ministry of Energy responsible for overall policy and licensing, the Norwegian Offshore Directorate (Sokkeldirektoratet) managing resource and technical regulation, and the Petroleum Safety Authority Norway (Havtil) overseeing safety and working environment requirements. The annual Awards in Pre-defined Areas (APA) licensing system anchors predictability in mature acreage, and the Ministry of Energy awarded 57 production licenses in the APA 2025 round (announced in January 2026) across the North Sea, Norwegian Sea, and Barents Sea.
Operational approvals and compliance obligations span the full field lifecycle, including consent requirements for start-up and ongoing HSE performance under Havtils regulations. Alongside licensing continuity, fiscal and policy signals in the 2025 national budget framework preserved investment incentives that also extend to carbon-management activities, strengthening the link between hydrocarbon production, electrification, and CO2 storage developments already active on the NCS (including Northern Lights, operational in 2025).
Competitive Landscape
The Norway oil and gas market features 27 E&P companies, 20 of which hold operatorship roles. Equinor dominates with around 70% of total production and operates critical infrastructure, including the Kårstø processing plant and key gas-export pipelines to the UK and continental Europe. Aker BP follows as the leading independent, leveraging efficiency-focused partnerships to develop marginal fields quickly. Vår Energi vaulted into the top tier after acquiring Neptune Energy’s Norwegian assets, adding both scale and a robust inventory of near-term tie-back projects.
Strategic M&A over 2024–2025 concentrated acreage in fewer hands without stifling innovation. DNO’s purchase of Sval Energi secured contiguous North Sea acreage that can be developed under a unified facilities plan, lowering per-barrel costs. Meanwhile, service-sector alliances such as Subsea 7, in partnership with SLB OneSubsea, provide integrated EPCI packages that accelerate time-to-first-oil for smaller operators.
Digitalization differentiates leaders. Equinor’s field-wide digital-twin framework has already reduced OPEX by double-digit percentages. Aker BP is piloting autonomous inspection robots, setting the stage for unmanned platforms by 2029. Carbon-capture chains introduce a new competitive dimension: Northern Lights’ open-access transport and storage model provides early entrants with revenue streams unrelated to commodity prices, thereby de-risking future cash flows.
Collectively, the top five producers account for roughly 80% of national output, indicating a moderately high concentration that balances scale efficiency with active competition for exploration acreage.
Norway Oil And Gas Industry Leaders
Shell PLC
Exxon Mobil Corporation
Equinor ASA
TotalEnergies SE
Aker BP ASA
- *Disclaimer: Major Players sorted in no particular order

Market Opportunities and Future Outlook
Near-field exploration and fast-cycle subsea tie-backs to existing hubs remain the clearest whitespace on the NCS, since they can convert smaller discoveries into commercial developments without new standalone platforms. This shows up in the 2026 project pipeline and concept maturation steps, including Equinors Ringvei Vest subsea concept tied to Troll B (eight discoveries) and the maturation of Johan Sverdrup phase 4 as a new subsea development using Tonjer and Geitungen volumes. Together, these initiatives support opportunities for subsea EPCi, construction, and life-extension services that fit Norways brownfield optimization model.
A second opportunity set centers on production continuity and emissions compliance, particularly electrification, power-from-shore, and digital operations that reduce operating emissions and cost per barrel on mature assets. The market is also building a carbon-management service line, with Northern Lights operating at 1.5 Mt CO2 per year from 2025 and Phase 2 expansion plans lifting throughput beyond 5 Mt per year by 2028, which creates demand for CO2 transport and storage value chains alongside traditional oil and gas services. Policy continuity through APA licensing (APA 2026 announced in May 2026) and public funding mechanisms, including the Research Council of Norways 2026 PETROSENTER call focused on low-emission solutions and improved recovery, add support to investment pathways for incremental production and decarbonization-linked upgrades.
Recent Industry Developments
- July 2026: Equinor awarded contracts worth around NOK 6 billion for four development projects on the Norwegian continental shelf. The awards concentrate work into a coordinated subsea and project-delivery pipeline, supporting faster execution and cost reductions for tie-back heavy developments.
- June 2026: Equinor submitted the environmental impact assessment programme for the Wisting development in the Barents Sea for public consultation. Advancing the EIA process de-risks the regulatory path toward concept selection and investment decisions and signals continued commitment to Arctic-capable project maturation within Norways offshore portfolio.
- May 2025: Equinor brought the Johan Castberg oil field in the Barents Sea into production. The start-up adds a new production center in the north and expands demand for Arctic logistics, FPSO-linked services, and subsea support across the Barents Sea supply chain.


Research Methodology Framework and Report Scope
Market Definition and Coverage
For this methodology, the Norway oil and gas market is defined as the value of activities that enable hydrocarbons to be produced, transported, processed, and supported within Norway, including related field and facility services tied to oil and gas assets.
Scope exclusions: Purely renewable power assets and non-oil-and-gas industrial utilities are excluded, and we do not count unrelated construction work that is not linked to oil and gas facilities.
Segmentation Overview
- By Sector
- Upstream
- Midstream
- Downstream
- By Location
- Onshore
- Offshore
- By Service
- Construction
- Maintenance and Turn-around
- Decommissioning
Data Sources, Market Sizing, and Validation
Desk Research
Desk research was used to set the boundary of what gets counted in Norway and to anchor the model to real activity signals that are published consistently each year. We relied on public data such as the Norwegian Petroleum Directorate (field production, discoveries, and planned developments), Statistics Norway (industry turnover and price indices), and the Norwegian Offshore Directorate materials where relevant.
To keep the model grounded in trade and operating reality, we also reviewed energy-balance and cross-check sources such as the International Energy Agency, OPEC, and Eurostat, along with company annual reports, investor presentations, and official project announcements. Patent databases and reputable technical journals were referenced selectively to understand technology shifts that can change unit costs or project mix over time. We also used a paid subscription for company financials and news to speed up verification of timelines and reported spend signals. These examples are not exhaustive, and many other public and curated sources were used during data collection, validation, and clarification.
Primary Interviews and Surveys
Primary work focused on validating how the Norway market is actually priced and executed across offshore and onshore assets, and confirming which activities sit inside typical oil and gas budgets versus adjacent energy work. We spoke with a mix of operators, service contractors, engineering teams, and supply chain stakeholders across Norway, and then used their inputs to confirm utilization, project timing, and realistic pricing progression assumptions for the forecast.
Distribution of primary research fieldwork respondents
| Company type | Respondent position | Region |
|---|---|---|
| Top tier: 39% | CXOs: 15% | APAC: 44% |
| Mid tier: 46% | Functional/Unit leaders: 33% | EMEA: 35% |
| Smaller Players: 15% | Managers: 52% | Americas: 21% |
Market-Sizing & Forecasting
Sizing was built using a top-down and bottom-up approach, where the top-down view reconstructs spend from Norway activity indicators and then the totals are checked against selective supplier and project math. In practice, we tied the market to observable drivers such as Norwegian Continental Shelf production levels, sanctioned field development plans (including timelines), the count and scale of offshore projects, and the split of activity across upstream, midstream, and downstream needs.
A few inputs that mattered in the model were offshore versus onshore mix, maintenance and turn-around cycles, decommissioning intensity, and price movements that affect service rates and project budgets. Where public series were not detailed enough, the gap was handled through structured assumptions that were reviewed with interviewees and then stress-tested so no single assumption could swing the total without being noticed.
For forecasting, scenario analysis was used with a base case that reflects the most common expectations shared by industry participants, followed by tighter and looser cases around project slippage and cost inflation. The forecast was then adjusted only after the sampled unit economics checks (for example, typical project scope times reasonable pricing ranges) remained consistent with the macro activity path.
Data Validation & Update Cycle
Validation happens in several steps so the final totals are not dependent on one data stream or one analyst view. We compare outputs against independent signals like production trends, announced project pipelines, and broad cost indicators, and then investigate any large year-to-year jumps before internal sign-off.
If an assumption creates a mismatch across more than one check, the team re-contacts relevant experts and revisits the input, and the model is re-run to confirm the change behaves logically across the historical years as well. Reports are refreshed annually, with interim updates when material events occur, and a final pre-delivery review is completed so clients receive the latest updated view.
Mordor Intelligence's Norway Oil and Gas Market Size Versus Other Published Estimates
Published market sizes for Norway oil and gas can look far apart, even when the topic name seems the same, because the counted value chain is not always identical and the pricing basis can shift the final number. In our checks, the biggest differences usually come from whether a source is measuring asset-level industry value, company revenue in Norway, or the spend tied to oil and gas projects and services.
By tracking service spend linked to upstream, midstream, and downstream activity and refreshing key pricing and project-timing assumptions, Mordor Intelligence keeps the total focused on Norway-based oil and gas work rather than folding in broader energy consumption value or unrelated downstream retail margins.
Benchmark comparison
| Source | Market Size | Gaps in Research Methodology |
|---|---|---|
| Mordor Intelligence | USD 18.92 B (2025) | |
| Global Research Publisher A | USD 70.20 B (2024) | This estimate appears to lean toward a broader industry value view for Norway and can capture a wider set of value pools through type, application, and sector lenses, which can inflate totals versus a spend-tied market boundary. |
| Trade Data Compilation B | USD 27.05 B (2022) | This value is closer to an extraction-focused market value series and can be heavily influenced by price cycles in a given year, which may understate midstream, downstream, and service activity that continues even when commodity prices normalize. |
The spread across sources is mainly explained by what is being valued, and which years and price conventions are being applied. A practical way to interpret the table is to align the estimate with the decision you are making, since investment planning usually needs activity and service spend signals, while macro industry profiles often reflect a wider value pool.


Key Questions Answered in the Report
What is the current value of the Norway oil and gas market?
The market is valued at USD 19.66 billion in 2026 and is forecast to reach USD 23.79 billion by 2031.
Which segment is growing fastest in the Norway oil and gas market?
Maintenance and turn-around of assets post the quickest expansion, with a 4.95% CAGR projected through 2031.
How dominant are offshore operations in Norway?
Offshore installations represent 94.62% of 2025 revenues and are expected to sustain a 4.18% CAGR.
What role does carbon capture play in Norway’s energy sector?
Commercial storage hubs such as Northern Lights now operate at 1.5 Mt CO₂/yr, with expansion to over 5 Mt by 2028, creating a new income stream for operators.
Who leads the competitive landscape?
Equinor commands roughly 70% of the country’s production, supported by Aker BP and Vår Energi as the chief independents.
How are emissions regulations affecting investment?
Operators incurred NOK 16 billion in compliance costs during 2024, driving electrification and digital-efficiency programs that raise near-term capex but lower lifetime emissions.
Page last updated on:


