Market Overview
| Study Period | 2020 - 2031 |
|---|---|
| Forecast Data Period | 2026 - 2031 |
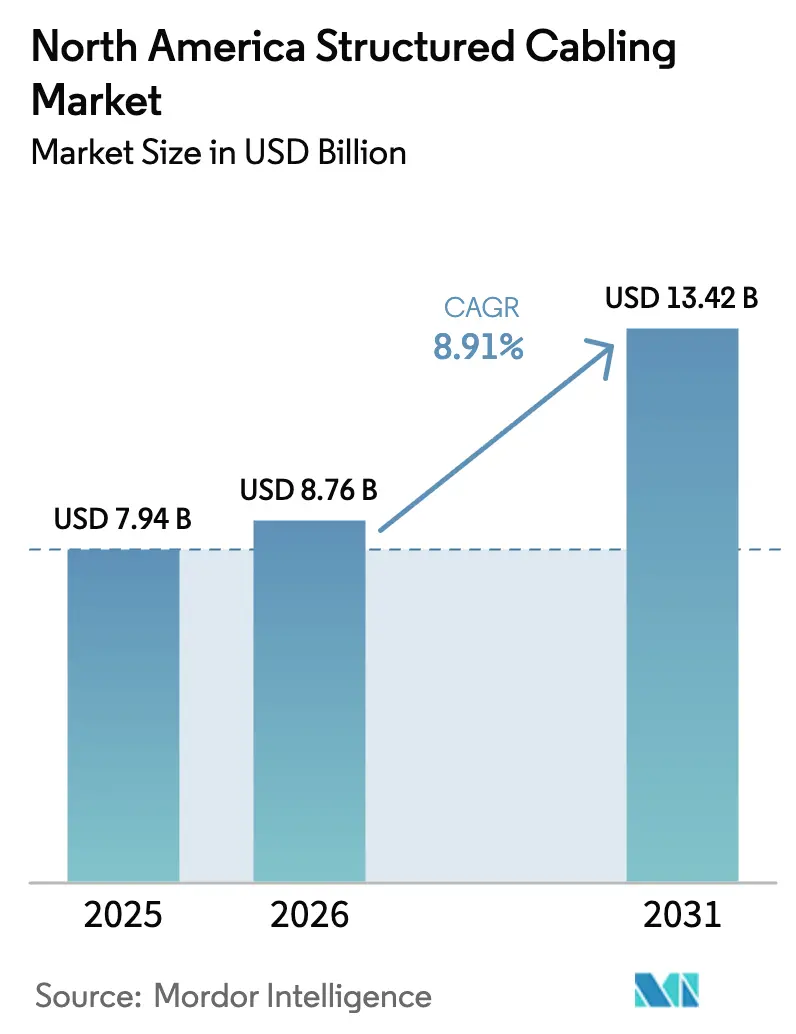
| Base Year Market Size (2025) | USD 7.94 Billion |
| Market Size (2026) | USD 8.76 Billion |
| Market Size (2031) | USD 13.42 Billion |
| Growth Rate (2026 - 2031) | 8.91% CAGR |
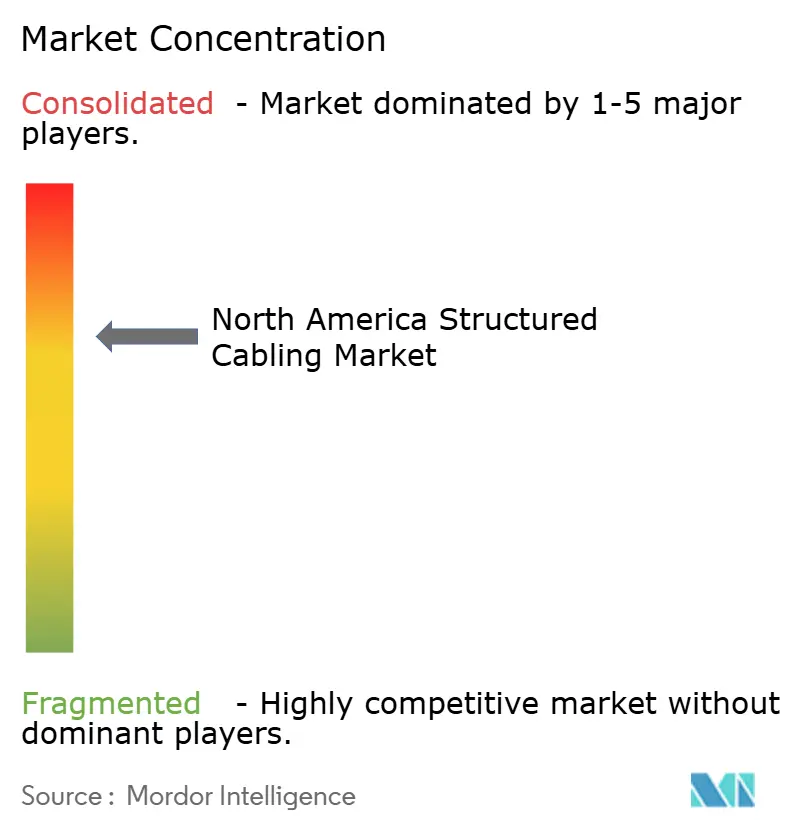
| Market Concentration | Medium |
Major Players *Disclaimer: Major Players sorted in no particular order Image © Mordor Intelligence. Reuse requires attribution under CC BY 4.0. | |
North America Structured Cabling Market Analysis by Mordor Intelligence
The North America structured cabling market size is expected to increase from USD 7.94 billion in 2025 to USD 8.76 billion in 2026 and reach USD 13.42 billion by 2031, growing at a CAGR of 8.91% over 2026-2031. Robust hyperscale data-center construction, accelerated rural fiber programs, and ongoing migration to higher-bandwidth media are expanding cable volumes despite volatility in raw materials. Federal and state incentives, including pole-access reforms and the USD 42.45 billion Broadband Equity, Access, and Deployment allocation, are shortening deployment timelines and widening geographic participation. Parallel investments in 400-gigabit and 800-gigabit Ethernet backbones are shifting demand toward single-mode fiber, while Category 6A copper maintains its hold on horizontal runs, thanks to its 100-meter reach and PoE support. Competition is intensifying as cable makers navigate copper-price swings, edge-facility fragmentation, and a persistent shortage of BICSI-certified installers, factors that elevate the value of pre-terminated assemblies and turnkey service models.
Key Report Takeaways
- By product type, copper systems held a 58.13% share of the North America structured cabling market size in 2025, while fiber solutions are growing at a 9.37% CAGR through 2031.
- By cable category, Category 6 captured 33.89% of 2025 revenue, while Category 6A is forecast to rise fastest at a 9.89% CAGR to 2031.
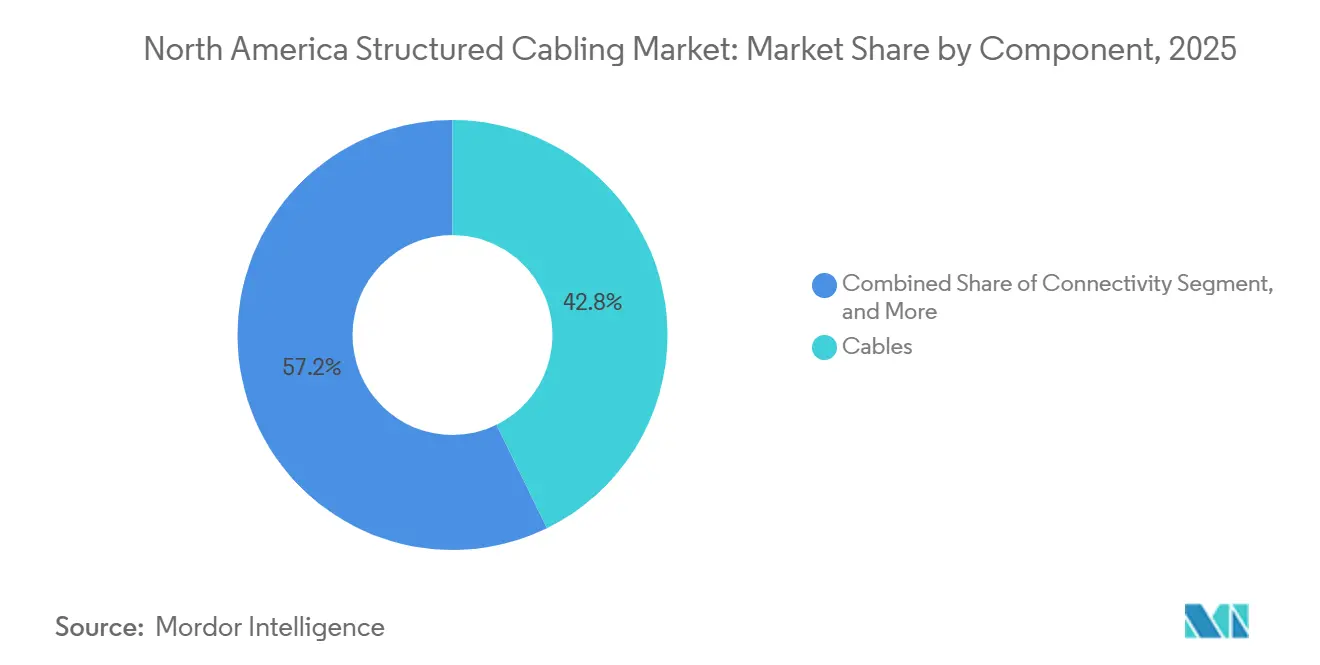
- By component, cables accounted for 42.76% of sales in 2025, whereas connectivity is pacing the field at 9.93% CAGR over the forecast horizon.
- By application, data center deployments captured 56.72% share of the North America structured cabling market size in 2025 and are advancing at a 9.31% CAGR through 2031.
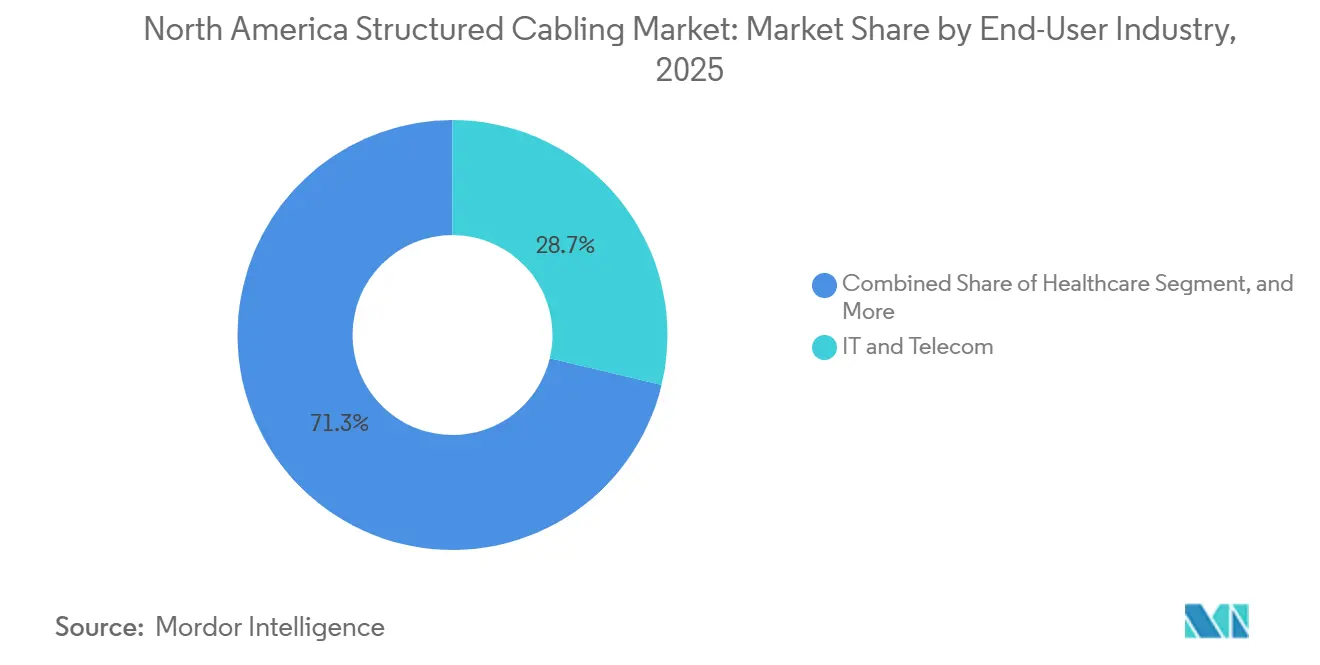
- By end-user industry, IT and telecom led with 28.73% share in 2025, but healthcare is on track for the fastest 10.11% CAGR to 2031.
- By installation type, new construction projects accounted for 63.91% of activity in 2025 and are projected to grow at a 9.33% CAGR over the outlook period.
- By geography, the United States dominated with 79.91% of regional revenue in 2025, while Mexico is forecast to deliver the highest 9.56% CAGR through 2031.
Note: Market size and forecast figures in this report are generated using Mordor Intelligence’s proprietary estimation framework, updated with the latest available data and insights as of January 2026.
North America Structured Cabling Market Trends and Insights
Drivers Impact Analysis*
| Driver | (~) % Impact on CAGR Forecast | Geographic Relevance | Impact Timeline |
|---|---|---|---|
| Growing Expansion of Hyperscale Data Centers | +1.8% | United States (primary), Canada (secondary) | Medium term (2-4 years) |
| Migration to Higher Bandwidth Category Cables | +1.5% | United States, Canada, Mexico | Medium term (2-4 years) |
| Increasing Fiber-To-The-Home and 5G Backhaul Deployments | +1.3% | United States (rural focus), Canada | Long term (≥4 years) |
| Rising Adoption of Power over Ethernet for Smart Building Applications | +1.1% | United States (urban cores), Canada | Short term (≤2 years) |
| Edge Data Center Proliferation in Tier-2 Cities | +0.9% | United States (secondary markets), Mexico | Medium term (2-4 years) |
| Federal Infrastructure Funding Incentives for Rural Broadband Cabling | +1.2% | United States (rural), Canada (remote) | Long term (≥4 years) |
| Source: Mordor Intelligence | |||
Growing Expansion of Hyperscale Data Centers
Hyperscale operators continue to commission gigawatt-scale campuses, adding 7.8 gigawatts of power under construction across the Americas by mid-2025.[1]JLL, “Data Center Outlook Mid-Year 2025,” jll.com Amazon’s USD 15 billion Indiana complex and Microsoft’s USD 4 billion Wisconsin build illustrate the capital intensity behind every new megawatt, each pulling 3-5 kilometers of fiber trunk and 10-15 kilometers of copper cabling for top-of-rack links. The United States hosts 54% of global hyperscale capacity, anchoring regional cable demand. TIA-942-B certification, which prescribes dual pathways and N+1 cable management, elevates per-square-foot spending yet future-proofs plants for 800-gigabit upgrades. AI-optimized designs, such as the USD 7 billion OpenAI-Oracle facility in Michigan, require low-latency spine-leaf topologies that further increase fiber density.
Migration to Higher Bandwidth Category Cables
Category 6A accounted for 41% of United States copper sales in 2025, a four-point gain over 2023, as enterprises targeted 10-gigabit Ethernet to avoid the 30-meter ceiling of Category 8.[2]Panduit, “Copper Cabling Systems and Solutions,” panduit.com The IEEE 802.3df roadmap toward 800-gigabit Ethernet accelerates single-mode adoption in data-center spines, yet copper remains entrenched in horizontals due to RJ45 familiarity and mechanical durability. Anticipated ANSI/TIA-568 updates may introduce Category 6B, stretching 10-gigabit reach to 150 meters and extending copper’s relevance in campus backbones. Wi-Fi 6E and Wi-Fi 7 upgrades, which need 2.5-gigabit uplinks, are prompting retrofits of legacy Category 5e drops in hospitality and education, converting dormant runs into revenue opportunities. These factors collectively add 1.5 percentage points to the regional CAGR.
Increasing Fiber-To-The-Home and 5G Backhaul Deployments
AT&T’s target of 50 million fiber-to-premises passings by 2029 implies an annual drawdown of 1.5 million fiber-kilometers.[3]AT&T, “AT&T Fiber Expansion Plans,” att.com The FCC’s 30-day pole-attachment mandate slashed a prior 90-day window, enabling faster aerial drops in underserved tracts. OECD figures show North American 5G subscriptions rising 28% year over year, and each macro cell consumes 2-4 fibers for fronthaul and midhaul links. BEAD allocations reinforce single-mode architectures in rural corridors where gigabit-ready symmetrical speeds are obligatory. While labor accounts for most of last-mile costs, automation in glass preform pulling is driving per-kilometer fiber prices down by 5% annually, boosting payback economics.
Rising Adoption of Power over Ethernet for Smart Building Applications
IEEE 802.3bt permits 90-watt delivery over Category 6A, eliminating the need for separate electrical runs for LED lighting, cameras, and digital signage. Deloitte’s 2025 survey found that 62% of real estate owners are budgeting PoE deployments within 2 years, forecasting total-cost-of-ownership savings of nearly 30%. NREL recorded 15% reductions in building energy use when luminaires were controlled centrally via PoE switches. Integrators now bundle cabling, switching, and analytics platforms, turning one-time fit-outs into recurring monitoring revenue. Category 6A’s low DC resistance underpins this momentum, cementing copper as the medium of choice for PoE lighting retrofits.
Restraints Impact Analysis*
| Restraint | (~) % Impact on CAGR Forecast | Geographic Relevance | Impact Timeline |
|---|---|---|---|
| Rising Demand for High-Performance Wireless Solutions | -0.7% | United States, Canada | Short term (≤2 years) |
| Complex and Costly Installation in Brownfield Retrofits | -0.5% | United States (urban cores), Canada | Medium term (2-4 years) |
| Supply Chain Volatility of Copper and Optical Fiber Raw Materials | -0.6% | North America (broad) | Short term (≤2 years) |
| Skilled Labor Shortage in Certified Cabling Installers | -0.8% | United States, Canada, Mexico | Medium term (2-4 years) |
| Source: Mordor Intelligence | |||
Rising Demand for High-Performance Wireless Solutions
Wi-Fi 6E and Wi-Fi 7 close the throughput gap between wired and wireless networks, prompting some enterprises to scale back on horizontal cable counts in favor of dense access-point grids. Although each AP still requires dual Category 6A uplinks for redundancy, the switch from 48-port to 24-port topologies cuts total port density, trimming cable volumes by up to 40%. FCC authorization of the 6 GHz band in 2024 accelerated refresh cycles, and Deloitte expects 40% of pre-2023 wireless estates to be swapped by 2027. While structured cabling retains an anchor role for backhaul, the flexibility and lower upfront cost of wireless-first layouts subtract 0.7 percentage points from forecast CAGR.
Complex and Costly Installation in Brownfield Retrofits
Occupied buildings drive labor premiums due to asbestos abatement, night-shift work, and congested pathways that lack TIA-569-compliant trays. Fire-stop penetrations add USD 50-150 per floor transition, and Category 6A’s larger diameter worsens fill ratios, doubling retrofit costs relative to greenfield installs. Coordination with legacy HVAC, security, and telephony networks adds 10-15% to project timelines. These challenges shave 0.5 percentage points off regional CAGR despite the necessity of retrofitting the aging urban stock.
*Our forecasts treat driver/restraint impacts as directional, not additive. The impact forecasts reflect baseline growth, mix effects, and variable interactions.
Segment Analysis
By Product Type: Fiber Gains as Hyperscale Spine Demands Escalate
Copper solutions maintained 58.13% of the North America structured cabling market share in 2025, underscoring their dominance in horizontal links, where Power over Ethernet is paramount. However, fiber revenue is growing 9.37% annually as 400-gigabit and 800-gigabit spines demand single-mode reach beyond 100 meters. Copper margins are under pressure from USD 9,513-per-ton pricing in Q2 2025, which accelerated fiber substitution in rural programs sensitive to material swings.
Multi-mode OM4 and OM5 sustain shorter inter-rack runs, yet operators are pre-cabling with hybrid trunks that accommodate coherent optics upgrades. Fiber’s falling cost curve, paired with lower attenuation, tilts long-haul economics decisively in its favor. Copper’s chief insulation remains its DC power capability, vital for PoE lighting and industrial Ethernet, where a single medium must carry both data and 90 watts of power.


By Cable Category: Category 6 Dominates While Category 8 Stalls
Category 6 cables accounted for 33.89% of revenue in 2025, yet Category 6A is growing at a 9.89% CAGR on the back of 10-gigabit standardization over 100 meters. United States sales share reached 41% in 2025, a clear pivot from Category 5e’s historical dominance. Category 8 remains confined below 5% share because its 30-meter ceiling restricts reach to switch-to-server hops, and its 40-60% price premium erodes return on investment versus fiber.
Anticipated Category 6B specifications extending 10-gigabit to 150 meters could entrench copper even deeper into campus backbones, slowing any rebound for Category 7, whose non-RJ45 connectors and lack of TIA endorsement limit acceptance. BSRIA surveys showed Category 6A global installations rising 12% in 2024, the strongest among copper classes, as building owners avoid stranded investment scenarios experienced during the gigabit transition.
By Component: Connectivity Subsegment Accelerates on Modular Designs
Connectivity, including pre-terminated trunks and modular patch panels, is growing fastest at 9.93% CAGR, eclipsing the 42.76% share held by bulk cables in 2025. Factory-terminated MPO assemblies slash on-site labor by up to 50% and assure insertion-loss compliance, an attractive hedge against installer shortages. Patch panels are doubling density from 24 to 48 ports per rack unit and integrating slack storage pockets that streamline future moves.
Chinese low-cost entrants are discounting copper keystone jacks by 30-40%, but Tier 3 and Tier 4 data center buyers remain wary of plating quality and cycle durability, insulating premium brands. Colocation landlords, facing costs exceeding USD 200 monthly for every rack unit, are increasingly valuing cable-management accessories. These accessories are adapting to accommodate the broader bend radius of Category 6A cables and high-strand-count fibers.

By Application: Data Centers Outpace LAN as Edge Computing Expands
Data centers accounted for 56.72% of 2025 revenue and will expand by 9.31% through 2031, overtaking slower LAN growth tied to office densification and wireless substitution. For every megawatt of IT load added, approximately 3-5 kilometers of fiber trunk and 10-15 kilometers of copper horizontal cabling are required. This demand significantly amplifies the structured cabling volumes at edge campuses, like Edged's site in Chicago, which boasts a capacity of 96 megawatts.
LAN projects are now prioritizing cost efficiency per port over redundancy. They are adopting single-path Category 6A and PoE switching. In contrast, Tier 3-4 data centers are emphasizing concurrent maintainability, which effectively leads to a doubling of cable paths. Meanwhile, edge deployments are dispersing purchasing power across secondary metropolitan areas. This trend bolsters regional contractors but poses challenges for manufacturers in securing volume contracts.
By End-User Industry: Healthcare Leads Growth as Telehealth Scales
Healthcare is expanding at 10.11% CAGR, the steepest among verticals, fueled by electronic health record mandates, imaging data proliferation, and telehealth suites that require gigabit uplinks at every bedside. Structured cabling density per patient bed now exceeds 20 drops, double legacy voice-grade counts. IT and telecom kept the largest slice at 28.73% in 2025, anchored by carrier-neutral colocation and cloud operator footprints.
Manufacturing uses ruggedized Category 6A for EtherNet/IP control loops, although cable density per square foot lags that of data centers. Government demand is steady, governed by Buy America clauses and heightened cybersecurity standards that favor domestic suppliers. Commercial real estate accelerates PoE lighting and building-management overlays, blending IT and electrical scopes into a single low-voltage backbone.
By Installation Type: New Construction Dominates as BEAD Funding Flows
New builds represented 63.91% of 2025 activity and are rising 9.33% annually, buoyed by hyperscale campuses and BEAD-funded rural fiber lines. Greenfield projects, by integrating ladder racks and conduit sleeves during the structural design stage, significantly enhance efficiency by reducing labor requirements by 30-40%. This approach is notably more effective compared to retrofits, which must address the challenges posed by pre-existing mechanical and electrical congestion.
In rural aerial builds, pole-replacement and make-ready work typically costs between USD 20,000 and 40,000 per mile. However, in rocky underground terrains, costs can soar beyond USD 100,000, leading to a clear preference for new aerial strings. After accounting for asbestos abatement, fire-stopping, and tray expansions, retrofit costs can surpass USD 300 per drop. This has hindered growth in older high-rise stocks, even though there's a pressing demand for Category 6A upgrades.
Geography Analysis
The United States currently generates the bulk of revenue in the North America structured cabling market, driven by massive data center additions and state-administered BEAD grants that accelerate rural fiber deployment. Indiana, Wisconsin, and Virginia have emerged as hyperscale clusters, each featuring multibillion-dollar capex plans that translate into tens of thousands of fiber strand counts per campus. Pole-access compression to 30 days further catalyzes aerial builds, and AT&T’s 50-million-home pass goal brings sustained outside-plant cable orders.
Mexico’s share remains modest but is rising; Querétaro and Monterrey have become magnet cities for colocation operators seeking lower land rates and favorable power purchase agreements. As automotive and electronics manufacturing lines relocate from Asia, fiber backbones are facilitating advanced industrial connectivity. This development is reinforcing a latency ring optimized for supply chain efficiency, particularly at Texas border crossings.
Canada’s cabling volumes are concentrated in Toronto, Montreal, and Vancouver, where Equinix and hyperscale tenants form the core client base. The Universal Broadband Fund is extending single-mode fiber to remote communities, although per-mile costs are triple those in the United States due to alpine and tundra terrain. Domestic sourcing rules under both BEAD and Canadian federal guidelines lengthen lead times but shield local manufacturers from offshore price competition.
Competitive Landscape
The supplier base features Belden, CommScope, Corning, Panduit, and a constellation of regional specialists. Belden’s enterprise connectivity revenue slipped 3% year over year to USD 536 million in Q3 2024 amid distributor destocking, yet gross margins stayed north of 40% through mix shifts toward Category 6A and fiber assemblies. CommScope booked USD 1.1 billion across the first three quarters of 2024 for enterprise cabling, emphasizing pre-terminated trunks that cut site labor in mission-critical builds. Corning’s optical communications arm delivered USD 1.0 billion in Q3 2024, leveraging ribbon-fiber and low-loss MPO solutions tuned for 400-gigabit and 800-gigabit spine deployments.
White-space competition grows in smart-building PoE ecosystems, where Schneider Electric and Leviton integrate cabling, switching, and analytics for energy dashboards. Skilled labor shortages elevate the appeal of turnkey contractors that combine design, install, and certification, pushing OEMs to bundle training vouchers and on-site supervision. Edge facility dispersion favors nimble regional installers who can mobilize quickly to tier-2 cities often bypassed by national integrators. IEEE 802.3df’s finalization unlocks an 800-gigabit refresh cycle that rewards suppliers with early MPO-16 connector portfolios.
Price volatility in copper and helium shortages in glass drawing remain operational risks; however, domestic expansion projects at Prysmian, Corning, and Superior Essex are adding nearly 1.4 million fiber-kilometers of annual capacity through 2026, cushioning supply gaps. Market entrants differentiate via reduced-diameter Category 6A cabling, tool-less connector designs, and sustainability certifications, but the top five vendors still control a majority of branded volume, yielding a moderate concentration profile.
North America Structured Cabling Industry Leaders
Belden Inc.
CommScope Inc.
Schneider Electric SE
Siemens AG
ABB Ltd.
- *Disclaimer: Major Players sorted in no particular order

Recent Industry Developments
- December 2025: Corning announced a USD 250 million expansion of its North Carolina fiber plant, adding 500,000 fiber-kilometer of annual output and automated preform lines that cut cost per kilometer by 8%.
- November 2025: Belden closed a USD 180 million acquisition of a European distributor, gaining pre-terminated trunk assembly capacity and USD 30 million of annual revenue synergy.
- October 2025: Panduit introduced Category 6B cabling rated for 10-gigabit over 150 meters, priced 15% below Category 6A and field-tested for 25% faster pulls.
- September 2025: CommScope won a USD 120 million order for pre-terminated fiber assemblies supporting a hyperscale campus in Virginia, totaling 2 million fiber-kilometer across phased deliveries.


North America Structured Cabling Market Report Scope
The North America Structured Cabling Market Report is Segmented by Product Type (Copper, and Fiber), Cable Category (Category 5e, Category 6, Category 6A, Category 7, Category 8), Component (Cables, Connectivity, Patch Panels and Cross Connects, Racks and Cabinets, Cable Management Accessories), Application (LAN, and Data Center), End-User Industry (IT and Telecom, Banking, Financial Services, and Insurance (BFSI), Government and Defense, Healthcare, Manufacturing, Commercial Buildings), Installation Type (New Installation, and Upgrade and Retrofit), and Geography (United States, Canada, Mexico). Market Forecasts are Provided in Value (USD).
By Product Type
| Copper | Copper Cable |
| Copper Connectivity | |
| Fiber | Fiber Cable (Single-mode) |
| Fiber Cable (Multi-mode) | |
| Fiber Connectivity |
By Cable Category
| Category 5e |
| Category 6 |
| Category 6A |
| Category 7 |
| Category 8 |
By Component
| Cables |
| Connectivity |
| Patch Panels and Cross Connects |
| Racks and Cabinets |
| Cable Management Accessories |
By Application
| LAN |
| Data Center |
By End-User Industry
| IT and Telecom |
| Banking, Financial Services, and Insurance (BFSI) |
| Government and Defense |
| Healthcare |
| Manufacturing |
| Commercial Buildings |
By Installation Type
| New Installation |
| Upgrade and Retrofit |
By Country
| United States |
| Canada |
| Mexico |
| By Product Type | Copper | Copper Cable |
| Copper Connectivity | ||
| Fiber | Fiber Cable (Single-mode) | |
| Fiber Cable (Multi-mode) | ||
| Fiber Connectivity | ||
| By Cable Category | Category 5e | |
| Category 6 | ||
| Category 6A | ||
| Category 7 | ||
| Category 8 | ||
| By Component | Cables | |
| Connectivity | ||
| Patch Panels and Cross Connects | ||
| Racks and Cabinets | ||
| Cable Management Accessories | ||
| By Application | LAN | |
| Data Center | ||
| By End-User Industry | IT and Telecom | |
| Banking, Financial Services, and Insurance (BFSI) | ||
| Government and Defense | ||
| Healthcare | ||
| Manufacturing | ||
| Commercial Buildings | ||
| By Installation Type | New Installation | |
| Upgrade and Retrofit | ||
| By Country | United States | |
| Canada | ||
| Mexico | ||


Key Questions Answered in the Report
What factors are driving the rapid shift to fiber in North American data centers?
Spine upgrades to 400-gigabit and 800-gigabit Ethernet, coupled with TIA-942-B redundancy mandates, are propelling single-mode fiber demand as operators future-proof against AI workloads and latency constraints.
How does the BEAD program influence cabling demand?
The USD 42.45 billion allocation funds aerial and underground fiber lines across unserved census blocks, creating a multiyear pipeline that supports 9.33% CAGR for new installations through 2031.
Why is Category 6A still preferred over Category 8 for most horizontal runs?
Category 6A supports 10-gigabit Ethernet over 100 meters at lower cost and without the 30-meter limitation that confines Category 8 to switch-to-server links, making it a balanced choice for future bandwidth and PoE power.
Which vertical shows the fastest growth rate in structured cabling?
Healthcare leads with a 10.11% CAGR as hospitals modernize imaging networks, telehealth suites, and real-time location systems that double the number of cable drops per bed.
How significant is Power over Ethernet in new commercial buildings?
IEEE 802.3bt allows 90-watt delivery, enabling LED lighting and IoT devices over a single Category 6A run, which cuts total installation cost by about 30% and reduces building energy use by up to 15%.
What challenges affect retrofit projects in urban high-rise buildings?
Asbestos abatement, congested pathways, and fire-stopping requirements can push retrofit costs to USD 300 per cable drop, roughly double the expense of greenfield installs, thus tempering upgrade activity.
Page last updated on:


