
North America Organic Waste Collection Services Market Size and Share
Market Overview
| Study Period | 2020 - 2031 |
|---|---|
| Forecast Data Period | 2026 - 2031 |
| Base Year Market Size (2025) | USD 2.66 Billion |
| Market Size (2026) | USD 2.80 Billion |
| Market Size (2031) | USD 3.62 Billion |
| Growth Rate (2026 - 2031) | 5.25 % |
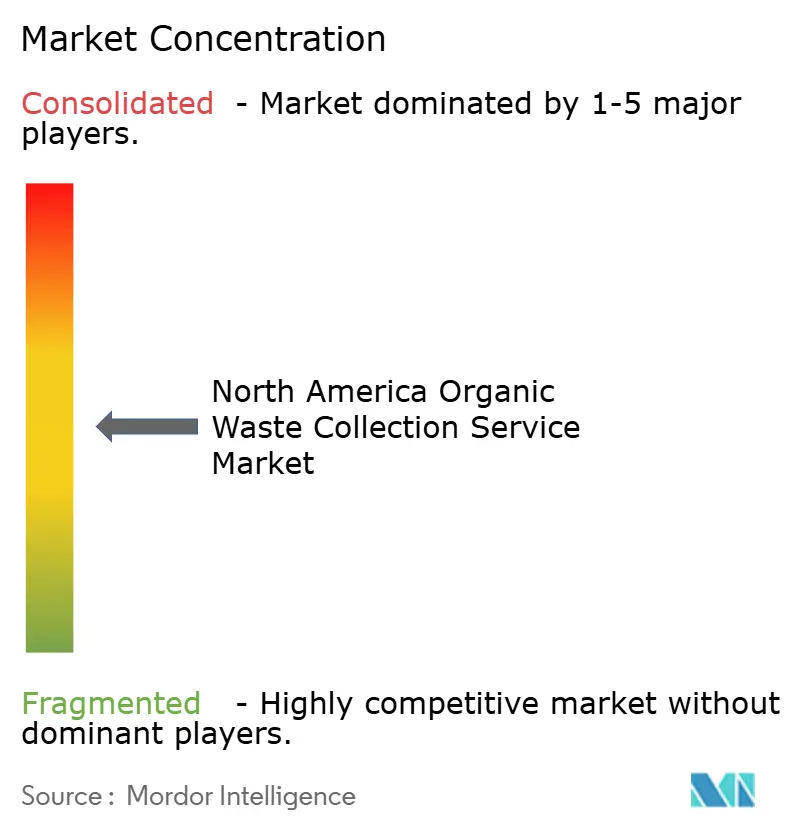
| Market Concentration | Medium |
Major Players *Disclaimer: Major Players sorted in no particular order Image © Mordor Intelligence. Reuse requires attribution under CC BY 4.0. | |
North America Organic Waste Collection Services Market Analysis by Mordor Intelligence
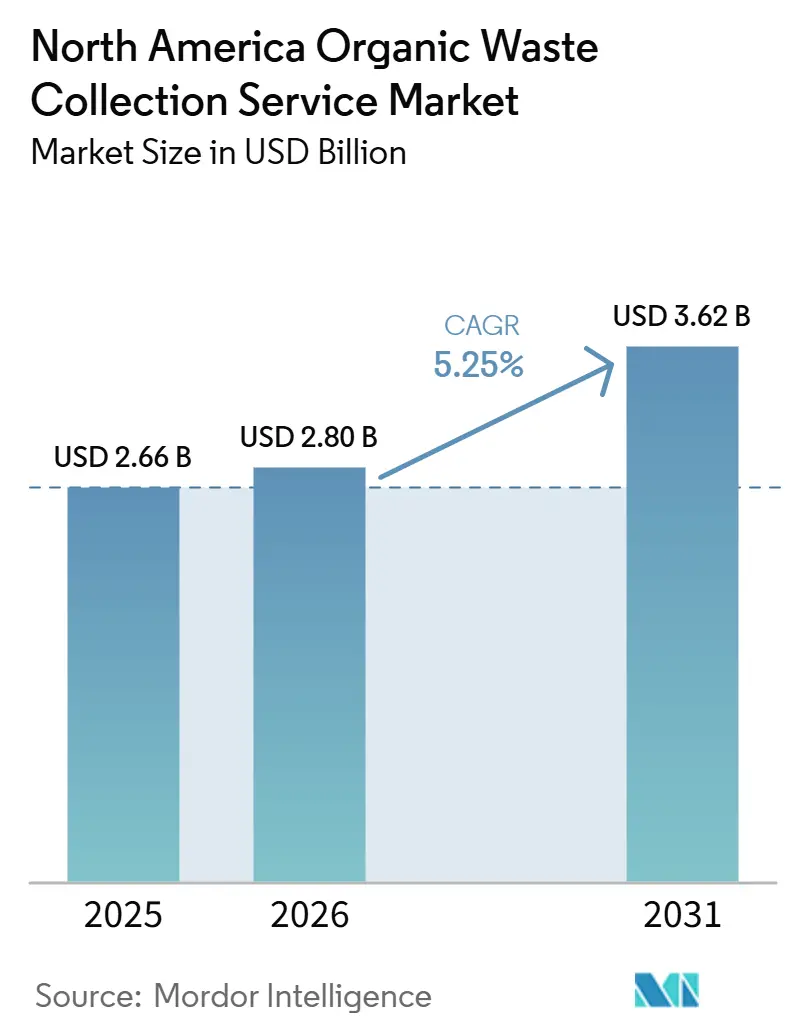
The North America Organic Waste Collection Service Market size was valued at USD 2.66 billion in 2025 and is estimated to grow from USD 2.80 billion in 2026 to reach USD 3.62 billion by 2031, at a CAGR of 5.25% during the forecast period (2026-2031).
Growth in the North America organic waste collection service market reflects policy tailwinds from clean fuel standards, federal production tax credits, and final EPA volume requirements that anchor demand for renewable natural gas pathways. Municipal climate plans and source-separation mandates lock in multi-year tonnage, improving route density and asset utilization for residential and commercial pickups. Operators scale automation and bin-level data to counter labor exposure and fuel volatility while positioning fleets for zero-emission compliance.Consolidation through targeted acquisitions and RNG-integrated partnerships continues as municipalities balance budget limits with organics diversion goals and facility supply commitments.
Key Report Takeaways
- By waste type, yard and landscape waste led with a 66.2% of North America organic waste collection service market share in 2025, while food waste is projected to expand at a 6.89% CAGR through 2031.
- By end-user, residential collection held 74.3% of the North America organic waste collection service market size 2025 base, and commercial is forecast to grow at a 7.62% CAGR through 2031.
- By collection method, door-to-door accounted for 68.4% in 2025 and is set to advance at a 7.91% CAGR through 2031.
- By technology and equipment, fully automated systems commanded 60.7% in 2025 and are projected to grow at an 8.49% CAGR through 2031.
- By geography, the United States led with 79.3% share in 2025, while Mexico records the fastest growth at a 6.35% CAGR through 2031.
Note: Market size and forecast figures in this report are generated using Mordor Intelligence’s proprietary estimation framework, updated with the latest available data and insights as of January 2026.
Market Trends and Insights
Drivers Impact Analysis of North America Organic Waste Collection Services Market*
| Drivers | (~) % Impact on CAGR Forecast | Geographic Relevance | Impact Timeline |
|---|---|---|---|
| Low Carbon Fuel Standard Credits Supporting Organic Waste-to-Energy | +2.0% | California, Oregon, Washington | Short term (≤ 2 years) |
| Federal and State Incentives for Renewable Natural Gas (RNG) Production from Organic Waste | +1.8% | United States, Canada (emerging under TIER) | Medium term (2-4 years) |
| Municipal Climate Action Plans Targeting Methane Emission Reductions from Landfills | +1.5% | North America with leaders in Toronto and Cleveland | Long term (≥ 4 years) |
| Infrastructure Investments Through Federal Climate and Infrastructure Funding Programs | +1.2% | United States, equity focus communities | Long term (≥ 4 years) |
| Rising Consumer Awareness and Demand for Curbside Organic Waste Collection | +0.9% | North America urban centers and suburbs | Medium term (2-4 years) |
| Food Waste Donation Tax Incentives for Large Generators | +0.4% | United States nationwide | Short term (≤ 2 years) |
| Source: Mordor Intelligence | |||
Low Carbon Fuel Standard Credits Supporting Organic Waste-to-Energy Projects
State-level Low Carbon Fuel Standard (LCFS) programs in California, Oregon, and Washington are driving the growth of the North America Organic Waste Collection Service market. These programs link financial incentives to renewable natural gas (RNG) and organic waste-to-energy projects. Through LCFS credit mechanisms, waste management operators are generating additional revenue by converting food, agricultural, and municipal organic waste into biogas and low-carbon transportation fuels. California, with its LCFS framework and Senate Bill 1383 mandates for organic waste diversion, is at the forefront. These initiatives motivate municipalities and private entities to bolster food waste collection and anaerobic digestion infrastructure. Meanwhile, Oregon and Washington's parallel clean fuel policies are spurring investments in organic waste recovery and renewable energy production. As LCFS credits are monetized, they enhance the financial viability of companies in organic waste collection and processing. This boost is hastening the adoption of source-separated organic waste programs, propelling short-term market growth across the western United States in the coming two years.
Federal and State Incentives for Renewable Natural Gas (RNG) Production from Organic Waste
Section 45Z provides production tax credits through 2029 for low-carbon transportation fuels, using a GREET (Greenhouse gases, Regulated Emissions, and Energy use in Transportation)-based model that includes organic waste digestion pathways, thereby strengthening project economics for dairies, wastewater, and landfill gas[1]Federal Register, “Section 45Z Clean Fuel Production Credit,” Federal Register, federalregister.gov. Treasury guidance issued in February 2026 clarifies that emissions rates for manure pathways can be negative, increasing the credit value for livestock digesters and accelerating underwriting for new builds. Provincial support in Canada, such as Alberta’s TIER grant to Taurus Canada RNG, demonstrates parallel policy alignment that de-risks capital for large-scale manure-to-RNG projects with defined offtake pathways. Private developers are moving to commercial operations, with Clean Energy Fuels commissioning a major Texas dairy RNG facility and achieving full RIN (Renewable Identification Number) eligibility under the Renewable Fuel Standard. Verification under ISO frameworks and RFS (Renewable Fuel Standard) Part 80 helps maintain integrity of credit generation, while California’s schedule to phase down avoided methane crediting after 2029 creates a timing window that is front-loading development and procurement cycles.
Municipal Climate Action Plans Aimed at Reducing Landfill Methane Emissions
Major cities are linking organics processing capacity and RNG production to corporate emissions goals, as shown by Toronto’s plan to expand Green Bin processing and reach 1.5 million gigajoules of biogas by 2030. Local plans embed funding alignment and zero-emission fleet tie-ins that improve execution, such as San Mateo County’s approach that directs LCFS benefits toward clean transportation projects for disadvantaged communities. Smaller municipalities in Canada are following with organics diversion as a core lever in climate plans, supported by national green funds and provincial incentives that reduce project risk. City strategies in the United States include institutional pilots and procurement commitments that build steady organics tonnage for long-term contracts and facility financing. These plans favor multi-year agreements and steady feedstock flow, which make the North America organic waste collection service market more resilient to short-term commodity volatility.
Infrastructure Investment Through Federal Climate and Infrastructure Funding Programs
According to funding initiatives under the United States Infrastructure Investment and Jobs Act (IIJA) and the Inflation Reduction Act (IRA), large-scale federal investments in climate resilience, recycling infrastructure, clean transportation, and waste management are supporting long-term growth in the North American organic waste collection service market. These programs are directing billions of dollars toward sustainable infrastructure development, particularly in underserved and equity-focused communities. Federal funding supports investments in organic waste collection fleets, anaerobic digestion facilities, composting infrastructure, methane-reduction initiatives, and renewable natural gas (RNG) projects. Municipalities and waste operators are increasingly leveraging grants and climate-focused financing programs to modernize waste diversion systems and expand organics recycling capacity. In addition, environmental justice and community-focused infrastructure programs are accelerating the deployment of sustainable waste management systems in low-income and historically underserved regions. Over the long term, these investments are expected to strengthen collection infrastructure, improve landfill diversion rates, and support continued expansion of the organic waste collection service market across the United States.
Restraints Impact Analysis of North America Organic Waste Collection Services Market*
| Restraint | (~) % Impact on CAGR Forecast | Geographic Relevance | Impact Timeline |
|---|---|---|---|
| High Collection and Processing Costs in Low-Density Suburban and Rural Areas | -1.4% | Rural United States and Canada | Long term (≥ 4 years) |
| Limited Anaerobic Digestion and Composting Facility Capacity | -1.2% | Northeast and Midwest United States, Prairie Provinces | Medium term (2-4 years) |
| Municipal Budget Constraints and Competing Priorities | -0.8% | North American municipalities with fiscal stress | Medium term (2-4 years) |
| Low Participation Without Mandatory Collection Programs | -0.7% | Suburban and rural jurisdictions without mandates | Short term (≤ 2 years) |
| Source: Mordor Intelligence | |||
High Collection and Processing Costs in Low-Density Suburban and Rural Areas
Some districts report sharp increases in processing fees and disposal costs since 2022, which raises rate pressure and limits service expansion without revenue adjustments[2]Cayucos Sanitary District, “New Solid Waste Rate Adjustment Methodology and 2025 Rates,” Cayucos Sanitary District, cayucossanitarydistrict.gov. State mandates in California and zero-emission fleet rules add costs and compress the capital cycle, making it harder to absorb on sparse routes that lack density advantages. Urban routes can trim fuel and labor by removing unnecessary stops with data tools, yet rural deployment of sensors and route optimization yields smaller savings due to distance and participation variability. Federal grants help seed projects, but competition for limited funds can favor larger and more scalable proposals over isolated rural pilots. This cost structure slows program rollouts in lower-density markets within the North America organic waste collection service market.
Limited Anaerobic Digestion and Composting Facility Capacity
Permitting complexity across air, solid waste, and water programs slows new anaerobic digestion projects and increases pre-development timelines and costs. Capacity disruptions from events such as facility fires remove regional processing options and force longer-haul logistics, eroding collection economics. EPA notes that only a fraction of eligible farms and wastewater plants operate digesters, and that the stand-alone food waste digester count remains too low to absorb commercial streams at scale. Municipalities sometimes defer organics facility upgrades to prioritize affordability in near-term budgets, thereby delaying supply growth and slowing diversion targets. These constraints cap throughput and limit near-term tonnage growth in the North America organic waste collection service market.
*Our forecasts treat driver/restraint impacts as directional, not additive. The impact forecasts reflect baseline growth, mix effects, and variable interactions.
North America Organic Waste Collection Services Market Segment Analysis
By Waste Type:
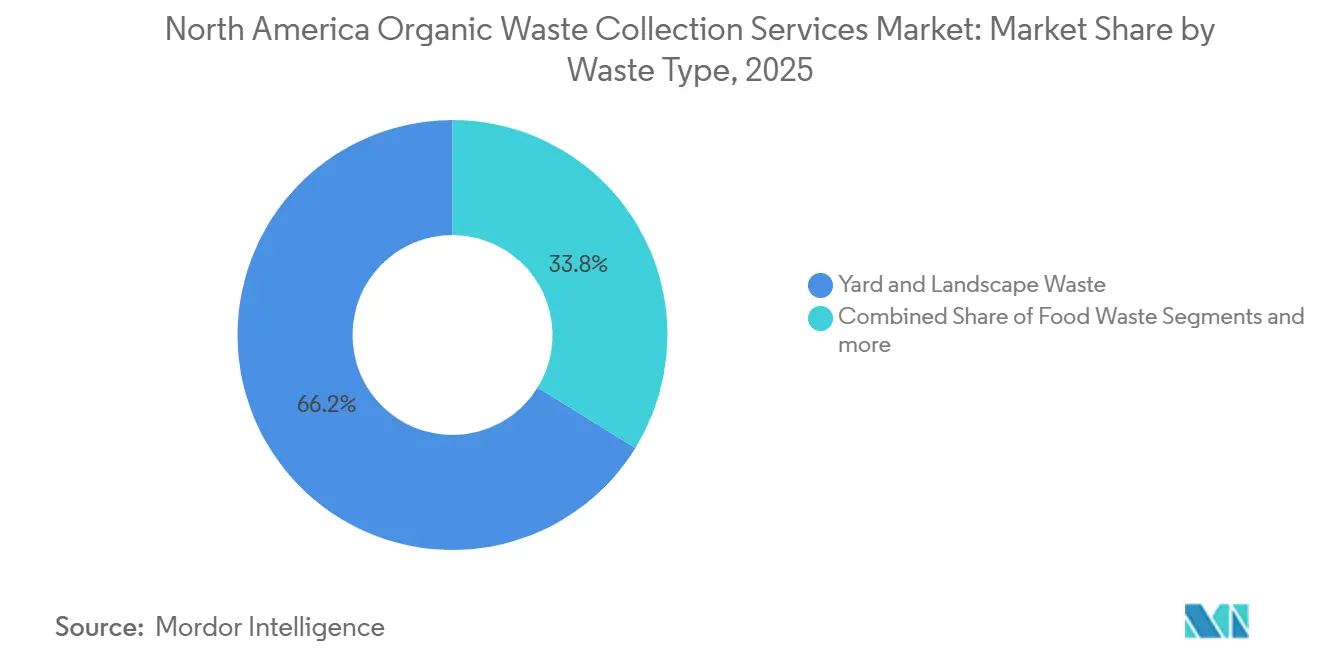
Food Waste Gains Momentum Despite Yard Waste DominanceYard and landscape waste accounted for 66.2% of 2025 collections, while food waste is set to grow at a 6.89% CAGR to 2031 as mandates and RNG credit values favor high-energy feedstocks. The North American organic waste collection service market benefits when food waste streams unlock avoided methane and fuel credits under the LCFS and RFS frameworks, thereby improving. Operators are investing in depackaging to improve contamination control and feed anaerobic digestion plants, thereby scaling fuel output and increasing certainty around offtake for digestate products and processing revenue. State-level organics separation mandates that apply to large generators continue to extend beyond early adopters, which builds a multi-year lift for commercial and institutional food waste diversion. Agricultural residues remain a small share due to dispersed supply and seasonality, though co-located manure projects supported by TIER grants add throughput and regional RNG supply.
Food waste’s methane yield and credit intensity draw capital toward integrated depackaging and digestion facilities that can lock in offtake, stabilize tipping fees, and create long-term contracts for haulers in the North America organic waste collection service market[3] American Biogas Council, “WM Opens USD 131 Million RNG Facility,” American Biogas Council, americanbiogascouncil.org . Niche biosolids and industrial byproducts are being valorized through advanced drying and conversion technologies that support power generation and carbon benefits. Yard waste programs remain the backbone of municipal services, but their growth pace is slower than food waste as fewer policy incentives attach to low-energy feedstocks. Over time, cross-contamination controls and education improve diversion quality, which supports lower processing costs and higher recovery in the North America organic waste collection service industry.



By End-User:
Commercial Outpaces Residential GrowthResidential collection accounted for 74.3% in 2025, reflecting municipal contracts and subscription density that anchor the North American organic waste collection service market, while commercial is projected to expand at a 7.62% CAGR through 2031. Regulations that require large generators to separate food scraps within defined distances of processing sites formalize demand and shift voluntary pilots into contracted service volumes. Commercial and institutional sites respond to standardized cart sizes and service levels with weight tracking and contamination metrics that guide behavior and fees. Large retailers and manufacturers are building direct processing and RNG offtake ties to secure environmental outcomes and cost predictability, which strengthens commercial pipeline visibility. Residential growth relies on convenience and outreach, and a program design that converts awareness into repeat set-outs can improve diversion performance in the North America organic waste collection service market.
Commercial volumes are also influenced by floor-plan density and back-of-house workflows that determine contamination patterns, service cadence, and viable container options. For industrial food processing, on-site depackaging and direct injection facilities can enable predictable throughput, supporting investment and stable tip rates. Residential programs remain core to local climate strategies. When bundled with yard waste and educational materials, they can deliver scale that improves route economics in the North America organic waste collection service industry. Over the forecast horizon, commercial momentum outpaces residential growth in percentage terms, but residential remains the largest contributor to total volumes.
By Collection Method:
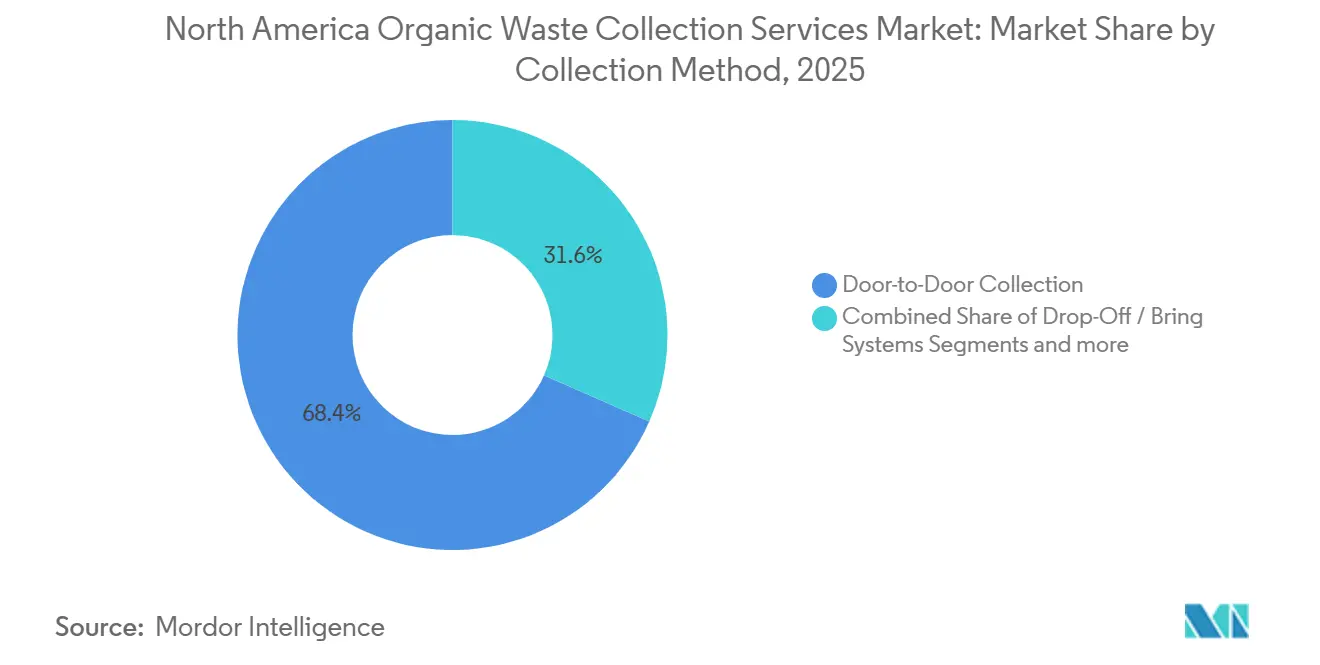
Door-to-Door Dominance Paired with Automation GainsDoor-to-door collection accounted for 68.4% in 2025 and is projected to grow at a 7.91% CAGR through 2031, supported by municipal service models and subscription-based offerings across the North America organic waste collection service market. Automated and semi-automated routes with bin-level identity, camera support, and weight data reduce touches and improve auditability, which enables performance-based contracts and contamination fees. Smart bins and sensors, when paired with predictive models, can lower distance traveled and improve customer service, though economics vary by density and geography. Drop-off systems remain niche and are best suited to recreational or seasonal sites where door-to-door density is difficult to achieve. These patterns reinforce door-to-door’s central role in the North America organic waste collection service market while technology upgrades refine cost per tonne collected.
Mandated fleet transition timelines influence collection method choices and capital allocation, and pilots in large cities are testing performance across route types before broader deployment. In suburban areas, semi-automated services balance labor savings with lower upfront equipment costs, while manual collection persists where road design or funding limits upgrades. Integrating curbside organics with data reporting can help municipalities track diversion, set-out rates, and contamination, which supports performance incentives and route consolidation. Over time, consistent data streams build confidence for offtake agreements and help align collection cadence with processing capacity in the North America organic waste collection service market.
By Technology & Equipment:
Automation Drives Efficiency, Fleet Electrification AcceleratesFully automated systems held 60.7% in 2025 and are forecast to expand at an 8.49% CAGR to 2031, reflecting a shift to RFID, bin weighing, and optimization tools that compress route times and lower operating costs in the North America organic waste collection service market. Case studies validate the impact of bin-level identification and data platforms on end-to-end traceability, billing accuracy, and contamination reduction at scale. Fleet electrification pilots in multiple jurisdictions are underway, supported by utility rebates and IRA-funded clean vehicle programs that lower emissions and reduce noise on urban routes. Semi-automated platforms remain relevant for mid-sized cities that manage budget constraints without sacrificing safety or ergonomic gains, while manual systems decline as labor conditions tighten. AI-enabled sorting and conversion technologies at processing hubs can reduce diversion and support carbon outcomes by handling mixed municipal streams that include organics.
Continuous telematics and asset health data reduce downtime and support predictive maintenance, which increases route completion reliability. Electric refuse trucks carry higher upfront costs, but when paired with incentives and smart charging, lifecycle economics can align with policy targets and procurement cycles. Operators that standardize APIs across collection and processing systems can integrate data from multiple vendors, which supports city dashboards and transparent reporting. These shifts enhance cost visibility across the North America organic waste collection service market and prepare fleets for scaling under clean fuel credit regimes.
Geography Analysis
United States Organic Waste Collection Services Market
The United States commanded 79.3% of the North America organic waste collection service market share in 2025, underpinned by state mandates and federal incentives that align collection economics with RNG monetization pathways. National and state programs have funded new organics processing capacity and RNG facilities, which enhances offtake confidence and supports long-term hauling contracts. Rising processing and disposal costs have pressured municipal budgets, which increases the importance of route density, contract design, and contamination controls to maintain service levels. Permitting complexity and environmental justice reviews extend timelines for new digestion and composting facilities, especially in the Northeast and Midwest. Over 2026-2031, utility interconnections and clean fuel markets remain important demand anchors that stabilize throughput in the North America organic waste collection service market.
Canada Organic Waste Collection Services Market
Canada held a smaller share in 2025 but shows clear momentum from provincial incentives and municipal climate targets that name organics diversion and RNG as priority actions. Alberta’s TIER funding for livestock manure digestion adds capacity and demonstrates scalable regional models that can link directly into gas systems. Cities such as Calgary are expanding composting and digestion footprints with support from federal and municipal funds, which raises long-term capacity for curbside and commercial programs. Contracts that integrate biochar and compost markets also appear in Western Canada, which spreads risk and creates local soil product value streams. Electric collection fleets in British Columbia show how utility rebates and infrastructure grants can accelerate zero-emission transitions that align with organics service goals.
Mexico Organic Waste Collection Services Market
Mexico records the fastest growth at a 6.35% CAGR through 2031, supported by cross-border eligibility for 45Z feedstocks and growing interest in organics diversion in major cities. Domestic processing capacity is expanding from a small base, and alignment with North American fuel credit regimes increases the value of organics collection networks that can supply digestion projects. Pilot curbside and drop-off programs in large metros inform service models, while investment cases for new facilities improve when integrated with utility pipelines or fleet fuel contracts. Environmental justice priorities shape facility siting in the United States and Canada, and similar themes are emerging in Mexican municipalities as plans evolve. These trends position Mexico as a rising contributor of growth within the North America organic waste collection service market.
Competitive Landscape
The North America organic waste collection service market is moderately fragmented, with major integrated haulers leveraging route density and landfill gas-to-RNG assets while specialized developers pursue depackaging and digestion hubs tied to clean fuel markets. Large incumbents extend their RNG footprints through partnerships that convert collection volumes into pipeline-quality gas for utility sale or fleet use. California LCFS changes, and fleet electrification rules compress decision timelines, which favors operators with access to capital and a structured offtake that reduces earnings volatility. Within this backdrop, competition is shifting toward cost-to-serve, data transparency, and the ability to integrate collection with processing and fuel pathways.
Specialized players use depackaging, a commercial food-service focus, and subscription models to capture growth where mandates are newer or uneven. Community-scale projects show how local economic benefits and job creation can support siting and permitting while enabling resilient end markets. Recent acquisitions have expanded national organics footprints and brought long-operating digestion sites into larger networks that can scale standard practices and data systems. Subscription-based residential operators have validated willingness-to-pay and high service reliability, which helps municipalities justify program expansions and invest in contamination control.
Technology adoption differentiates operators on route economics and quality outcomes, and AI-enabled processing increases the diversion value of collected organics within mixed waste streams. Electric fleets are moving from pilots to staged rollouts with utility support, and procurement will likely scale as charging infrastructure and total cost of ownership improve. Direct retail and manufacturer partnerships provide committed feedstock and revenue, which helps developers finance new digestion capacity and secure clean fuel credits that enhance returns. These competitive moves position integrated platforms and data-driven specialists to gain share in the North America organic waste collection service market.
North America Organic Waste Collection Services Industry Leaders
Republic Services
Waste Connections
Recology
Synagro
CompostNow
- *Disclaimer: Major Players sorted in no particular order
North America Organic Waste Collection Services Market Companies Covered in this Report
- Republic Services
- Waste Connections
- Recology
- Synagro
- CompostNow
- GFL Environmental Inc.
- Compost Crew
- Black Earth Compost
- Bootstrap Compost
- Denali
- Groot Industries
- Atlas Organics
- Rumpke Waste & Recycling
- Sanimax
- Veolia
- TerraCycle
- Convertus Group
- Remix Organics
- AgRecycle
- Action Carting Environmental Services, Inc

Recent Industry Developments in North America Organic Waste Collection Services Market
- April 2026: Divert, Inc. opened its 66,000-square-foot Integrated Diversion & Energy Facility in Longview, Washington, the first of its kind in the state, processing up to 100,000 tonnes of unsold food annually to produce over 235,000 MMBtu (Million British Thermal Units) of renewable energy and 450,000 pounds of nutrient-rich fertilizer, with an interconnection agreement for RNG injection into Cascade Natural Gas distribution pipelines serving Albertsons, Fred Meyer, Kroger, Reser’s Fine Foods, and Safeway across the Pacific Northwest.
- April 2026: Southeastern Public Service Authority in Portsmouth, Virginia launched an expanded trash-to-recycling plant using AI technology under a USD 450 million, 20-year contract with AMP, processing 540,000 tonnes of municipal solid waste annually from 1.2 million South Hampton Roads residents, diverting at least 50% from landfill via AI sorting and converting organics to biochar, with analysis showing over 0.7 tonnes CO2e avoided or removed per tonne treated, projecting 378,000 tonnes CO2e annual impact
- March 2026: Bulk Handling Systems, Zero Waste Energy, Napa Recycling and Waste Services, and the City of Napa formed a public-private partnership to develop a dry anaerobic digestion and RNG facility at the Napa Recycling and Composting Facility, using SMARTFERM Plug Flow to generate up to 500,000 diesel gallon equivalents of CNG annually.


North America Organic Waste Collection Services Market Report Scope
| Food Waste (Pre and Post Consumer) |
| Yard & Landscape Waste |
| Agricultural Residues |
| Others |
| Residential |
| Commercial (HoReCa, Retail) |
| Industrial (Food Processing & Manufacturing) |
| Others (Agri-waste) |
| Door-to-Door Collection |
| Drop-Off / Bring Systems |
| Others |
| Manual Collection Systems |
| Semi-Automated Systems |
| Fully Automated Systems |
| Others |
| United States |
| Canada |
| Mexico |
| By Waste Type | Food Waste (Pre and Post Consumer) |
| Yard & Landscape Waste | |
| Agricultural Residues | |
| Others | |
| By End-User | Residential |
| Commercial (HoReCa, Retail) | |
| Industrial (Food Processing & Manufacturing) | |
| Others (Agri-waste) | |
| By Collection Method | Door-to-Door Collection |
| Drop-Off / Bring Systems | |
| Others | |
| By Technology & Equipment | Manual Collection Systems |
| Semi-Automated Systems | |
| Fully Automated Systems | |
| Others | |
| By Geography | United States |
| Canada | |
| Mexico |


Key Questions Answered in the Report
What is the projected size and growth rate of the North America organic waste collection service market to 2031?
North America organic waste collection service market is projected to reach USD 3.62 billion by 2031, expanding at a 5.25% CAGR from 2026 to 2031.
Which end-user segment is growing the fastest in North American organics collection?
Commercial is the fastest growing, with a projected 7.62% CAGR through 2031, supported by mandates for large generators and corporate commitments.
How do policies like 45Z and LCFS affect organics collection economics?
45Z production tax credits and LCFS crediting periods improve RNG project returns and offtake certainty, which supports collection contracts and route density
Which collection method leads in North America and why?
Door-to-door leads with a 68.4% share due to municipal service models and subscriptions, and it benefits from automation that lowers labor per route
What geographies drive most revenue and where is growth fastest?
The United States held 79.3% of 2025 revenue, while Mexico shows the fastest growth at a 6.35% CAGR through 2031 based on cross-border eligibility and emerging programs
Which technologies are shaping route efficiency and compliance?
RFID bin tracking, onboard weighing, route optimization, and electric fleets reduce costs and prepare for zero-emission rules, while AI at processing sites boosts diversion
Page last updated on:





