North America Industrial Component Market Size and Share
Market Overview
| Study Period | 2019 - 2030 |
|---|---|
| Forecast Data Period | 2025 - 2030 |
| Historical Data Period | 2019 - 2023 |
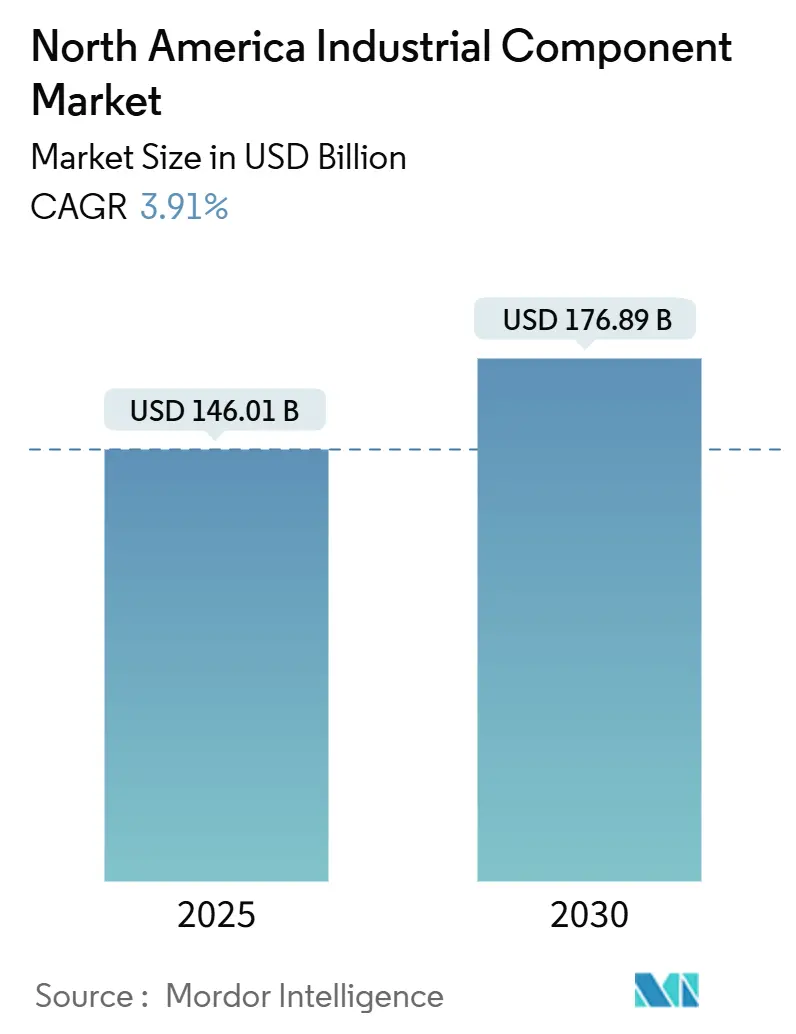
| Market Size (2025) | USD 146.01 Billion |
| Market Size (2030) | USD 176.89 Billion |
| Growth Rate (2025 - 2030) | 3.91% CAGR |
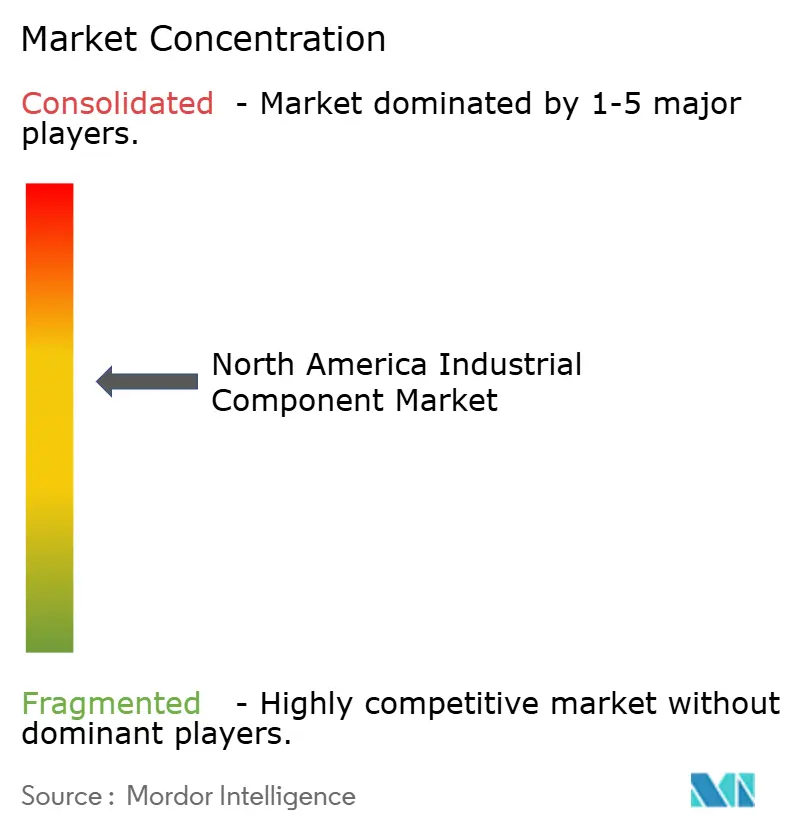
| Market Concentration | Medium |
Major Players *Disclaimer: Major Players sorted in no particular order Image © Mordor Intelligence. Reuse requires attribution under CC BY 4.0. | |
North America Industrial Component Market Analysis by Mordor Intelligence
The North America industrial component market size is estimated at USD 146.01 billion in 2025 and is projected to reach USD 176.89 billion by 2030, representing a 3.91% CAGR. Solid momentum stems from manufacturers' reshoring of production, record-high U.S. factory construction expenditures, and accelerated automation rollouts that demand more advanced bearings, motion-control assemblies, and sensor-embedded parts. Companies are also investing heavily in predictive maintenance and IIoT capabilities to curb unplanned downtime, while energy-transition projects boost demand for long-life, high-temperature components that justify premium pricing. Nearshoring to Mexico, broad adoption of e-commerce portals for spare-part fulfillment, and public incentives tied to domestic semiconductor and defense programs further widen revenue opportunities for suppliers across the region.
Key Report Takeaways
- By geography, the United States held 78.43% of the North America industrial component market share in 2024, whereas Mexico is projected to post a 5.19% CAGR through 2030.
- By component type, bearings led with a 29.72% revenue share in 2024, while motion-control components are projected to expand at a 5.46% CAGR through 2030.
- By material, metals accounted for 54.28% of the North America industrial component market size in 2024; composites are expected to increase at a 4.18% CAGR between 2025 and 2030.
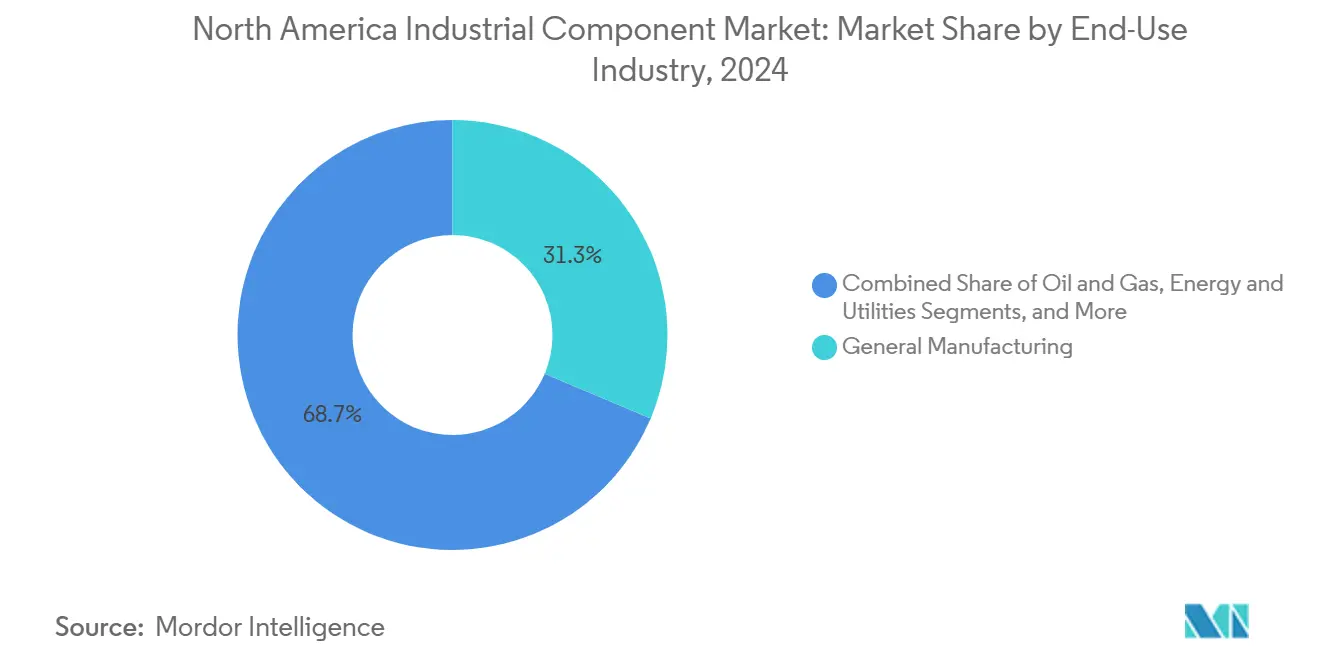
- By end-use industry, general manufacturing captured 31.34% of 2024 spending, yet aerospace and defense is advancing at a 4.98% CAGR over the same horizon.
- By distribution channel, direct OEM sales retained a 46.19% share in 2024, whereas online platforms are expected to grow at a 4.12% CAGR through 2030.
Note: Market size and forecast figures in this report are generated using Mordor Intelligence’s proprietary estimation framework, updated with the latest available data and insights as of January 2026.
North America Industrial Component Market Trends and Insights
Drivers Impact Analysis*
| Driver | (~) % Impact on CAGR Forecast | Geographic Relevance | Impact Timeline |
|---|---|---|---|
| Discrete Manufacturing | +1.2% | North America, concentrated in US Midwest and Mexico manufacturing corridors | Medium term (2-4 years) |
| Expansion of IIoT-Enabled Predictive Maintenance | +0.8% | Global, with early adoption in US and Canadian heavy industries | Long term (≥ 4 years) |
| Reshoring of Critical Supply Chains in the United States | +0.9% | United States, with spillover effects to Mexico and Canada | Short term (≤ 2 years) |
| Increased Capital Spending on Energy Transition Projects | +0.7% | North America, particularly renewable energy corridors in Texas, California, and Alberta | Long term (≥ 4 years) |
| Rapid Growth of E-Commerce Spare Parts Portals | +0.4% | North America, with strongest adoption in urban industrial centers | Medium term (2-4 years) |
| Emerging Defense and Space Manufacturing Programs | +0.3% | United States, concentrated in aerospace manufacturing hubs | Long term (≥ 4 years) |
| Source: Mordor Intelligence | |||
Rising Automation in Discrete Manufacturing
Robot installations climbed 12% to 44,303 units across North America in 2024, underscoring a decisive pivot toward flexible, lights-out production cells. OEMs are increasingly specifying servo-driven actuators and precision bearings that can stream vibration and temperature data into plant-wide dashboards, enabling predictive maintenance programs that reduce line stoppages by up to 30%. Suppliers that certify seamless integration with common enterprise resource planning suites gain priority in sourcing decisions, giving established motion control vendors a head start. Capital equipment builders are now evaluating component packages as holistic “performance stacks,” forcing traditional hardware makers to bundle firmware, analytics, and cybersecurity features out of the box. This shift turns the North America industrial component market into a platform play rather than a volume parts business.
Expansion of IIoT-Enabled Predictive Maintenance
In 2024, component makers embedded smart sensors directly into bearings, couplings, and seals instead of relying on add-on monitoring kits, a move that lowered total deployment cost while lifting service revenue per asset. Field data show maintenance budgets dropped 25% and component life stretched 20% at factories that adopted these self-diagnosing parts. Revenue models are evolving from one-time sales to subscription dashboards that alert technicians before anomalies escalate, cementing long-term supplier-client relationships. The technical barrier benefits incumbents with in-house software teams, widening the competitive moat against smaller machine-shop rivals. Additionally, defense and critical-infrastructure operators are mandating secure firmware update pathways, creating a new compliance hurdle and avenue for differentiation.
Reshoring of Critical Supply Chains in the United States
A record 244,000 manufacturing jobs were announced for reshoring or foreign direct-investment projects in 2024, up 67% from 2023. Semiconductor fabs funded by the CHIPS and Science Act alone require high-precision, ultra-clean bearings and motion tracks, stimulating brisk orders for U.S. suppliers within trucking distance of Arizona, Ohio, and Texas plants. Shorter logistics loops translate into lower carrying costs and faster engineering change-order cycles, values that outweigh modestly higher unit prices. Fastener and gasket suppliers situated near new fabs and battery plants are scaling capacity, as proximity shaves weeks off ramp-up timelines critical for capital-intensive projects.
Increased Capital Spending on Energy Transition Projects
North America attracted roughly USD 450 billion of the USD 1.8 trillion global clean energy investment in 2024, prompting a surge in demand for corrosion-resistant shafts, composite blades, and high-temperature seals. Wind-turbine gearboxes, solar tracker drives, and grid-scale battery modules rely on low-maintenance components that can operate for decades in remote sites. Consequently, technical-ceramic and advanced composite suppliers are winning contracts based on lifecycle cost rather than first-price bids. Component makers with ISO 14001-certified plants also secure a competitive advantage as developers document ESG credentials to access favorable project finance.
Restraints Impact Analysis*
| Restraint | (~) % Impact on CAGR Forecast | Geographic Relevance | Impact Timeline |
|---|---|---|---|
| Volatility in Industrial Metal Prices | -0.6% | North America, with strongest impact on US steel-intensive manufacturing | Short term (≤ 2 years) |
| Persistent Labor Shortages in Skilled Trades | -0.4% | United States and Canada, particularly acute in manufacturing regions | Medium term (2-4 years) |
| Supply-Demand Imbalance of Engineering Plastics | -0.3% | North America, concentrated in automotive and aerospace supply chains | Short term (≤ 2 years) |
| Cybersecurity Vulnerabilities in Connected Components | -0.2% | Global, with heightened concerns in critical infrastructure applications | Long term (≥ 4 years) |
| Source: Mordor Intelligence | |||
Volatility in Industrial Metal Prices
Hot-rolled coil prices fluctuated by 35% in 2024, ranging from USD 600 to USD 900 per ton, significantly impacting cost forecasts for bearings, gears, and housings. To hedge, many suppliers carried higher inventory buffers, tying up working capital and expanding warehouse footprints. The resulting squeeze triggered greater usage of dynamic pricing clauses in contracts-but customers resist frequent price resets, complicating relationship management. Multi-metal components amplify the headache, as aluminum and copper move rarely, synchronizing with steel. Some OEMs now request dual-material quotes, pitting conventional alloys against composite substitutes to mitigate price-swing exposure.
Persistent Labor Shortages in Skilled Trades
U.S. manufacturing reported 3.8 million open skilled positions in 2024 despite a total headcount of 12.9 million. Precision machining firms cite six-month lead times to hire CNC operators, prompting them to invest in automation or pay wage premiums that erode their operating margins. Apprenticeship pipelines exist but need two to three years to mature, leaving a near-term productivity dent. Mid-sized suppliers, lacking the scale to run in-house training, often lag behind diversified conglomerates that already operate accredited learning academies. The talent crunch also triggers acquisition interest in smaller shops mainly for their workforce rather than their book of business, nudging M&A valuations higher.
*Our forecasts treat driver/restraint impacts as directional, not additive. The impact forecasts reflect baseline growth, mix effects, and variable interactions.
Segment Analysis
By Component Type: Bearings Lead While Motion Control Accelerates
Bearings commanded 29.72% of 2024 spending, underscoring their ubiquity in rotating assets across automotive, aerospace, and general machinery lines. Yet motion-control assemblies are on track to log a 5.46% CAGR to 2030, outpacing the broader North America industrial component market as servo motors, drives, and linear actuators become cornerstone elements of flexible manufacturing cells. The North America industrial component market size tied to motion control surpassed USD 28 billion in 2024 and is gaining momentum as manufacturers seek tighter positional accuracy and integrated feedback loops that dovetail with plant-wide IIoT frameworks.
Demand for smart motion stages is evident in Parker-Hannifin’s 18% jump in FY 2024 segment revenue, driven largely by orders from EV and chip-fabrication plants. Meanwhile, mature categories such as power transmission shafts grow in lockstep with MRO cycles, and fasteners receive a volume boost from reshoring-driven greenfield construction. Bearings, though dominant, now compete on a micro-level through differentiators such as ceramic rollers and graphene-infused lubricants, which extend service intervals. Suppliers able to bundle such upgrades with cloud analytics stand to capture outsized wallet share even as average-selling-prices stabilize.


By Material: Metals Dominate While Composites Gain Traction
Metals retained 54.28% share of 2024 component revenue, anchored by steel and aluminum alloys prized for cost-to-strength ratios and ubiquitous machining infrastructure. However, composites are growing at a 4.18% CAGR, thanks to aerospace fuel-burn mandates and industrial electrification, which value lightweight, corrosion-resistant parts. The North America industrial component market share for composites is expected to surpass 12% by 2030 as suppliers leverage additive-manufacturing processes to produce complex geometries that were previously uneconomical in metal.
Boeing’s 787 composite airframe validated the adoption of large-format carbon fiber, emboldening turbine OEMs to specify similar materials for rotors and nacelles. In the industrial realm, carbon-fiber couplings now replace steel on high-speed test benches, delivering higher torque capacity with lower inertial loads. Technical ceramics also win niche demand in semiconductor wet-etch and high-vacuum processes where metallic contamination is unacceptable. Material choice is no longer a simple cost exercise; procurement teams quantify total energy savings and maintenance avoidance when justifying composite premiums.
By End-Use Industry: General Manufacturing Leads Aerospace Growth
General manufacturing secured 31.34% of 2024 revenues, fueled by a wide swath of applications ranging from food-processing conveyors to textile looms. However, the aerospace and defense sector exhibits the fastest trajectory, with a 4.98% CAGR through 2030, propelled by the U.S. Space Force’s USD 29.4 billion 2024 procurement budget for next-generation orbital assets. The North America industrial component market size attributable to the aerospace industry may exceed USD 33 billion by the end of the decade as reusable launch-vehicle projects and supersonic passenger-jet prototypes transition from R&D to limited production.
Electric-vehicle assembly remains a large but maturing pocket; component suppliers now pivot from capacity build-outs to incremental efficiency gains. Oil-and-gas upstream orders fluctuate with Brent pricing, but midstream pipeline expansions and refinery retrofits offer steadier uptake for valves, gaskets, and heat-resistant bearings. Construction machinery is benefiting from tailwinds generated by U.S. infrastructure bill outlays, while utilities are accelerating grid modernization investments that require vibration-damped transformers and high-temperature bushing components. Convergence among these industries is evident: aerospace-grade composites cross-pollinate into wind-turbine blades, and EV thermal-management know-how migrates into data-center cooling skids.
By Distribution Channel: Direct Sales Persist While Digital Platforms Emerge
Direct OEM agreements still govern 46.19% of component shipments, securing design-in positions that typically persist through an equipment model’s lifecycle. However, e-commerce portals are scaling at a 4.12% CAGR, riding a post-pandemic shift toward self-service procurement. The North America industrial component market now records more than USD 22 billion in annual online transactions, and that tally could double by 2030 if digital adoption curves in maintenance departments mirror those already seen in office supplies.
MSC Industrial reported USD 1.2 billion in web sales for FY 2024, a 15% jump year-on-year. Amazon Business also chips away at commodity SKUs by offering same-day fulfillment, forcing legacy distributors to sharpen their value-added services, such as kitting, VMI, and engineering consulting. Hybrid models emerge wherein design-in components flow through direct channels, while maintenance spares migrate to e-marketplaces to exploit real-time stock visibility. Payment-on-delivery and auto-replenishment APIs further entrench digital, and machine builders increasingly embed QR codes on equipment plates that deep-link to recommended spare-part carts.
Geography Analysis
The United States accounted for 78.43% of 2024 revenue, driven by USD 237 billion in manufacturing construction spending, which set a multi-decade record. Federal packages such as the USD 52.7 billion CHIPS Act and USD 1.2 trillion infrastructure bill funnel orders toward high-precision bearings, drives, and vacuum-grade seals destined for fabs, EV battery plants, and clean energy projects. Yet the North America industrial component market faces a drag from 3.8 million vacant skilled-trade roles, which limits capacity ramp-up and elongates lead times.
Canada contributes steady mid-single-digit growth, anchored by resource extraction equipment and automotive platforms, which are clustered in Ontario. Ottawa’s USD 15 billion Critical Minerals Strategy stimulates demand for ruggedized couplings, slurry seals, and mine-haul braking systems across British Columbia and Quebec operations. Cross-border supply chains remain deeply integrated, with roughly 75% of Canadian output supplying U.S. assembly lines, underpinning a predictable order flow for component makers.
Mexico is the fastest-growing geography, projected at a 5.19% CAGR through 2030, as near-shoring relocates labor-intensive electronics and appliance assembly south of the border. Bilateral trade with the United States hit USD 807 billion in 2024, making Mexico Washington’s top trading partner. New industrial parks in Nuevo León and Chihuahua lure tier-1 component vendors with duty-free corridors and proximity to cross-border rail. Although wage inflation inches upward, total landed cost remains favorable, and suppliers leverage Mexico as an export springboard to South America under existing trade frameworks.
Competitive Landscape
Market concentration is moderate: top global brands such as SKF, Timken, NSK, Schaeffler, Parker-Hannifin, and Emerson collectively capture roughly 40% of regional revenue through broad catalogs and deep engineering benches. Their edge increasingly lies in pairing hardware with software suites that unlock predictive maintenance and energy-optimization insights. For instance, Emerson’s 2024 DeltaV release integrated zero-trust cybersecurity to allay rising OT-security concerns.
Acquisition activity intensifies: Parker-Hannifin bought Bosch Rexroth’s North American hydraulics arm for USD 420 million in August 2025, widening its foothold in factory automation. Schaeffler added niche linear-motion specialist Linear Motion LLC for USD 65 million in April 2025 to complement its robotics thrust. Smaller players, such as RBC Bearings and Altra Industrial Motion, pursue specialized niches-airframe ball bearings and high-torque couplings-where switching costs deliver pricing power.
Patent filings for smart components rose 23% in 2024, signaling an R&D arms race. Suppliers courting defense primes must maintain AS 9100 accreditation, while those eyeing renewables invest in LCA documentation to meet developer ESG screens. As the North America industrial component market pivots toward composite parts, expect partnerships between chemical firms and machine-builders to proliferate, mirroring alliances already common in aerospace.
North America Industrial Component Industry Leaders
SKF AB
Timken Company
Emerson Electric Co.
Parker-Hannifin Corporation
Regal Rexnord Corporation
- *Disclaimer: Major Players sorted in no particular order

Recent Industry Developments
- September 2025: SKF unveiled a USD 180 million IIoT-ready bearing plant in Austin, Texas, slated for completion in 2027 and expected to create 350 jobs.
- August 2025: Parker-Hannifin wrapped up its USD 420 million purchase of Bosch Rexroth’s regional hydraulics unit, adding 1,200 staff.
- July 2025: Timken secured a USD 95 million, multi-year U.S. DoD deal for precision bearings used in B-21 and F-35 airframes.
- June 2025: Emerson Electric has earmarked USD 125 million to expand its Ohio servo-motor plant for semiconductor and pharmaceutical equipment.


North America Industrial Component Market Report Scope
| Bearings |
| Power Transmission Shafts |
| Gears |
| Fasteners |
| Seals and Gaskets |
| Motion Control Components |
| Metals |
| Polymers |
| Composites |
| Technical Ceramics |
| General Manufacturing |
| Automotive and EV |
| Aerospace and Defense |
| Oil and Gas |
| Construction Machinery |
| Energy and Utilities |
| Direct OEM Sales |
| Industrial Distributors |
| Online Platforms |
| United States |
| Canada |
| Mexico |
| By Component Type | Bearings |
| Power Transmission Shafts | |
| Gears | |
| Fasteners | |
| Seals and Gaskets | |
| Motion Control Components | |
| By Material | Metals |
| Polymers | |
| Composites | |
| Technical Ceramics | |
| By End-Use Industry | General Manufacturing |
| Automotive and EV | |
| Aerospace and Defense | |
| Oil and Gas | |
| Construction Machinery | |
| Energy and Utilities | |
| By Distribution Channel | Direct OEM Sales |
| Industrial Distributors | |
| Online Platforms | |
| By Country | United States |
| Canada | |
| Mexico |


Key Questions Answered in the Report
How big is the North America industrial component market in 2025?
It is valued at USD 146.01 billion and projected to reach USD 176.89 billion by 2030.
Which component category is growing the fastest?
Motion-control assemblies are forecast to expand at a 5.46% CAGR through 2030 on the back of automation upgrades.
Why is Mexico’s growth outpacing the United States?
Near-shoring of labor-intensive assembly and sustained foreign direct investment push Mexico toward a 5.19% CAGR.
What role does IIoT play in component demand?
Smart, sensor-embedded parts cut maintenance costs and shift suppliers toward recurring revenue models via data services.
How are metal-price swings affecting suppliers?
Price volatility compresses margins, prompting dynamic pricing clauses and greater interest in composite alternatives.
Which distribution channel is gaining share fastest?
Online platforms, including industrial e-commerce portals, are growing at a 4.12% CAGR as buyers seek rapid, self-service ordering.
Page last updated on:


