North America Fixed Broadband Market Size and Share
Market Overview
| Study Period | 2019 - 2030 |
|---|---|
| Forecast Data Period | 2025 - 2030 |
| Historical Data Period | 2019 - 2023 |
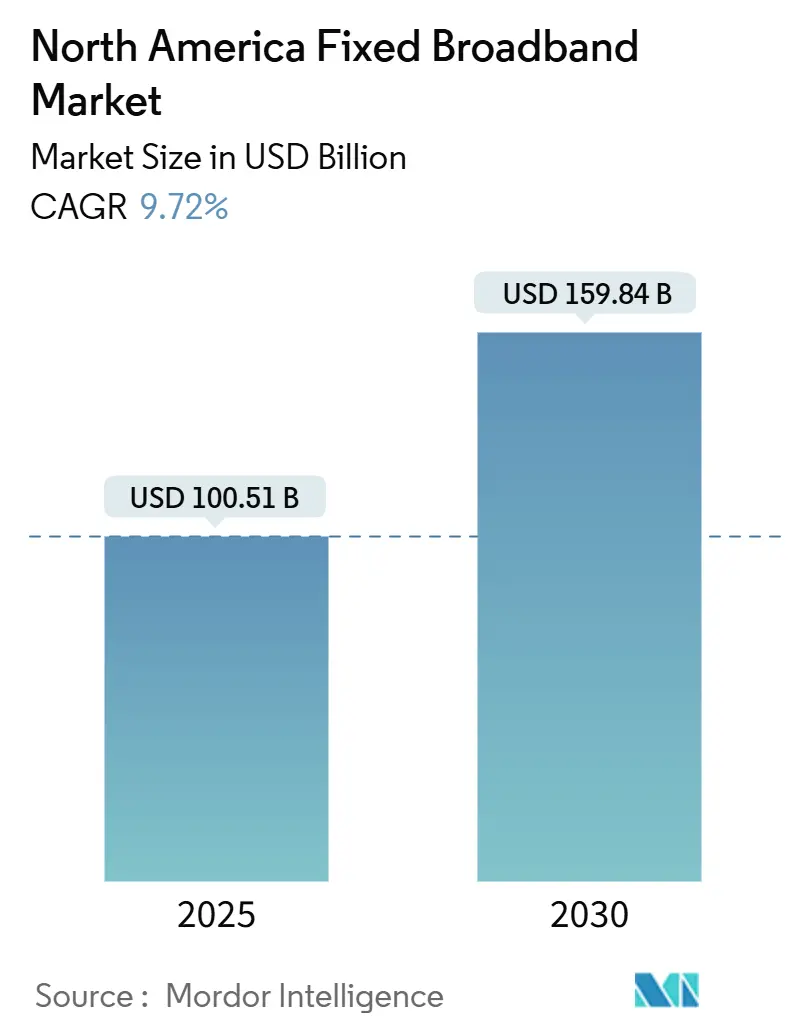
| Market Size (2025) | USD 100.51 Billion |
| Market Size (2030) | USD 159.84 Billion |
| Growth Rate (2025 - 2030) | 9.72% CAGR |
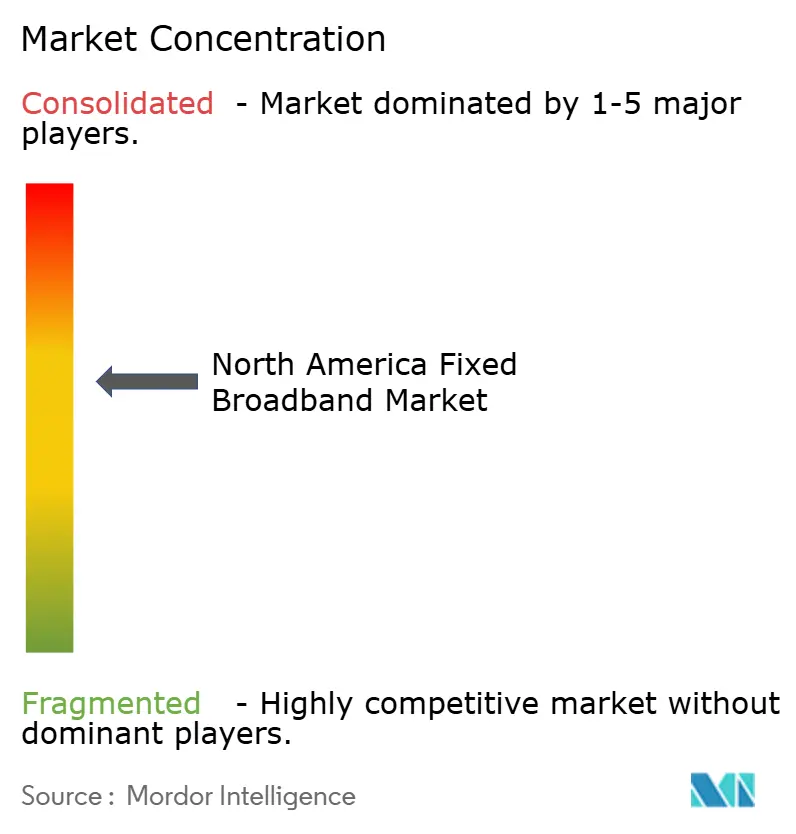
| Market Concentration | Medium |
Major Players *Disclaimer: Major Players sorted in no particular order Image © Mordor Intelligence. Reuse requires attribution under CC BY 4.0. | |
North America Fixed Broadband Market Analysis by Mordor Intelligence
The North America Fixed Broadband Market size is estimated at USD 100.51 billion in 2025, and is expected to reach USD 159.84 billion by 2030, at a CAGR of 9.72% during the forecast period (2025-2030). Rising 4K/8K streaming, cloud gaming, and hybrid work traffic are pushing operators to treat broadband as critical infrastructure rather than a discretionary utility, while the USD 42.5 billion BEAD program is accelerating rural broadband builds. [1]National Telecommunications and Information Administration, “BEAD Program State Allocations,” ntia.doc.govThe intensification of fiber-to-the-home (FTTH) rollouts by telcos, DOCSIS 4.0 upgrades by cable operators, and the rapid scaling of fixed-wireless offerings are reshaping service economics and competitive boundaries. Ongoing consolidation, exemplified by Verizon’s acquisition of Frontier, signals a strategic pivot toward asset-heavy footprints that can deliver multi-gigabit speeds reliably. At the same time, spectrum liberalization in the CBRS and C-band is lowering entry barriers for fixed-wireless ISPs, spurring price and service innovation across suburban and rural areas.
Key Report Takeaways
- By technology, Cable DOCSIS led the North America fixed broadband market with a 46.34% share in 2024, whereas FTTH/B is projected to grow at a 16.10% CAGR through 2030.
- By speed tier, the 100 Mbps–1 Gbps bracket held 61.08% of the North America fixed broadband market share in 2024, while above-1 Gbps tiers are projected to advance at a 11.29% CAGR through 2030.
- By end user, residential services accounted for 85.50% of the North America fixed broadband market size in 2024; commercial connections are forecast to expand at a 11.51% CAGR between 2025 and 2030.
- By application, the video streaming and entertainment segment captured 67.35% of the North America fixed broadband market size in 2024; however, smart-home and IoT traffic is the fastest-growing slice, with a 15.43% CAGR through 2030.
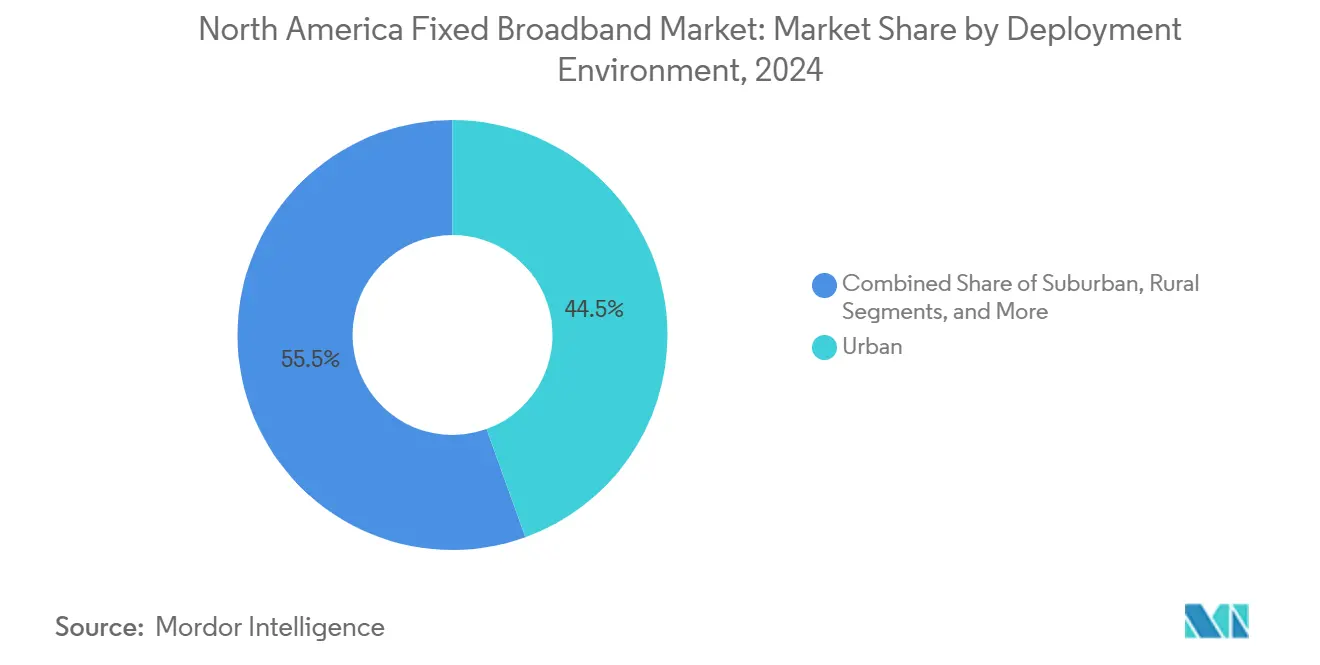
- By deployment environment, the urban segment captured 44.49% of the North America fixed broadband market size in 2024; however, the rural segment is the fastest-growing slice, with a 11.04% CAGR through 2030.
- By ownership, cable MSOs retained 44.98% of subscribers in 2024, while fixed-wireless ISPs are the fastest-growing, with a 14.72% CAGR through 2030.
- By country, the United States accounted for 85.14% of revenue in 2024 and is projected to grow at 10.26% through 2030.
Note: Market size and forecast figures in this report are generated using Mordor Intelligence’s proprietary estimation framework, updated with the latest available data and insights as of January 2026.
Proportional positioning is established by comparing regional contributions against the global total, including that of North america. The fixed broadband market share in our global report expresses these relative weights.
North America Fixed Broadband Market Trends and Insights
Drivers Impact Analysis*
| Driver | (~) % Impact on CAGR Forecast | Geographic Relevance | Impact Timeline |
|---|---|---|---|
| Explosive Bandwidth Demand Driven by 4K/8K Video-streaming and Cloud Gaming Adoption | +2.1% | North America-wide, concentrated in urban centers | Short term (≤ 2 years) |
| BEAD and Other Public-funded Rural Fiber Programs Unlock >USD 40 Billion in Builds | +1.8% | Rural and underserved areas across US states | Medium term (2-4 years) |
| Aggressive FTTH Roll-outs by Incumbent Telcos and Competitive Over-builders | +1.5% | Suburban markets, secondary cities | Medium term (2-4 years) |
| Cable MSOs’ DOCSIS 4.0/High-split Upgrades Sustaining Multi-gig Speeds | +1.2% | Established cable territories, urban/suburban | Short term (≤ 2 years) |
| CBRS/C-band Spectrum Sharing is Lowering Entry Barriers for Fixed-wireless ISPs | +0.9% | Rural and suburban areas with limited fiber | Short term (≤ 2 years) |
| Municipal Open-access Dark-fiber Networks Catalyze Wholesale Competition | +0.7% | Progressive municipalities, primarily in western states | Long term (≥ 4 years) |
| Source: Mordor Intelligence | |||
Explosive Bandwidth Demand Drives Infrastructure Acceleration
North American households reached 67% 4K streaming penetration in 2024, and cloud-gaming platforms now expect 100 Mbps symmetrical connectivity. Operators therefore prioritize capacity in dense metros even as subscriber growth plateaus. Multi-gigabit tiers are contributing a growing share of gross adds, which is lifting the average revenue per user and accelerating the return on fiber builds. Bandwidth-intensive augmented-reality workplaces, expected to arrive by 2027, could render hybrid fiber-coax networks obsolete sooner than planned, prompting incumbents to pursue deeper fiber penetration.
Federal BEAD Program Reshapes Rural Economics
The USD 42.5 billion BEAD pool allocates USD 3.3 billion to Texas and USD 1.9 billion to California, directing capital toward historically underserved areas. Fiber-first rules reward telcos with pole-ownership advantages, while satellite and fixed-wireless players face subsidy exclusion. Early deployments reveal pole-attachment and permitting logjams that threaten 2026 service deadlines, but the sheer volume of funds is transforming vendor backlogs, training programs, and supply-chain priorities nationwide.
Incumbent Telcos Accelerate Fiber Overbuilding
AT&T is transitioning from copper line maintenance to an aggressive fiber network expansion, aiming to reach 50 million fiber locations by 2029. This strategic shift directly challenges cable operators in suburban areas previously considered uncontested. In 2024, Verizon completed a USD 20 billion acquisition of Frontier, consolidating rural fiber assets and removing a competitive overbuilder. This development signals market progression toward infrastructure-based competition rather than service differentiation. The telco fiber expansion is exerting pricing pressure in multi-dwelling unit markets, where cable operators have historically maintained a dominant market share of 70% or more through exclusive building agreements. The competitive landscape is increasingly favoring operators with the most extensive fiber penetration over those with broader coverage footprints.
DOCSIS 4.0 Extends Cable Technology Lifecycle
Cable operators are deploying DOCSIS 4.0 to deliver 25 Gbps downstream capacity via existing coaxial infrastructure, extending their competitiveness against fiber until 2030. Charter Communications and Comcast's investment in Broadcom's unified chipset reduces upgrade costs and accelerates deployment across 65 million subscribers. However, DOCSIS 4.0's upstream limitations and shared bandwidth design challenge its viability in commercial and high-density residential areas, where dedicated fiber offers better performance. Its success hinges on maintaining subscriber density as fiber overbuilders target cable's most profitable segments.
Restraints Impact Analysis*
| Restraint | (~) % Impact on CAGR Forecast | Geographic Relevance | Impact Timeline |
|---|---|---|---|
| Fiber Build CAPEX Inflation and Skilled-labor Shortages | -1.4% | National, acute in rural and mountainous regions | Medium term (2-4 years) |
| Utility Pole-attachment Backlogs Slow Last-mile Deployments | -0.8% | States with complex utility regulations | Short term (≤ 2 years) |
| Landlord Push-back on MDU Rewiring Limits Addressable FTTH Market | -0.6% | Urban centers with high rental concentrations | Long term (≥ 4 years) |
| Edge-compute Off-load Lowers Home-broadband Traffic Growth in Dense Metros | -0.4% | Major metropolitan areas | Long term (≥ 4 years) |
| Source: Mordor Intelligence | |||
Construction Cost Inflation Constrains Deployment Velocity
In 2024, fiber construction costs increased by 23% year-over-year, primarily due to material inflation and a shortage of skilled splicing technicians in North America. Labor bottlenecks persist, as technician training typically requires 12 to 18 months, limiting the availability of immediate solutions. Rural deployment in mountainous areas costs USD 15,000-25,000 per pass, making the BEAD program's economics challenging, even with 75% federal subsidies.[2]Fiber Broadband Association, “Industry Construction Cost Analysis,” fiberbroadband.org These cost pressures favor large-scale operators with established contractor networks over smaller, competitive overbuilders attempting to enter the market.
Utility Pole Access Creates Deployment Bottlenecks
As of 2024, the FCC's "One Touch Make Ready" policy, intended to streamline pole attachment processes, has been inconsistently implemented across states. This disparity has resulted in deployment delays, extending project timelines by 6 to 12 months. Utility companies, citing concerns over liability and infrastructure safety, particularly in regions prone to extreme weather, have been reluctant to expedite approval for attachments. Nationwide, the backlog of pending attachment applications has reached 180,000, with a notable concentration in states such as California and Florida, where stringent environmental regulations add further complexity to the approval process.[3]Federal Communications Commission, “Broadband Infrastructure Policies,” fcc.gov These regulatory challenges disproportionately affect smaller ISPs, which often lack the necessary legal resources to effectively navigate the complex approval processes.
*Our forecasts treat driver/restraint impacts as directional, not additive. The impact forecasts reflect baseline growth, mix effects, and variable interactions.
Segment Analysis
By Technology: Fiber Gains Ground Against Cable Dominance
Cable DOCSIS held 46.34% of the North America fixed broadband market in 2024, but FTTH/B is projected to track a 16.10% CAGR through 2030. The North America fixed broadband market size for FTTH is expected to surpass cable revenue within the next five years, if current momentum continues. Satellite adds resilience to remote areas, with over 2 million Starlink users, while fixed-wireless exploits CBRS spectrum to reach subscribers without incurring trenching costs.
Fiber’s symmetrical speeds and latency assure cloud workflow consistency, a key differentiator as hybrid work persists. Cable’s DOCSIS 4.0 roadmap buys time but not immunity from defection when fiber appears down the street. Declining DSL lines illustrate the copper sunset, whereas fixed-wireless suits low-density terrain where buried glass remains uneconomic.


By Speed Tier: Multi-Gigabit Adoption Accelerates Premium Migration
The 100 Mbps-1 Gbps tier represented 61.08% of the North America fixed broadband market share in 2024; however, above-1 Gbps services are growing at a 11.29% CAGR. Charter reports 40% of new fiber adds choosing 2-Gbps or higher plans. Transparent broadband labels now reveal actual upload speeds, nudging creators and remote workers toward multi-gigabit packages.
Low-speed (< 25 Mbps) tiers primarily exist in subsidy-free rural areas and will be phased out from BEAD-funded builds. As latency-sensitive gaming, telepresence, and edge AI applications proliferate, operators differentiate themselves on jitter and packet loss rather than raw downstream speeds. Capacity planning must incorporate symmetrical traffic profiles that legacy shared-medium cable struggles to deliver.
By End User: Commercial Segment Drives Revenue Intensity Growth
Residential lines still dominate value at 85.50%, but the commercial slice is pacing at 11.51% CAGR as small offices, co-working hubs, and SOHO professionals insist on 99.99% uptime. Comcast Business delivered 8.2% year-over-year revenue growth in Q3 2024 on the back of SLA-backed fiber circuits. Dedicated connections command ARPU premiums that offset slowing household growth.
Hybrid work diffuses enterprise connectivity out of tower blocks and into neighborhoods, redirecting backhaul architectures toward node densification. Competitive fiber providers find footholds by guaranteeing 24-hour repair windows, while cable MSOs aim to preserve share through bundled security and SD-WAN solutions. Commercial churn remains low, given the complexity of switching, which underpins predictable cash flows for lenders financing new builds.
By Application: Smart Home IoT Emerges as Growth Driver
Video streaming accounted for 67.35% of network load in 2024, but smart-home and IoT traffic is outpacing it at a 15.43% CAGR through 2030. Always-on sensors and cameras create small but relentless streams that accumulate at scale, forcing operators to enhance upstream capacity even for consumer plans.
Remote Work and Cloud Collaboration applications have stabilized post-pandemic but continue to sustain demand, preventing reductions in capacity investments. Latency-sensitive Online Gaming and Immersive Media applications drive fiber adoption over cable infrastructure. Telehealth and Distance Learning applications prioritize network redundancy and backup power systems to ensure regulatory compliance and maintain service reliability.
By Deployment Environment: Rural Investment Reshapes Geographic Priorities
Urban networks collected 44.49% of the 2024 revenue, yet BEAD funding shifts 11.04% of the growth toward rural towns, where previous return models had failed. The North America fixed broadband market size attributed to rural counties could double by 2030 if subsidy schedules hold. Subsidized fiber undermines satellite’s cost advantage, though Starlink remains pivotal for farms and wilderness areas beyond pole reach.
Suburbs become the new battleground as fiber overbuilders plant greenfield ducts parallel to aging coax. Remote locations rely on satellite for disaster recovery links and interim capacity until terrestrial projects are established. This geographic rebalancing forces operators to rethink marketing, truck-roll logistics, and community engagement strategies.
By Ownership: Fixed-Wireless ISPs Challenge Traditional Boundaries
Cable MSOs commanded 44.98% of subscribers in 2024, but fixed-wireless is the fastest-growing segment at a 14.72% CAGR, with T-Mobile alone surpassing 5.6 million customers. CBRS and C-band spectrum enable kilometer-scale coverage with modest tower upgrades, allowing challengers to cherry-pick census blocks where cable’s N+0 upgrades lag.
Incumbent telcos leverage deep fiber footprints and rights-of-way, while competitive fiber specialists focus on underserved zip codes, offering low-touch customer service. Municipal networks explore open-access models to share dark fiber with retailers, creating wholesale economics that threaten vertically integrated incumbents.
Geography Analysis
The United States held 85.14% of the North America fixed broadband market in 2024 and is growing at a rate of 10.26% annually, propelled by BEAD dollars funneled through state broadband offices. Competitive intensity is rising as fiber overbuilders target exurban clusters, and fixed-wireless ISPs leverage recently liberated spectrum to reach farmsteads without the need for trenching.
Canada ranks second, with Rogers, Bell, and Telus vying for densification grants in northern communities. Rogers’ 2024 Shaw acquisition consolidated western cable assets, raising regulatory ire over regional market power. The Canadian Radio-television and Telecommunications Commission enforces wholesale access on incumbent networks, enabling niche ISPs to resell gigabit tiers at regulated margins.
Mexico is catching up through public-private partnerships that support fiber corridors in underserved states. Totalplay’s expansion and Telmex’s response are improving urban links, while mountainous terrain still deters capex without federal backing. Ongoing telecom reforms aim to dilute incumbent dominance and tighten service-quality metrics, but execution hinges on political stability and budget continuity.
Mordor Intelligence examines the fixed broadband market across diverse other regional markets as well, including Europe, Asia, and Middle East.
Competitive Landscape
Roughly 65% of subscribers sit with the top five operators, giving the North America fixed broadband market a moderately consolidated shape. Comcast and Charter rely on DOCSIS 4.0 upgrades to shield suburban territories, whereas telcos AT&T and Verizon are pouring capex into symmetric multi-gigabit fiber. Fixed-wireless disruptors, such as T-Mobile, leverage their 5G macrocells to attract cord-cutters seeking contract-free plans.
Starlink transformed rural economics by offering self-install kits and low-Earth orbit coverage, reducing wait times from years to weeks. Municipal dark-fiber consortia erode entry barriers for overbuilders who prefer opex-light leasing models to greenfield trenching. The FCC’s pro-build stance incentivizes facilities-based newcomers and discourages resale-only arbitrage, nudging the market toward ownership diversity rooted in true infrastructure spend.
Capital markets reward firms that secure long-term debt tied to fiber assets, as those networks exhibit lower churn and higher EBITDA margins than legacy coax. Consequently, asset swaps and mergers, and acquisitions (M&A) are likely to continue as players seek contiguous footprints and economies of scale.
North America Fixed Broadband Industry Leaders
Comcast Corporation
Charter Communications, Inc.
AT&T Inc.
Verizon Communications Inc.
Cox Communications, Inc.
- *Disclaimer: Major Players sorted in no particular order

Recent Industry Developments
- January 2025: Charter began offering commercial DOCSIS 4.0 service in five metro areas, featuring 10 Gbps down/6 Gbps up plans designed for remote creatives.
- September 2024: Verizon completed its USD 20 billion acquisition of Frontier Communications, integrating rural fiber assets across 25 states.
- September 2024: Comcast and Charter jointly invested in Broadcom’s DOCSIS 4.0 chipset program to cut upgrade costs.
- July 2024: T-Mobile’s fixed-wireless subscriber base surpassed 5.6 million, highlighting rapid scale without trenching.


North America Fixed Broadband Market Report Scope
| Fiber to the Home / Premises (FTTH/B) |
| Cable (DOCSIS) |
| Digital Subscriber Line (DSL) and Copper |
| Fixed Wireless Access (5G/LTE) |
| Satellite Broadband |
| Up to 25 Mbps |
| 100 Mbps - 1 Gbps |
| Above 1 Gbps (Multi-Gig) |
| Residential |
| Commercial |
| Video Streaming and Entertainment |
| Online Gaming and Immersive Media |
| Remote Work and Cloud Collaboration |
| Smart Home and IoT Connectivity |
| Telehealth and Distance Learning |
| Industrial and Enterprise Automation |
| Urban |
| Suburban |
| Rural |
| Remote and Hard-to-Reach |
| Incumbent Telcos |
| Competitive Fiber Overbuilders |
| Cable Multiple System Operators (MSOs) |
| Fixed Wireless ISPs |
| Satellite Network Operators |
| United States |
| Canada |
| Mexico |
| By Technology | Fiber to the Home / Premises (FTTH/B) |
| Cable (DOCSIS) | |
| Digital Subscriber Line (DSL) and Copper | |
| Fixed Wireless Access (5G/LTE) | |
| Satellite Broadband | |
| By Speed Tier | Up to 25 Mbps |
| 100 Mbps - 1 Gbps | |
| Above 1 Gbps (Multi-Gig) | |
| By End User | Residential |
| Commercial | |
| By Application | Video Streaming and Entertainment |
| Online Gaming and Immersive Media | |
| Remote Work and Cloud Collaboration | |
| Smart Home and IoT Connectivity | |
| Telehealth and Distance Learning | |
| Industrial and Enterprise Automation | |
| By Deployment Environment | Urban |
| Suburban | |
| Rural | |
| Remote and Hard-to-Reach | |
| By Ownership | Incumbent Telcos |
| Competitive Fiber Overbuilders | |
| Cable Multiple System Operators (MSOs) | |
| Fixed Wireless ISPs | |
| Satellite Network Operators | |
| By Country | United States |
| Canada | |
| Mexico |


Key Questions Answered in the Report
How large is the North America fixed broadband market in 2025?
It totals USD 100.51 billion and is projected to reach USD 159.84 billion by 2030.
What technology is growing fastest in fixed broadband across North America?
Fiber-to-the-home is expanding at a 16.10% CAGR, outpacing cable and fixed-wireless options.
Which speed tier has the greatest growth momentum?
Multi-gigabit plans above 1 Gbps are forecast to grow at 11.29% annually through 2030.
How will the BEAD program influence rural connectivity?
USD 42.5 billion in federal subsidies is accelerating fiber builds, narrowing the rural-urban digital gap.
What role does fixed-wireless play in broadband competition?
Fixed-wireless ISPs like T-Mobile are scaling quickly by leveraging CBRS and C-band spectrum, growing at a 14.72% CAGR.
Which U.S. states receive the largest BEAD allocations?
Texas leads with USD 3.3 billion, followed by California with USD 1.9 billion.
Page last updated on:


