
North America Customer Journey Analytics Market Size and Share
Market Overview
| Study Period | 2020 - 2031 |
|---|---|
| Forecast Data Period | 2026 - 2031 |
| Base Year Market Size (2025) | USD 7.35 Billion |
| Market Size (2026) | USD 8.80 Billion |
| Market Size (2031) | USD 21.56 Billion |
| Growth Rate (2026 - 2031) | 19.64 % |
| Market Concentration | Medium |
Major Players *Disclaimer: Major Players sorted in no particular order Image © Mordor Intelligence. Reuse requires attribution under CC BY 4.0. | |
North America Customer Journey Analytics Market Analysis by Mordor Intelligence
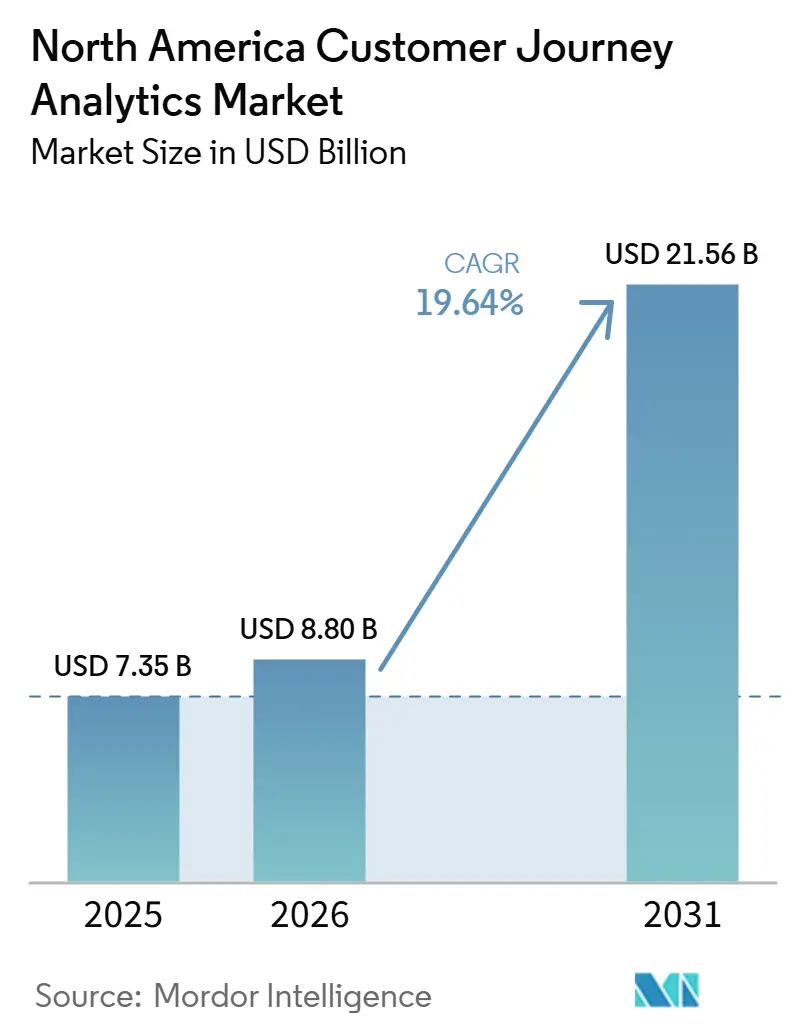
The North America customer journey analytics market size is projected to expand from USD 7.35 billion in 2025 and USD 8.80 billion in 2026 to USD 21.56 billion by 2031, registering a CAGR of 19.64% between 2026 and 2031. Growth in the North America customer journey analytics market is being driven by a clear shift from reporting-focused analytics to systems that support real-time decision-making across marketing, sales, and service environments. Demand is also rising because enterprises want a single, consistent view of customer behavior across websites, apps, contact centers, and offline channels, and this need is making journey intelligence more central to operating models. The North America customer journey analytics market is also benefiting from strong cloud adoption, as cloud delivery aligns with the constant updates, elastic computing needs, and broader integration demands of AI-enabled platforms. At the same time, the market is being pulled forward by spending on orchestration, retention, and personalization use cases, while SMEs, healthcare, and life sciences, and Mexico are expanding faster than older demand centers. Growth still faces friction from privacy compliance, consent governance, and the cost of integrating journey tools with legacy CRM, ERP, and contact center stacks, but those same constraints are also pushing buyers toward more mature platforms and stronger services support.
Key Report Takeaways
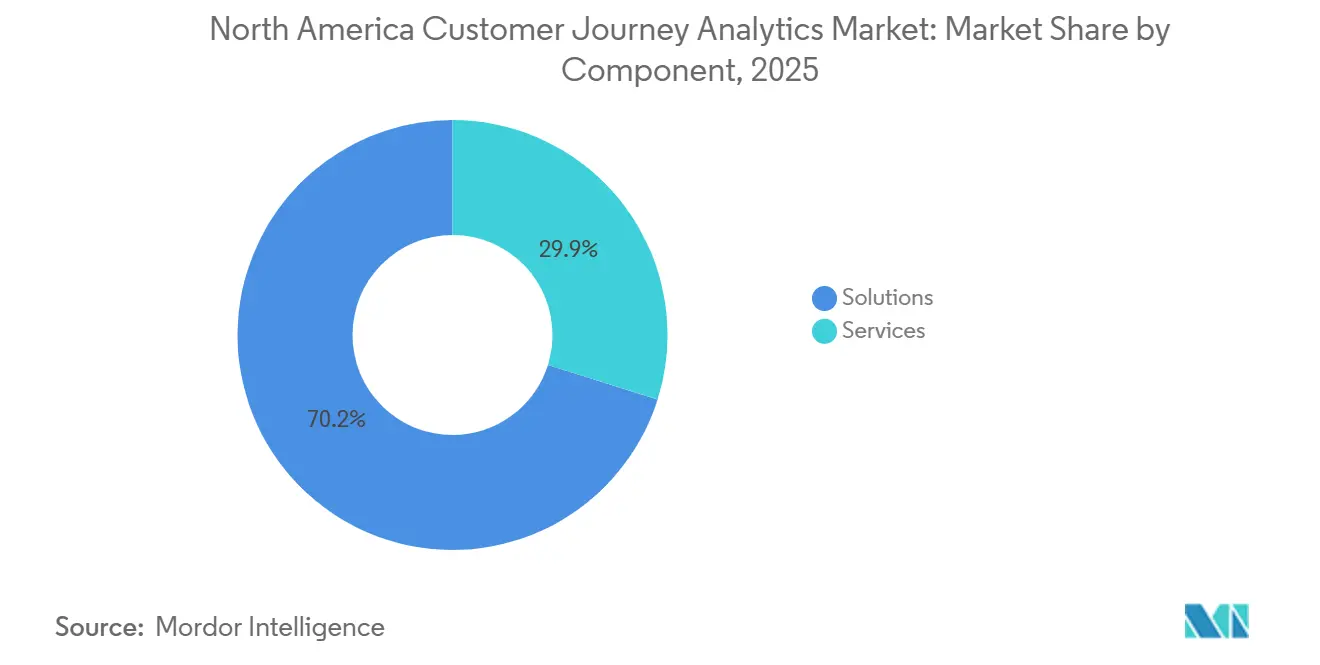
- By component, solutions held 70.15% of the North America customer journey analytics market in 2025, while services are projected to expand at a 22.59% CAGR through 2031.
- By deployment mode, cloud accounted for 65.29% share of the North America customer journey analytics market in 2025 and is expected to remain the fastest-growing model with a 22.09% CAGR through 2031.
- By application, journey mapping and visualisation represented 58.11% of the North America customer journey analytics market revenue in 2025, while campaign and journey orchestration is projected to grow at a 21.43% CAGR through 2031.
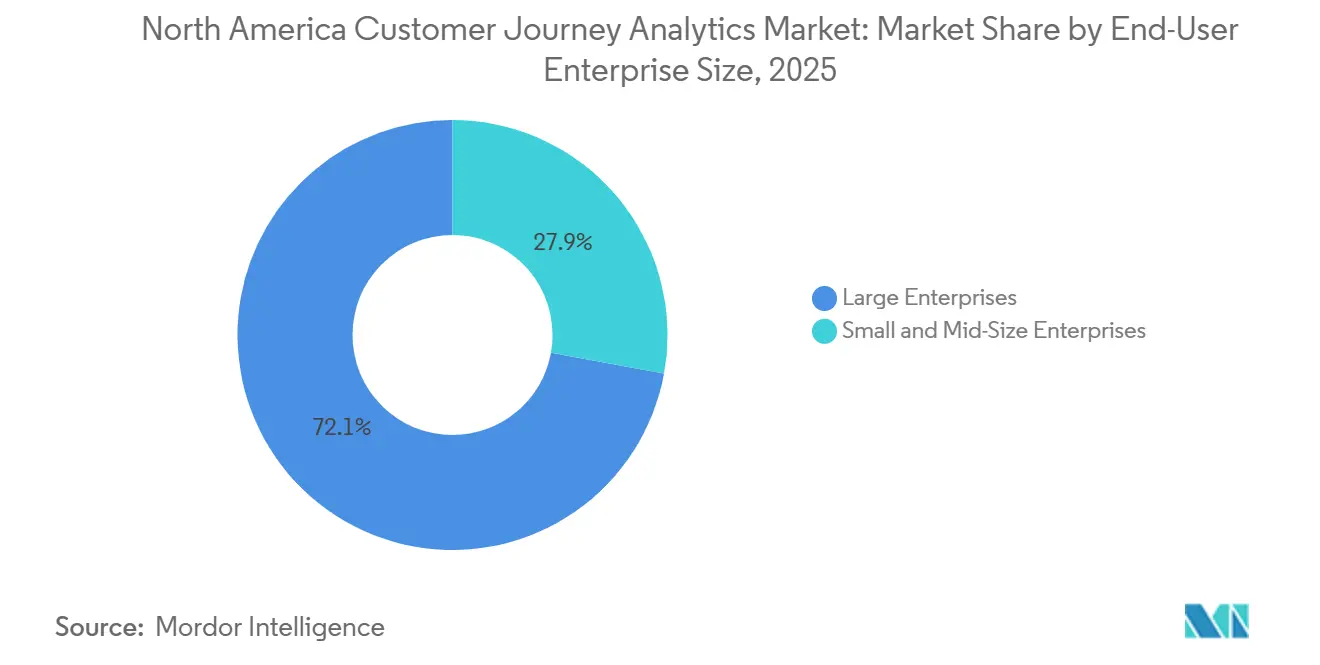
- By end-user enterprise size, large enterprises captured 72.14% of the market in 2025, while SMEs are projected to record the highest growth at a 22.38% CAGR through 2031.
- By end-user industry, retail and eCommerce led the North America customer journey analytics market with 28.44% of revenue in 2025, while healthcare and life sciences are expected to expand at a 21.05% CAGR through 2031.
- By geography, the United States held 64.31% of the North America customer journey analytics market share in 2025, while Mexico is projected to post the fastest growth at a 21.77% CAGR through 2031.
Note: Market size and forecast figures in this report are generated using Mordor Intelligence’s proprietary estimation framework, updated with the latest available data and insights as of January 2026.
North America Customer Journey Analytics Market Trends and Insights
Drivers Impact Analysis*
| Driver | (~) % Impact on CAGR Forecast | Geographic Relevance | Impact Timeline |
|---|---|---|---|
| Acceleration of AI-Driven Journey Insights | +5.2% | Global, concentrated in US enterprise and SaaS sectors | Short term (≤ 2 years) |
| Rising Demand for Unified Customer Visibility | +4.1% | US and Canada, expanding into Mexico as nearshoring accelerates | Medium term (2-4 years) |
| Omnichannel Experience Personalization Requirements | +3.8% | US, Canada, and Mexico across retail, financial services, and eCommerce | Medium term (2-4 years) |
| Real-Time Churn Reduction and Retention Prioritization | +2.9% | US, Canada, and Mexico across SaaS, telecom, healthcare, and retail | Short term (≤ 2 years) |
| Privacy-First Analytics Architecture Adoption | +2.1% | US and Canada, with California and Quebec shaping standards | Medium term (2-4 years) |
| Expansion of Journey Analytics Into Revenue Operations | +1.8% | US enterprise and Canada B2B environments | Long term (≥ 4 years) |
| Source: Mordor Intelligence | |||
Acceleration of AI-Driven Journey Insights
Agentic AI is pushing the North America customer journey analytics market into a more execution-focused phase, because enterprises now expect platforms to recommend and trigger actions rather than only explain what happened. That change matters because journey data is no longer being used only after a campaign or service event ends, and buyers increasingly want systems that can react while the interaction is still active. Adobe made this shift more visible when it launched the Customer Journey Analytics B2B Edition and expanded the role of journey intelligence across broader experience workflows, demonstrating how analytics is being tied more closely to account- and stakeholder-level decisioning. Salesforce reinforced the same direction when it launched Agentforce 3 and highlighted autonomous resolution, observability, and broader language support, all of which point to customer journeys being interpreted and acted on with less human delay. The practical effect on the North America customer journey analytics market is that each AI-assisted interaction generates more behavioral data, thereby increasing the value of platforms that can organize and govern signals across channels. Over time, this is moving competition toward model quality, orchestration speed, and governance depth, rather than simple dashboard breadth.
Rising Demand for Unified Customer Visibility
The North America customer journey analytics market is also expanding because many enterprises still struggle to connect customer behavior across websites, mobile apps, commerce systems, contact centers, and offline transactions into one usable view. That problem has become harder to ignore because AI-driven recommendations are only as strong as the quality and continuity of the underlying identity and event data. Adobe addressed this issue in June 2025 when it introduced the Customer Journey Analytics B2B Edition, with account-level, buying group-level, and opportunity-level analysis, extending unified visibility into complex enterprise buying environments beyond consumer journeys. NICE also moved in this direction by tightening integration with Salesforce Data Cloud, as zero-copy access reduces the need to duplicate records across systems and helps organizations work with connected data without adding another layer of movement and reconciliation.[1] The need for unified visibility is therefore not a reporting preference; it is becoming a basic operating requirement for enterprises that want consistent personalization, retention workflows, and cross-functional customer accountability. As that requirement spreads, the North America customer journey analytics market is favoring vendors that can span multiple data environments rather than remain isolated within a single function.
Omnichannel Experience Personalization Requirements
Personalization requirements continue to drive the North America customer journey analytics market, as enterprises are under pressure to make interactions feel connected across digital and assisted channels. This need is no longer limited to marketing teams, because service, commerce, product, and loyalty functions all rely on understanding where a customer has been, what they attempted, and where friction appeared. SAP and Google Cloud expanded their partnership in April 2026 to deploy multi-agent AI for customer experience orchestration, and that move showed how personalization logic is being embedded directly into operating systems that already hold inventory, order, and interaction history. Contentsquare added journey signal capture from websites, mobile apps, AI assistants, and support conversations in March 2026, reflecting the widening range of channels enterprises now need to monitor to get a complete picture of intent and drop-off. As more touchpoints become measurable, buyers are looking for journey tools that can connect behavior across channels instead of optimizing each environment in isolation. This is one reason the North America customer journey analytics market is shifting spending from static mapping toward always-on orchestration and cross-channel intervention.
Real-Time Churn Reduction and Retention Prioritization
Churn reduction remains one of the strongest short-term spending triggers in the North America customer journey analytics market because retention use cases often show business value faster than broader transformation programs. Enterprises can usually connect a missed renewal, a failed onboarding path, or a service escalation to specific behaviors, making real-time journey monitoring easier to justify than larger, slower analytics rollouts. Salesforce highlighted this logic through Agentforce 3, citing cases where autonomous handling reduced administrative workload and improved customer outcomes, which supports the case for faster intervention based on live journey signals. Medallia and Ada also moved in this direction in January 2026 by combining experience intelligence with an AI-native platform to turn signals into automated action across self-service and live support environments. This matters because once a buyer uses journey analytics for churn prevention, the same platform often expands into campaign triggers, service design, and revenue follow-up. That expansion path gives the North America customer journey analytics market a broader base of recurring demand than a pure reporting tool would.
Restraints Impact Analysis*
| Restraint | (~) % Impact on CAGR Forecast | Geographic Relevance | Impact Timeline |
|---|---|---|---|
| High Integration Complexity with Legacy Data Stacks | -3.2% | US enterprise, with spillover into Canada across banking, telecom, and healthcare | Long term (≥ 4 years) |
| Privacy and Consent Management Constraints | -2.4% | US and Canada, especially California and Quebec | Medium term (2-4 years) |
| High Total Cost of Ownership for Enterprise Rollouts | -1.9% | US mid-market and large enterprise, and Canada across retail and financial services | Medium term (2-4 years) |
| Shortage of Journey Analytics Implementation Talent | -1.4% | North America wide, especially outside major US technology hubs | Long term (≥ 4 years) |
| Source: Mordor Intelligence | |||
High Integration Complexity with Legacy Data Stacks
Integration remains the most stubborn operating restraint in the North America customer journey analytics market because many buyers still manage disconnected CRM, ERP, commerce, service, and contact center environments built over several technology cycles. The challenge is not only technical, as each system often has its own ownership rules, custom workflows, and definitions of the customer record. NICE responded to this issue in August 2025 by expanding integration with Salesforce Service Cloud and Data Cloud, including zero-copy bidirectional access, which directly addressed one of the biggest causes of deployment delay and duplicated data movement. Even with better connectors, many organizations still need long implementation windows before journey analytics becomes operationally reliable, and this slows adoption among mid-sized companies that lack dedicated engineering teams. The effect on the North America customer journey analytics market is that procurement often favors vendors with stronger services, proven connector libraries, and clearer migration paths rather than the broadest feature list. This is also why services are growing faster than solutions, because buyers frequently need ongoing integration support after the initial deployment goes live.
Privacy and Consent Management Constraints
Privacy rules are slowing some programs in the North America customer journey analytics market because cross-channel behavior tracking now sits inside a tighter consent and governance environment. Companies can no longer assume that collecting more events automatically leads to better analytics, since poorly designed consent flows and uncontrolled data use can raise operational and legal risk. OneTrust noted that 2026 changes linked to consent, consumer rights, and AI governance are pushing organizations to design privacy controls into customer data flows earlier in the implementation process. This changes how platforms are selected, because buyers increasingly want identity management, consent handling, and automated decision oversight to sit close to journey analytics rather than in a separate compliance layer. It also limits how aggressively some firms expand personalization, especially in sectors handling sensitive financial, health, or household data. As a result, vendors in the North America customer journey analytics market are under greater pressure to demonstrate not only analytical power but also control, auditability, and policy-aware execution.
*Our forecasts treat driver/restraint impacts as directional, not additive. The impact forecasts reflect baseline growth, mix effects, and variable interactions.
Segment Analysis
By Component: Solutions Lead, While Services Gain Strategic Weight
Solutions accounted for 70.15% of revenue in 2025, keeping software platforms at the center of the North America customer journey analytics market. Enterprises still preferred purpose-built systems because journey analytics requires event collection, identity stitching, visualization, orchestration, and governance, in a form that internal teams rarely build quickly or maintain at a comparable scale. That preference is structural rather than temporary, because most buyers prefer a tested operating environment rather than creating and supporting their own stack across multiple departments. Solutions also benefit from the way procurement works in larger organizations, where standardization and vendor accountability matter as much as analytical flexibility. This kept the North America customer journey analytics market anchored in platform spending, even as implementation needs became more complex.
Services, however, are projected to expand at a 22.59% CAGR through 2031, making them the fastest-growing segment. Growth in services reflects more than setup work, because many deployments now require managed optimization, integration support, journey design, governance tuning, and change management after launch. Pegasystems strengthened this direction in June 2026 when it introduced Customer Engagement Studio and linked AI delivery more closely to governed workflows and outcomes, which supports a model in which value is increasingly tied to execution support rather than only license access. In the customer journey analytics industry, that shift means vendors with strong professional and managed services can better protect accounts once the platform becomes part of daily operations. It also explains why the North America customer journey analytics market is rewarding vendors that can combine software, implementation depth, and measurable business outcomes in a single relationship.
By Deployment Mode: Cloud Sets the Pace, While Regulated Buyers Preserve Alternatives
Cloud accounted for 65.29% of the North America customer journey analytics market in 2025 and is also projected to post the fastest growth at a 22.09% CAGR through 2031. This combination is important because it shows that migration is still underway and that the cloud has not yet reached a point where growth naturally tapers off due to maturity. Buyers continue to choose the cloud because it reduces infrastructure management, enables faster feature delivery, and meets the elastic computing needs of AI-driven analytics. It also makes it easier to add new signal types and support new channels without waiting for local infrastructure upgrades. The North America customer journey analytics market, therefore, continues to treat cloud not simply as a hosting model, but as the base architecture for faster experimentation and broader journey visibility.
Contentsquare reflected this pattern in March 2026, expanding signal ingestion to websites, mobile apps, AI assistants, and support conversations via a cloud-native approach. That matters because channel expansion is becoming the norm, and cloud platforms are better positioned to absorb new data types without significant deployment friction. On-premises models still retain value in healthcare and financial services, where organizations can maintain greater control over sensitive data and internal review processes. Hybrid setups also remain relevant for large enterprises that want the flexibility of analytics and orchestration while keeping selected datasets in controlled internal environments. In the customer journey analytics industry, these alternatives keep a role, but the North America customer journey analytics market is clearly moving toward cloud-first buying patterns because most new AI-led use cases work better in more scalable environments.
By Application: Journey Mapping Holds the Base, While Orchestration Pulls New Spend
Journey mapping and visualisation held 58.11% of 2025 revenue, which made it the largest application area in the North America customer journey analytics market. This leadership stems from the fact that most organizations begin by making the customer path visible before attempting live intervention, attribution refinement, or automated personalization. Mapping remains useful because it helps teams align around shared pain points, duplicated steps, and breakdowns across channels and departments. It is also easier to introduce into an organization that is still building trust in customer data and shared metrics. For these reasons, the North America customer journey analytics market still relies on mapping as the entry point for many first-stage programs.
Campaign and journey orchestration, however, is projected to expand at a 21.43% CAGR through 2031, which signals that buyer priorities are shifting from observation to action. Pega supported that direction in June 2026 with Customer Engagement Studio, which connected brief creation, AI-assisted decisioning, and live, personalized actions in a single, governed workspace. As orchestration grows, switching costs also rise because campaign logic, audience decision rules, and identity relationships become tightly linked to the chosen platform. Customer behavior and attribution continue to matter as firms rebuild measurement around first-party data, while brand and product management keep a role in consistency and planning. In the North America customer journey analytics market, the center of gravity is therefore moving toward applications that close the gap between signal detection and automated action, even though mapping still accounts for the largest installed base today.
By End-User Enterprise Size: Large Enterprises Hold the Majority, While SMEs Close the Gap
Large enterprises accounted for 72.14% of revenue in 2025, giving them the greatest weight in the North America customer journey analytics market. Their lead reflects larger data volumes, broader channel footprints, and stronger budgets for integration, governance, and cross-functional deployment. Large organizations also face more urgency to standardize customer visibility across brands, countries, lines of business, and service functions, which makes journey analytics easier to justify. In many cases, they already have the supporting cloud, CRM, and contact center systems that can connect to journey tools more quickly than smaller firms. This kept the North America customer journey analytics market concentrated among enterprise buyers at the revenue level, even as newer tiers began to accelerate.
SMEs are projected to record the fastest growth at a 22.38% CAGR through 2031, narrowing the historical adoption gap. Cloud-native delivery, modular pricing, pre-built connectors, and easier setup are reducing the barriers that once kept advanced journey analytics out of reach for smaller organizations. Amplitude reinforced this direction in 2026 when it introduced agentic AI analytics for product experiences, highlighting a model that lowers the amount of specialist effort needed to generate useful insights. Salesforce also widened access with Agentforce 3 by extending capabilities and language coverage, helping smaller teams work with automation at lower operational friction.[2] The North America customer journey analytics market is therefore adding new depth below the enterprise tier, and that matters because SME growth can support a larger installed base without changing the premium role that major accounts still play.
By End-User Industry: Retail and eCommerce Lead Spending, While Healthcare and Life Sciences Accelerate
Retail and eCommerce accounted for 28.44% of revenue in 2025, placing them at the forefront of the North America customer journey analytics market. Their lead is tied to the sheer number of measurable touchpoints, because shoppers move through search, digital ads, websites, apps, stores, delivery updates, and post-purchase support in connected ways that create constant behavioral signals. The commercial value of optimization is also clearer in this segment, since changes in abandonment, conversion, and repeat purchase can often be tracked quickly. Retail and eCommerce firms also tend to test offers and journeys more often than heavily regulated sectors, which increases the need for systems that can continuously monitor and compare paths. This made the North America customer journey analytics market especially relevant to businesses that depend on high-volume, fast-moving customer interactions.
Healthcare and life sciences are projected to expand at a 21.05% CAGR through 2031, making it the fastest-growing end-user industry in the North America customer journey analytics market. The sector is moving more quickly because patient and member interactions increasingly happen through digital channels, and providers and payers need better visibility into navigation problems, drop-off points, and service confusion. A 2026 study in Scientific Reports demonstrated a reproducible framework for digital journey analysis using large-scale healthcare app event data, which showed that journey analytics can support practical user experience changes at very high event volumes. Healthcare growth also reflects a broader shift toward experience-led retention and service quality, in which organizations need to understand not only outcomes but also the path that led to dissatisfaction or abandonment. In the customer journey analytics industry, healthcare and life sciences are among the most promising verticals for vendors that can balance privacy requirements with detailed behavioral analysis.
Geography Analysis
The United States held 64.31% of the North America customer journey analytics market share in 2025, making it the clear revenue leader in the region. The country leads because it combines a dense base of enterprise buyers with broad cloud adoption, mature customer data environments, and a large concentration of platform vendors and service partners. The North America customer journey analytics market is also more developed in the United States because journey data is linked to sales, service, commerce, and revenue operations in ways that go beyond campaign reporting alone. This gives US buyers more use cases per deployment and supports higher spending per account. Privacy rules are also shaping design choices more directly, because consent, automated decision oversight, and broader data governance expectations are forcing companies to make journey analytics more controlled and auditable.
Vendor activity continues to reinforce the United States as the main proving ground for new capabilities in the North America customer journey analytics market. Salesforce used Agentforce 3 to emphasize visibility, control, and autonomous execution, and those themes reflect what large US enterprises now expect from analytics-adjacent platforms rather than what they see as optional innovation. Adobe also expanded journey intelligence with the Customer Journey Analytics B2B Edition, which is especially relevant in the United States, where multi-stakeholder buying and account-level decisioning are common in enterprise demand generation.[3] Canada holds a meaningful position because financial services and telecom buyers value structured customer data practices and increasingly need privacy-aware journey visibility across digital channels. The country also offers room for mid-market expansion as cloud-native models lower deployment barriers and make more advanced tooling accessible beyond the largest organizations.
Mexico is projected to grow at a 21.77% CAGR through 2031, which makes it the fastest-growing geography in the North America customer journey analytics market. Growth is being supported by expanding digital commerce activity, rising demand for better customer visibility, and improving accessibility of enterprise platforms for Spanish-speaking teams. Salesforce strengthened accessibility when Agentforce 3 expanded language coverage to include Spanish, which matters for adoption and internal usability in customer-facing environments. Vendors that can pair localized interfaces with scalable cloud deployment are likely to find more whitespace in Mexico than in the more mature US segment. That means the North America customer journey analytics market remains regionally unbalanced in terms of current revenue, but its future growth profile is being broadened by faster adoption outside the largest established base.
Competitive Landscape
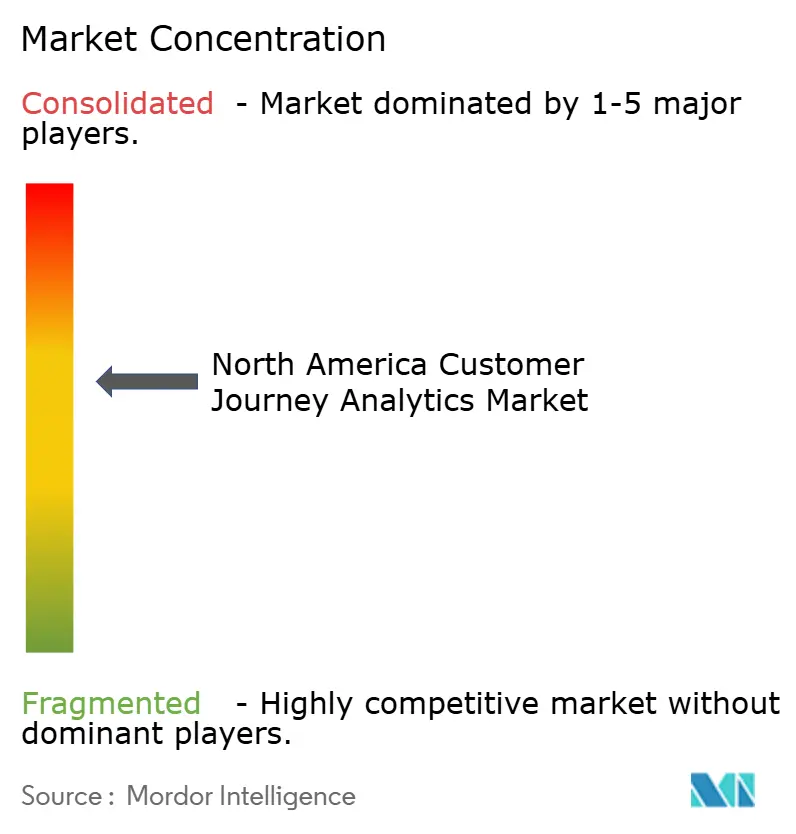
The North America customer journey analytics market is moderately consolidated at the enterprise tier, where a set of established customer experience, analytics, and enterprise software vendors compete across data connectivity, AI depth, orchestration capability, and delivery support. Competition is increasingly shaped by who can connect journey insight with action inside the same operating environment, because buyers want fewer handoffs between analysis, content, service response, and campaign execution. This is why the market is moving away from standalone dashboards toward platforms that can coordinate across CDP, CRM, contact center, and commerce systems. The North America customer journey analytics market also shows rising pressure on vendors to demonstrate interoperability, as enterprises seek to reduce dependence on isolated tools that add data movement and governance burdens. As a result, partnerships, connector depth, and control frameworks now matter almost as much as analytical features.
Several strategic moves in 2025 and 2026 illustrate how vendors are trying to strengthen their position. NICE deepened its partnership with Salesforce in August 2025 to support workflow orchestration, bring-your-own-contact-center capabilities, and zero-copy integration with Data Cloud, thereby improving data access across service and analytics environments. Medallia partnered with Ada in January 2026 to turn experience signals into automated actions, demonstrating how feedback intelligence and agentic execution are being more closely tied. SAP and Google Cloud expanded their work on multi-agent AI for customer experience orchestration in April 2026, which highlighted how major enterprise platforms are pushing journey intelligence closer to operational systems rather than leaving it in a separate analysis layer.[4] Each of these moves supports the same competitive pattern, in which value increasingly comes from connected execution rather than insight generation alone. This is one reason the North America customer journey analytics market is becoming harder for smaller point solutions to penetrate at the top end.
At the same time, the market still leaves room for challengers that move faster in newer signal environments. Contentsquare did this in March 2026 by extending analytics to AI assistant traffic and support conversations, which helped it address behavioral areas that some larger incumbents had covered more slowly. Amplitude is also pressing from the product analytics side by simplifying AI-assisted interpretation and making advanced analysis easier to use without large specialist teams. Even so, once orchestration, identity logic, and cross-functional workflows are embedded, enterprise switching costs rise quickly, protecting larger vendors that already sit deep in the operating stack. The North America customer journey analytics market, therefore, remains open to innovation, but the strongest competitive advantage still comes from broad integration, live execution capability, and durable customer relationships.
North America Customer Journey Analytics Industry Leaders
-
Salesforce, Inc.
-
Microsoft Corporation
-
Oracle Corporation
-
Adobe Inc.
-
SAP SE
- *Disclaimer: Major Players sorted in no particular order
Recent Industry Developments
- June 2026: Contentsquare announced a partnership with Dust on June 24, 2026, connecting its customer experience intelligence platform to Dust's enterprise AI agent environment via an MCP connector, enabling teams to query live behavioral journey data directly from AI workspaces without switching between analytics dashboards, positioning journey intelligence as a native input for AI-driven enterprise workflows.
- June 2026: Adobe announced the general availability of CX Enterprise Coworker on June 10, 2026, an agentic AI solution automating CX workflows across analytics, content, and journey orchestration for over 20,000 global brands. Built on open MCP and A2A standards and interoperable with AWS, Anthropic, Google Cloud, and Microsoft, the product reported AI-influenced ARR exceeding one-third of total Q4 FY2025 bookings and 13x growth in agentic suite trials.
- June 2026: Pegasystems launched Pega Customer Engagement Studio at PegaWorld on June 8, 2026, enabling marketers to move from a campaign brief to live, AI-orchestrated, personalized actions in minutes. The product integrates Pega and third-party agents in a single governed workspace atop Pega Customer Decision Hub and is planned to ship with Pega Infinity '26 later in 2026, alongside a shift to outcomes-based AI pricing.
- April 2026: SAP and Google Cloud expanded their strategic partnership to deploy multi-agent AI for customer experience orchestration, targeting general availability in H2 2026. The combined solution connects SAP Customer Experience and Engagement Cloud with Google Gemini AI and real-time behavioral signals, including inventory, order, and customer interaction history, for orchestrated, AI-driven personalization.
North America Customer Journey Analytics Market Report Scope
The North America Customer Journey Analytics Market includes software platforms and associated services that enable organizations to track, analyze, visualize, and optimize customer interactions across multiple touchpoints and channels throughout the customer lifecycle. These solutions collect and unify customer data from digital, physical, and hybrid engagement channels to provide actionable insights into customer behavior, preferences, journey patterns, and engagement effectiveness. The increasing demand for personalized customer experiences, the growing adoption of omnichannel engagement strategies, rising investments in artificial intelligence and advanced analytics, and the need for real-time customer intelligence drive the market. These solutions help organizations improve customer acquisition, retention, satisfaction, and marketing performance by enabling data-driven decision-making and customer journey optimization across industries.
The North America Customer Journey Analytics Market Report is Segmented by Component (Solutions, and Services), Deployment Mode (Cloud, On-Premises, and Hybrid), Application (Journey Mapping and Visualisation, Campaign and Journey Orchestration, Brand and Product Management, and Customer Behaviour and Attribution), End-User Enterprise Size (Large Enterprises, and Small and Mid-Size Enterprises), End-User Industry (Banking, Financial Services, and Insurance [BFSI], Retail and eCommerce, Information Technology and Telecom, Healthcare and Life-Sciences, Media and Entertainment, Travel and Hospitality, Automotive and Mobility, and Other End-User Industries), and Geography (United States, Canada, and Mexico). The Market Forecasts are Provided in Terms of Value (USD).
| Solutions |
| Services |
| Cloud |
| On-Premises |
| Hybrid |
| Journey Mapping and Visualisation |
| Campaign and Journey Orchestration |
| Brand and Product Management |
| Customer Behaviour and Attribution |
| Large Enterprises |
| Small and Mid-Size Enterprises |
| Banking, Financial Services, and Insurance (BFSI) |
| Retail and eCommerce |
| Information Technology and Telecom |
| Healthcare and Life-Sciences |
| Media and Entertainment |
| Travel and Hospitality |
| Automotive and Mobility |
| Other End-User Industries |
| United States |
| Canada |
| Mexico |
| By Component | Solutions |
| Services | |
| By Deployment Mode | Cloud |
| On-Premises | |
| Hybrid | |
| By Application | Journey Mapping and Visualisation |
| Campaign and Journey Orchestration | |
| Brand and Product Management | |
| Customer Behaviour and Attribution | |
| By End-User Enterprise Size | Large Enterprises |
| Small and Mid-Size Enterprises | |
| By End-User Industry | Banking, Financial Services, and Insurance (BFSI) |
| Retail and eCommerce | |
| Information Technology and Telecom | |
| Healthcare and Life-Sciences | |
| Media and Entertainment | |
| Travel and Hospitality | |
| Automotive and Mobility | |
| Other End-User Industries | |
| By Geography | United States |
| Canada | |
| Mexico |
Key Questions Answered in the Report
What is the size outlook for the North America customer journey analytics space?
The North America customer journey analytics market size is projected to expand from USD 7.35 billion in 2025 and USD 8.80 billion in 2026 to USD 21.56 billion by 2031, at a CAGR of 19.64%.
Which deployment model is leading adoption across North America?
Cloud is the leading model, with 65.29% share in 2025, and it is also the fastest-growing deployment mode with a 22.09% CAGR through 2031.
Which application area currently drives the most revenue?
Journey mapping and visualisation is the largest application, accounting for 58.11% of 2025 revenue, because many organizations start their programs by making the customer path visible before moving to live orchestration.
Which customer group is growing fastest by enterprise size?
SMEs are the fastest-growing enterprise size cohort, with a projected 22.38% CAGR through 2031, as cloud-native pricing and easier deployment models lower adoption barriers.
Which end-user sector offers the strongest growth potential?
Healthcare and life sciences is expected to grow the fastest at a 21.05% CAGR through 2031, supported by rising digital interaction volumes and stronger demand for patient and member journey visibility.
Which country contributes the most revenue and which one is growing fastest?
The United States led the region with 64.31% share in 2025, while Mexico is projected to record the highest growth rate at a 21.77% CAGR through 2031.