
Technology, Media and Telecom
5th MayPricing Strategy for Semiconductor Components
3 Min Read
The Multi Camera System Market Report is Segmented by Component (Hardware, Software, and Services), Display Type (2D, and 3D), Resolution (SD, HD and Full HD, and 4K and Above), End-User Industry (Automotive, Industrial Manufacturing and Robotics, Media, Entertainment and Broadcasting, Sports and Motion Analytics, Healthcare and Medical Imaging, and More), and Geography. The Market Forecasts are Provided in Terms of Value (USD).
Market Overview
| Study Period | 2021 - 2031 |
|---|---|
| Market Size (2026) | USD 2.69 Billion |
| Market Size (2031) | USD 4.12 Billion |
| Growth Rate (2026 - 2031) | 8.88 % CAGR |
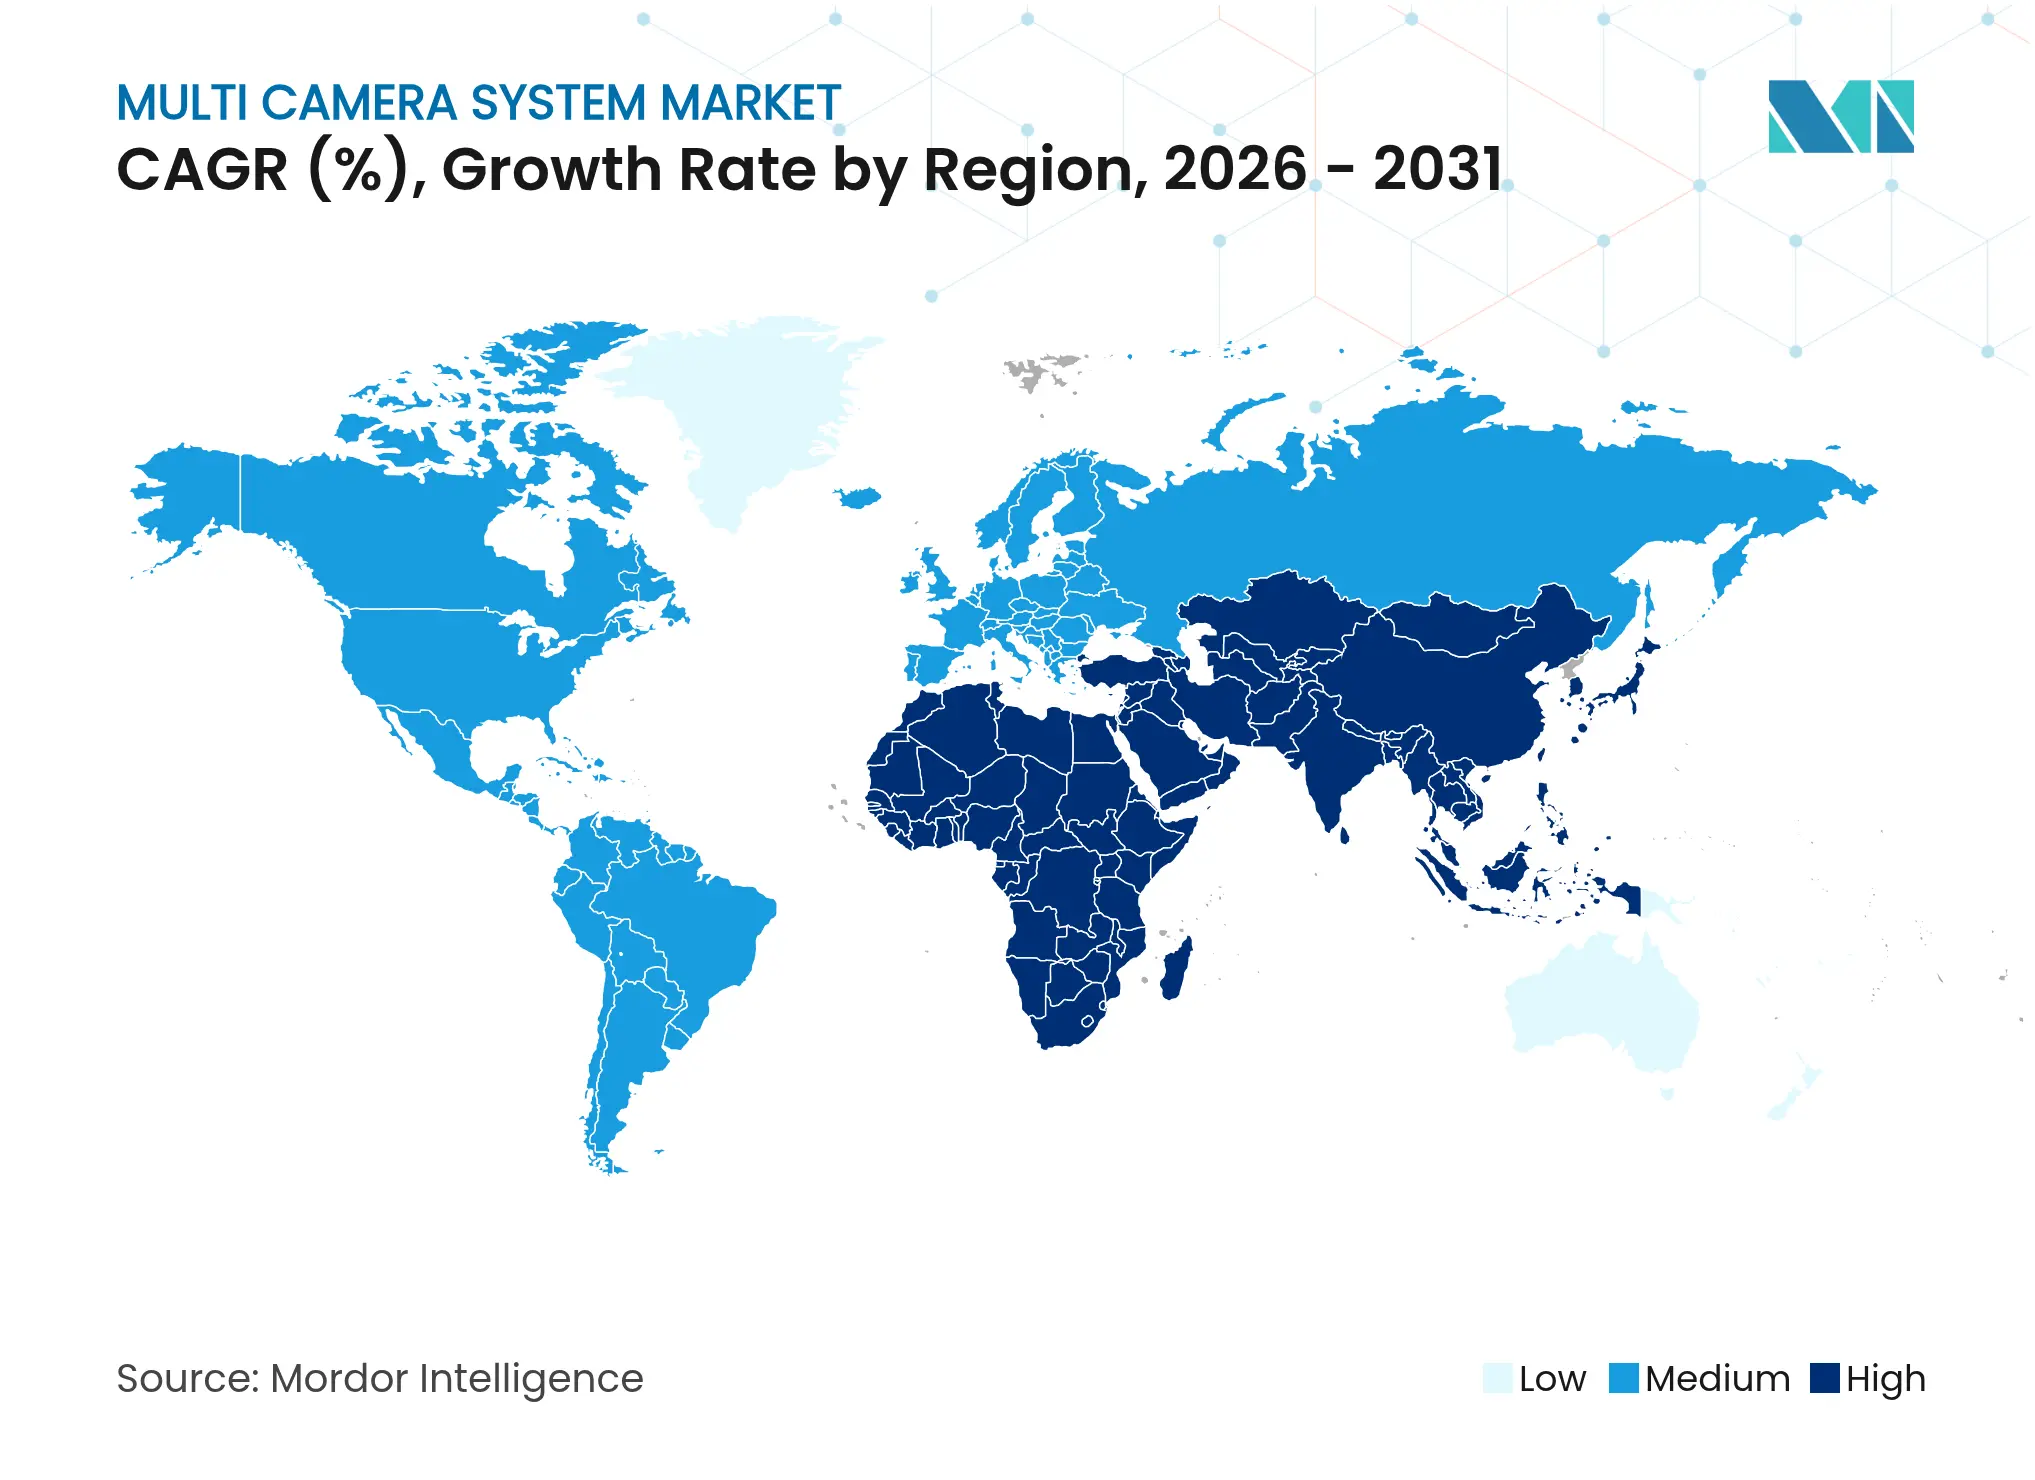
| Fastest Growing Market | Middle East and Africa |
| Largest Market | Asia Pacific |
| Market Concentration | Medium |
Major Players *Disclaimer: Major Players sorted in no particular order. Image © Mordor Intelligence. Reuse requires attribution under CC BY 4.0. |
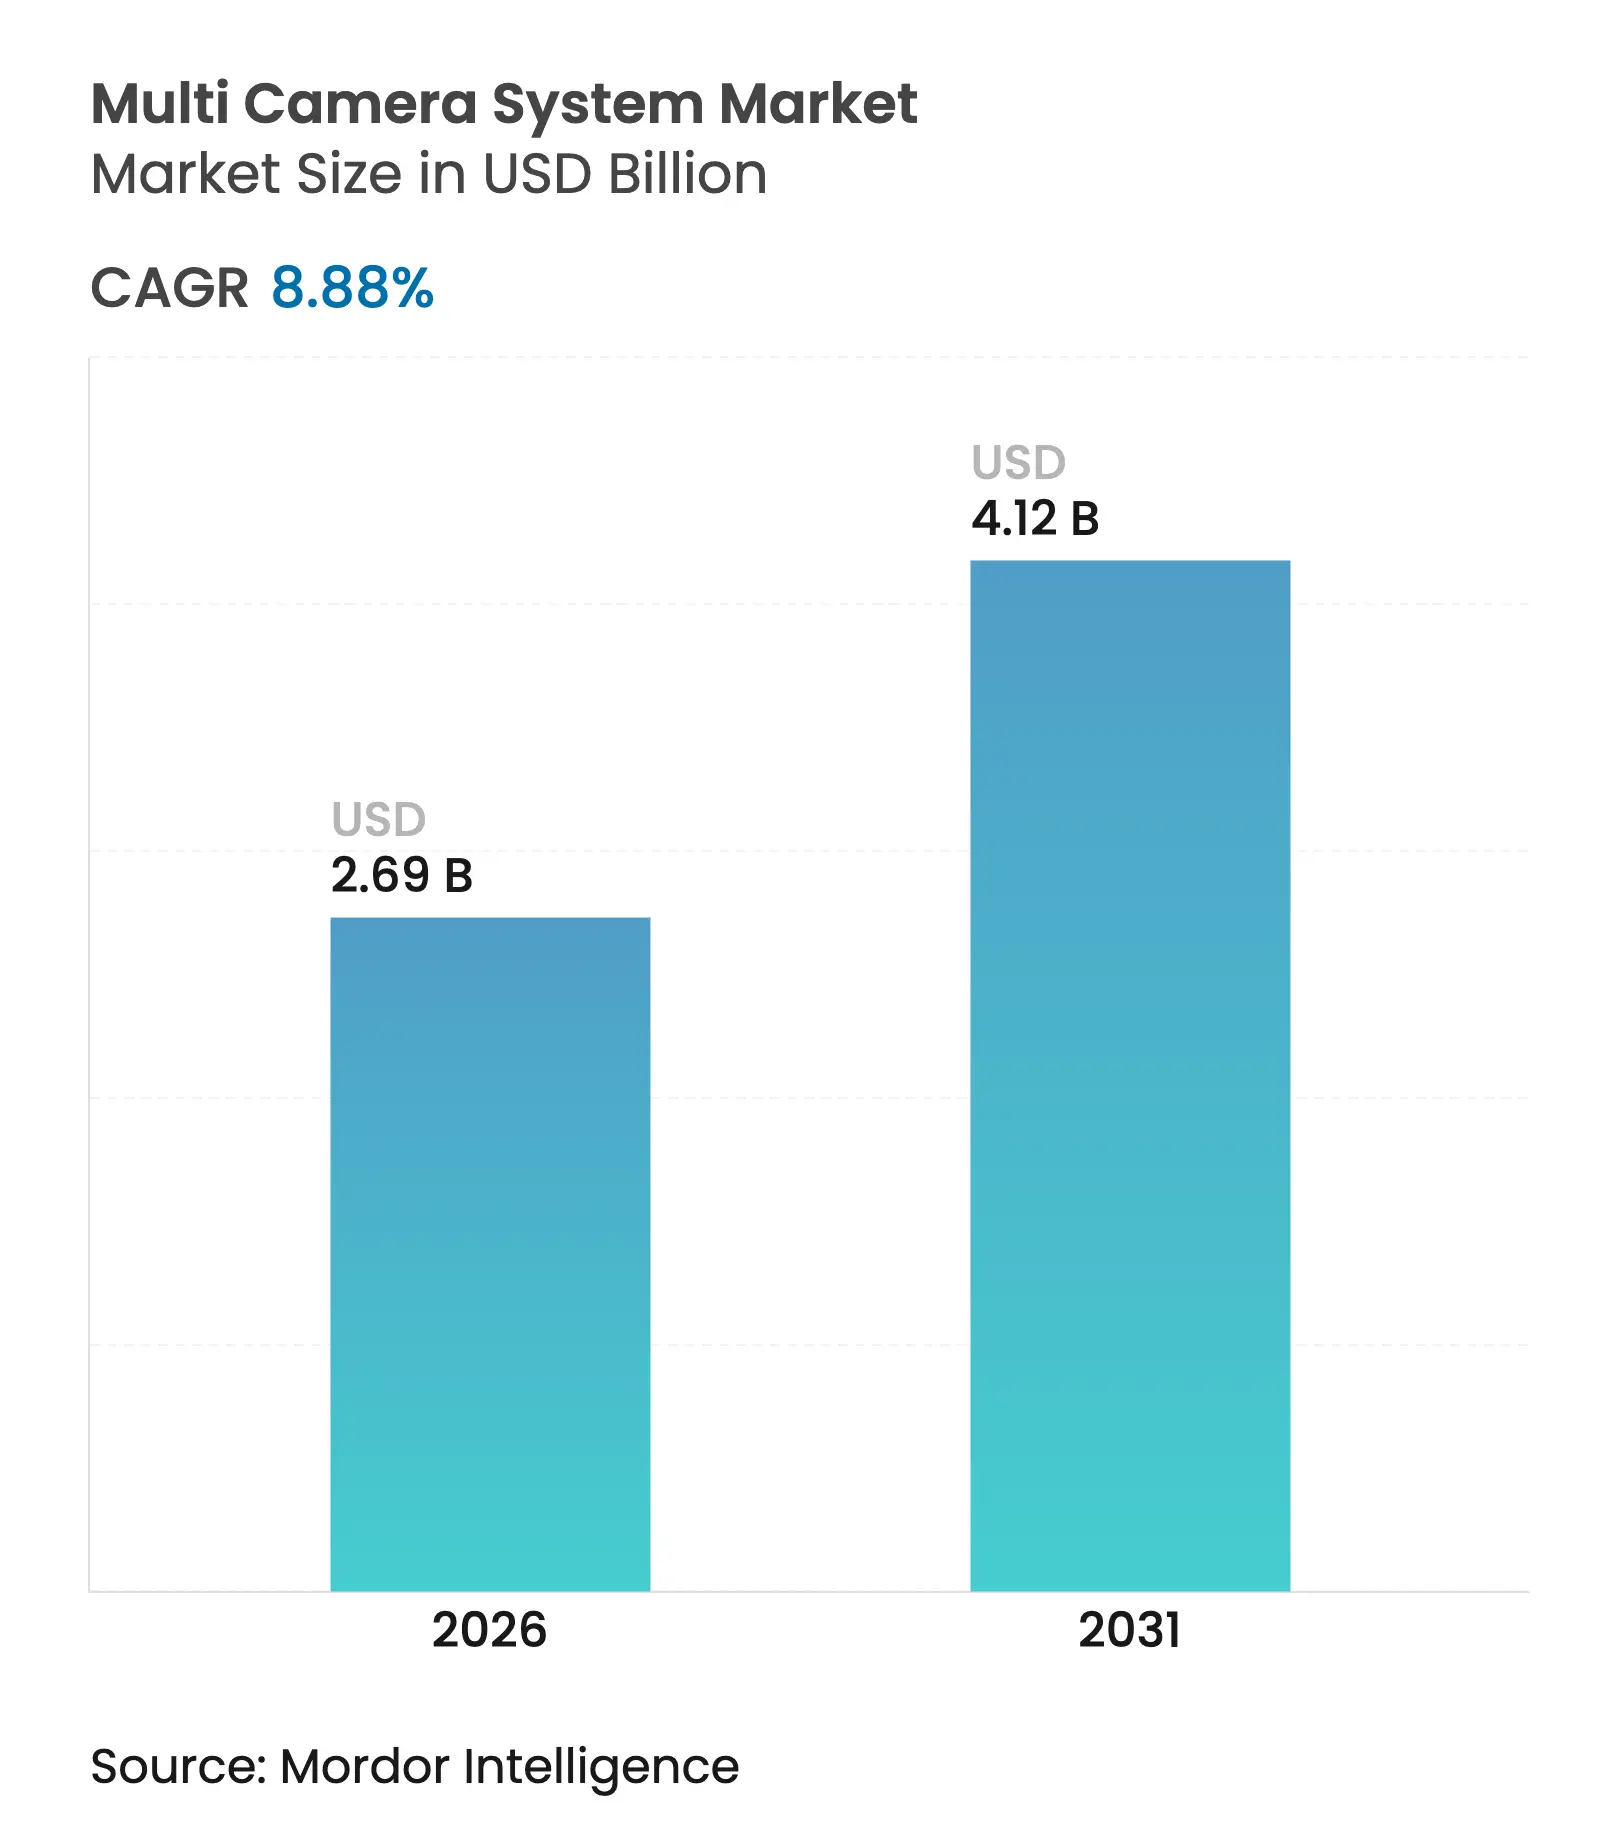
The Multi Camera System market size was valued at USD 2.47 billion in 2025 and estimated to grow from USD 2.69 billion in 2026 to reach USD 4.12 billion by 2031, at a CAGR of 8.88% during the forecast period (2026-2031). The current Multi Camera System market size reflects rising demand for AI-enabled image capture across automotive, smart-city, and industrial automation settings. Demand is accelerating as multi-sensor arrays shift from single-purpose recorders to intelligent endpoints that run analytics at the edge, cutting latency and network load. Cost reductions in CMOS sensors, tighter integration of ECUs, and the spread of 5G backhaul are lowering entry barriers and widening deployment scenarios. Meanwhile, edge-AI chipsets now support real-time stitching of 4K feeds, allowing the Multi Camera System market to extend into higher-value use cases such as volumetric sports capture and autonomous-vehicle perception. Vendors are responding by embedding pre-trained neural networks into camera modules that deliver object detection, facial recognition, and anomaly alerts without off-device processing.
Key Report Takeaways
Note: Market size and forecast figures in this report are generated using Mordor Intelligence's proprietary estimation framework, updated with the latest available data and insights as of 2026.
Drivers Impact Analysis
| Driver | (~) % Impact on CAGR Forecast | Geographic Relevance | Impact Timeline | |||
|---|---|---|---|---|---|---|
ADAS and autonomous-driving fitment surge ADAS and autonomous-driving fitment surge | +2.5% | North America, Europe, spillover into Asia Pacific | Medium term (2-4 years) | (~) % Impact on CAGR Forecast:+2.5% | Geographic Relevance:North America, Europe, spillover into Asia Pacific | Impact Timeline:Medium term (2-4 years) |
AI video analytics for smart-city programs AI video analytics for smart-city programs | +1.9% | Asia Pacific, emerging in Middle East and Africa | Short term (≤ 2 years) | |||
Vision-guided robotics in Industry 4.0 Vision-guided robotics in Industry 4.0 | +1.6% | Global focus in Asia Pacific and Europe | Medium term (2-4 years) | |||
Immersive 360°/volumetric sports content Immersive 360°/volumetric sports content | +1.3% | North America and Europe | Medium term (2-4 years) | |||
Falling camera and sensor ASPs Falling camera and sensor ASPs | +1.0% | Global | Short term (≤ 2 years) | |||
Fleet-safety mandates for commercial vehicles Fleet-safety mandates for commercial vehicles | +0.8% | North America, Europe, Asia Pacific | Short term (≤ 2 years) | |||
| Source: Mordor Intelligence | ||||||
Soaring ADAS and Autonomous-Driving Fitment Rates in North America and Europe
Regulators in the EU and the United States now require new cars to include autonomous emergency braking and forward-collision warning, making multi-sensor camera arrays indispensable. Nearly every 2025 vehicle platform upgrade bundles at least four surround-view imagers that feed a perception stack combining preprocessing, AI inference, and post-processing on embedded ECUs. OEMs have moved these capabilities down-market into entry-level trims and light commercial fleets, transforming cameras from premium add-ons into baseline safety equipment. At the same time, silicon vendors are shipping system-on-chips that run convolutional neural networks at sub-3 W power envelopes, allowing fully enclosed, hermetically sealed modules that tolerate harsh automotive environments. The effect is a structural rise in unit volumes that pushes component ASPs lower, reinforcing adoption momentum.
Rapid Adoption of AI-Based Video Analytics in Smart-City Surveillance (Asia)
Municipal authorities across China, Singapore, and South Korea now deploy consolidated command centers that ingest hundreds of video streams from multi-camera light poles and transit hubs. Edge-AI units embedded in each node perform license-plate recognition, pedestrian counting, and abnormal-behavior alerts within 50 milliseconds, slashing false alarms and traffic delays. Metropolitan road-network managers report double-digit improvements in peak-hour throughput after real-time camera analytics adjusted signal timing. As urbanization pushes Asia’s city populations toward 58% by 2025, scalable camera grids remain central to public-safety policy. Vendors targeting the region pre-train models on local datasets to cope with language and signage differences, accelerating time-to-value for municipal buyers.
Growing Deployment of Vision-Guided Robotics in Industry 4.0 Manufacturing
Industrial OEMs are integrating multi-camera rigs and structured-light sensors into cobots that handle precision assembly, pick-and-place, and quality inspection. Immediate depth data from 3D imagers removes the need for complex multi-frame reconstruction, trimming calibration cycles and programming costs. The International Federation of Robotics highlighted collaborative robots and mobile manipulators among its top five global trends for 2024.[1]International Federation of Robotics, “Top 5 Robot Trends 2024,” ifr.org Manufacturers use digital twins generated from live camera feeds to simulate tool paths and predict faults, cutting downtime. Labor shortages in welding and logistics make automated visual guidance a compelling substitute, driving multi-camera adoption deeper inside factory cells.
Content Creators’ Shift to Immersive 360°/Volumetric Video for Live Sports
Broadcasters are replacing static side-line cameras with synchronized arrays that fuse volumetric depth maps and RGB imagery. Canon’s sports analysis platform delivers real-time player speed, space occupancy, and tactical overlays on live feeds.[2]Canon U.S.A., “Volumetric X Motion Capture for Sports,” usa.canon.com Motion-tracking engines can now identify 85 body landmarks without markers in under one second, according to Southwest Research Institute.[3]Southwest Research Institute, “ENABLE 3D Motion Analysis Engine,” swri.org Audiences receive interactive angles on streaming platforms, while teams mine captured datasets for performance optimization, creating a feedback loop that pushes venues to install permanent multi-camera infrastructures.
Restraints Impact Analysis
| Restraint | (~) % Impact on CAGR Forecast | Geographic Relevance | Impact Timeline | |||
|---|---|---|---|---|---|---|
Non-standard video formats hinder interoperability Non-standard video formats hinder interoperability | -1.0% | Global | Medium term (2-4 years) | (~) % Impact on CAGR Forecast:-1.0% | Geographic Relevance:Global | Impact Timeline:Medium term (2-4 years) |
High bandwidth and edge-compute needs for 4K stitching High bandwidth and edge-compute needs for 4K stitching | -0.8% | Global, higher drag in emerging markets | Short term (≤ 2 years) | |||
Data privacy frameworks (GDPR, CCPA) Data privacy frameworks (GDPR, CCPA) | -0.6% | Europe, North America, expanding worldwide | Medium term (2-4 years) | |||
Thermal/weather limits on CMOS sensors Thermal/weather limits on CMOS sensors | -0.4% | Global, severe in extreme climates | Long term (≥ 4 years) | |||
| Source: Mordor Intelligence | ||||||
Fragmented Video Standards Complicating Interoperability Across OEMs
Surveillance upgrades and fleet-wide automotive retrofits often stall because proprietary compression formats prevent cross-vendor mixing. Integrators must write custom middleware bridges, adding cost and stretching schedules. City-wide camera networks built in phases expose legacy MPEG streams that refuse to mesh with newer H.265-or-AV1 pipelines, forcing dual-stack operations. While international bodies debate common schemas, commercial incentives keep encoding methods closed, perpetuating vendor lock-in. Middleware specialists and “camera-agnostic” software vendors therefore find a lucrative niche bridging disparate ecosystems.
High Bandwidth and Edge-Compute Requirements in Real-Time Stitching
Aggregating eight 4K feeds at 60 fps demands roughly 48 Gbps of raw throughput and teraflop-scale inference horsepower. To stay within vehicle or drone thermal envelopes, designers lean on AI-native microcontrollers such as Synaptics’ 2025 SR-Series that integrate neural accelerators and multiple MIPI interfaces.[4]Synaptics, “Synaptics Extends Edge AI Portfolio,” synaptics.com However, silicon budgets and battery constraints raise bill-of-materials prices in mass-market products. Emerging-market deployments feel the pinch most acutely where 5G coverage is patchy, holding back cloud offload strategies.
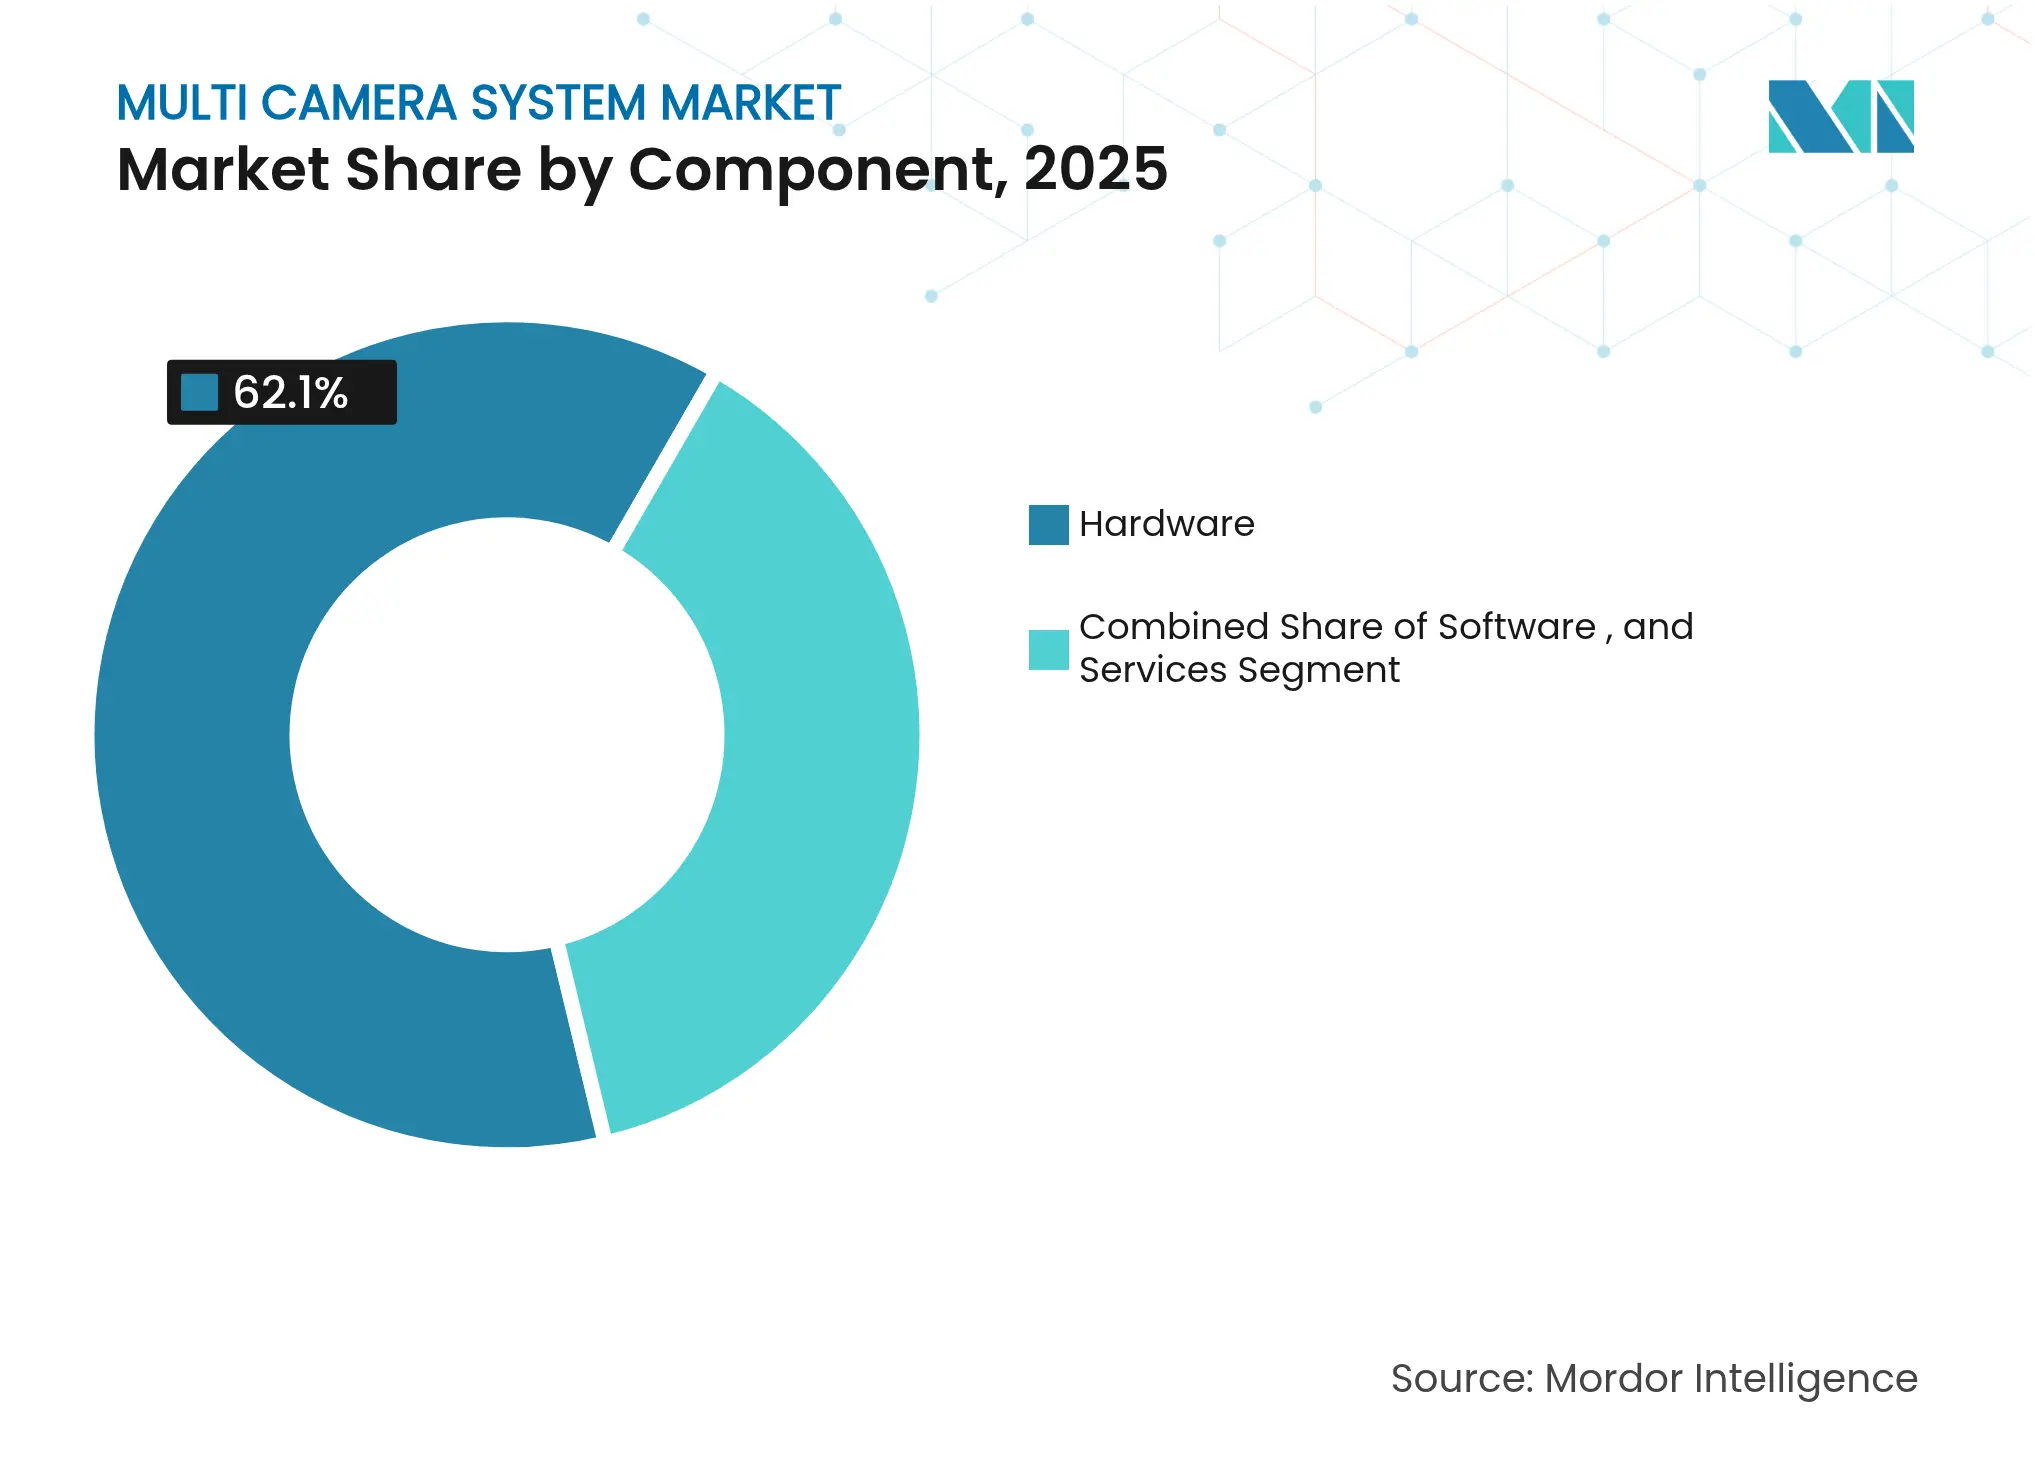
By Component: Hardware Dominance Masks Services Surge
Hardware still accounted for 62.10% of the Multi Camera System market in 2025, anchored by high-volume shipments of imagers, ECUs, and lens assemblies. Semiconductor roadmaps continue to double on-device TOPS every eighteen months, letting suppliers embed feature extraction and object classification directly in the sensor pipeline. This hardware heft underpins rapid wins in automotive ADAS and smart parking, where latency budgets sit below 100 milliseconds.
The services layer is now the fastest-growing slice, expanding at a 9.85% CAGR because enterprises seek custom integration that stitches cameras into MES, ERP, and security orchestration tools. Facility-management firms acquire specialist integrators so they can bundle design, installation, and lifecycle maintenance into managed-service contracts. As a result, the Multi Camera System market attracts private-equity roll-up strategies targeting regional installers that own sticky, recurring revenue.
Note: Segment shares of all individual segments available upon report purchase
By Display Type: 3D/Panoramic Visualizations Redefining User Experience
Conventional 2D consoles retained 69.65% revenue in 2025 thanks to entrenched control-room habits and lower equipment costs. Yet buyers are pivoting fast: 3D/panoramic user interfaces are booked to grow at 10.75% through 2031 as operators demand bird’s-eye situational awareness. Truck OEMs deploy 360° stitched views that erase blind spots, letting drivers maneuver articulated rigs in tight depots.
Immersive dashboards also spill into public safety. Command centers render photorealistic city twins textured with live camera tiles, allowing incident managers to “fly” through streets virtually. These capabilities rest on multi-core GPUs and depth-aware camera arrays that map environments within centimeter accuracy, thereby lifting overall Multi Camera System market utility for first responders and logistics operators alike.
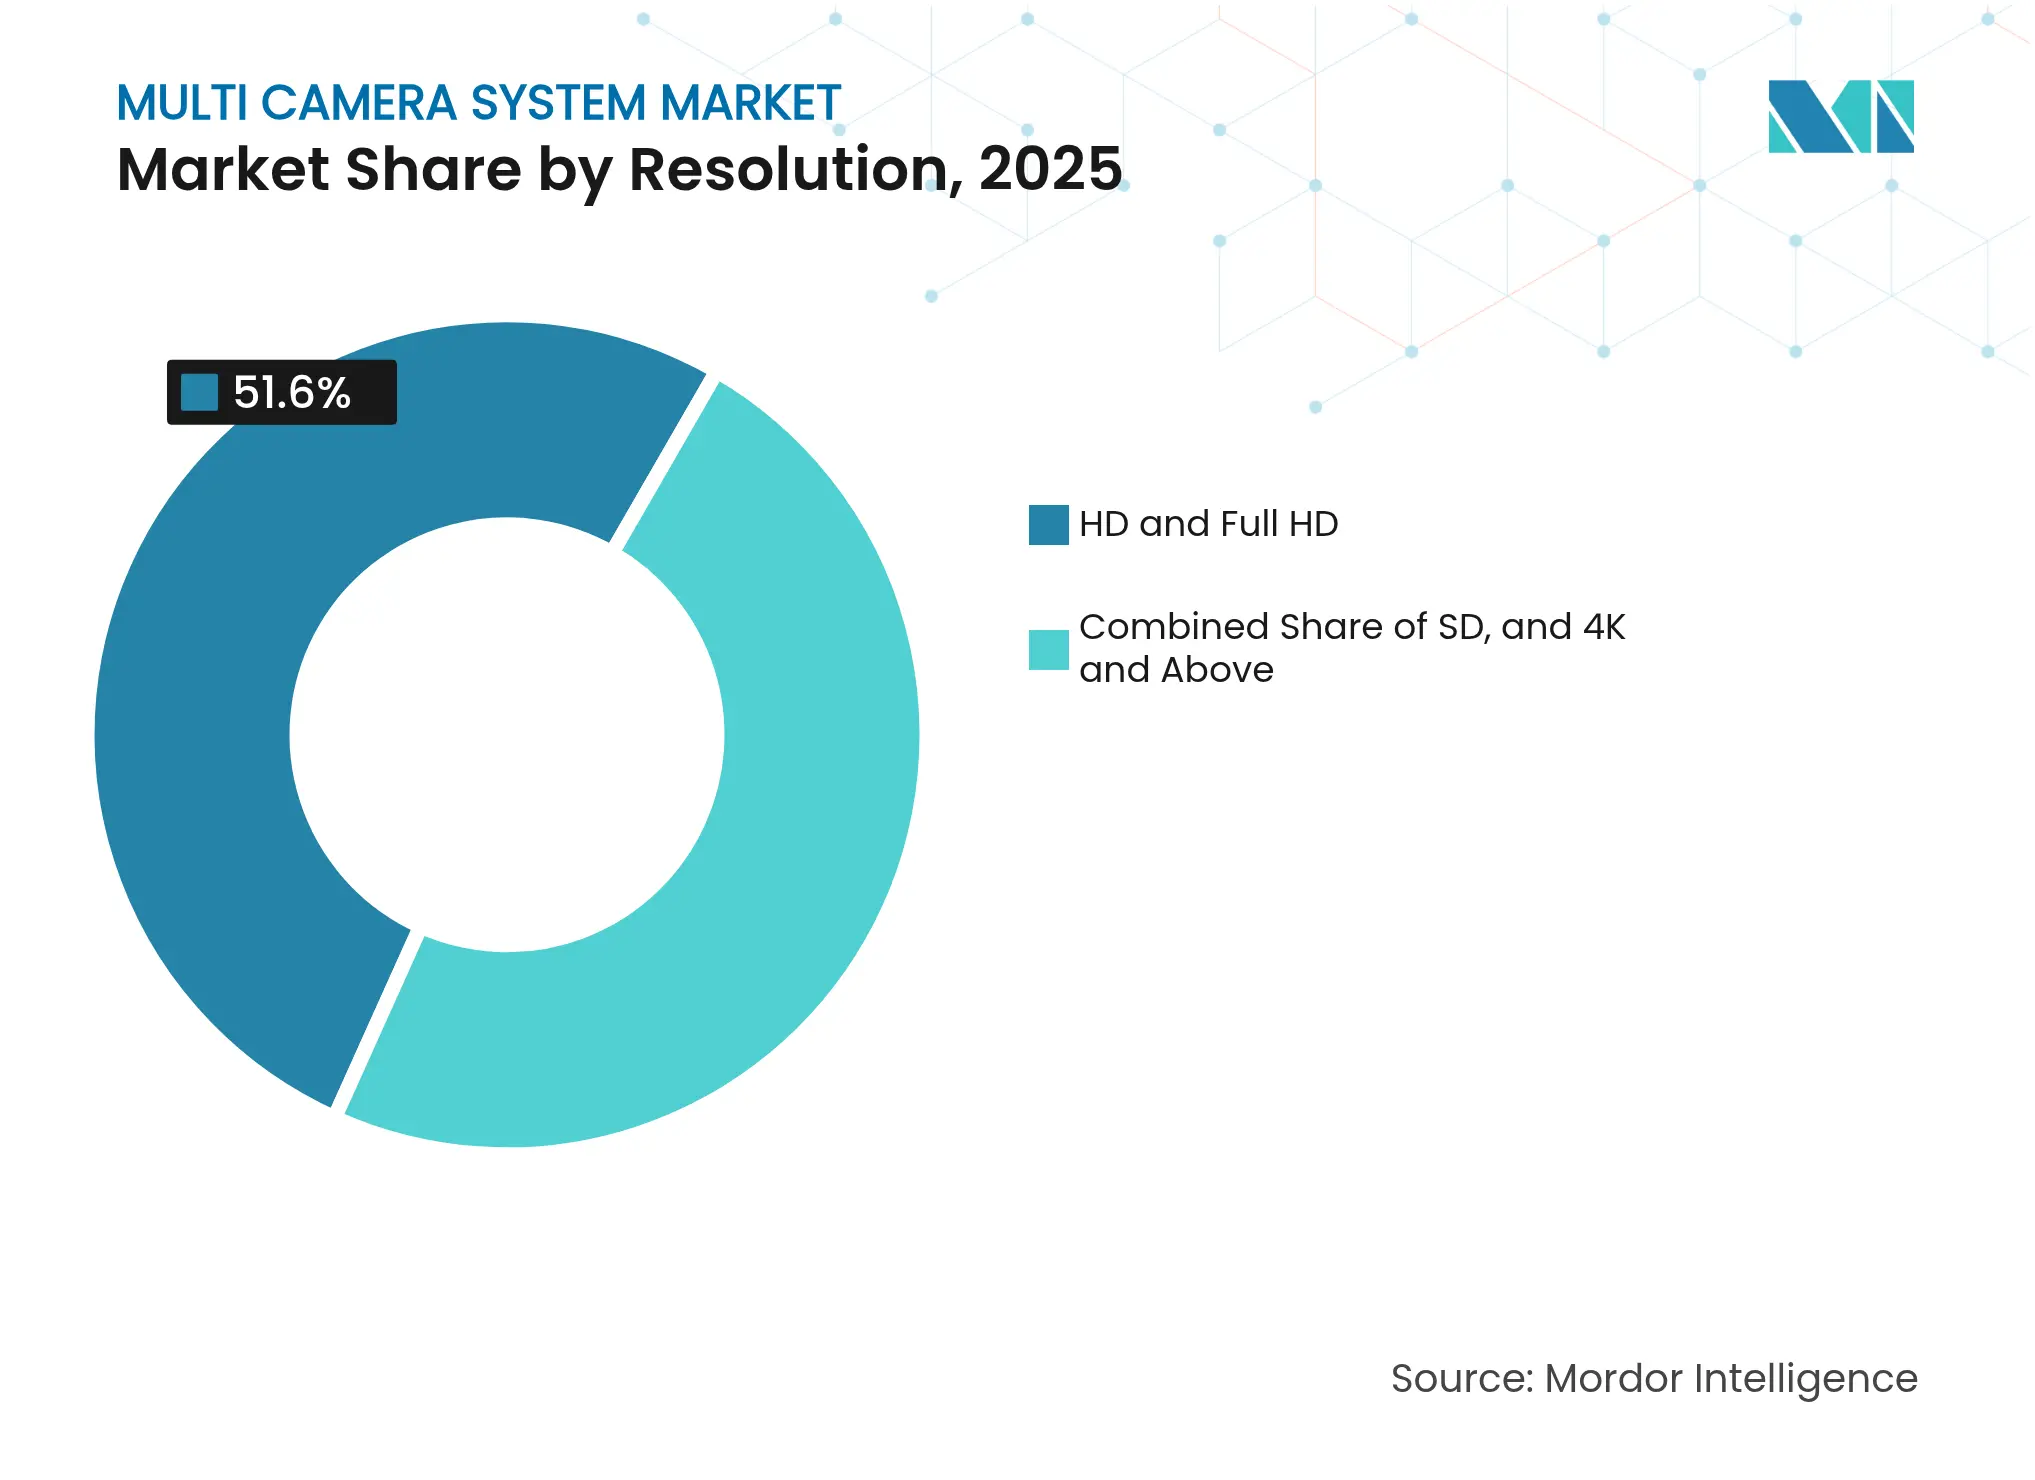
By Resolution: 4K and Above Drives Premium Segment Growth
HD and Full HD streams still form the backbone, representing 51.60% of 2025 revenue because they balance clarity against storage and bandwidth budgets. Organizations with tens of thousands of endpoints favor standard-definition capture for wide-area coverage and long retention periods.
Yet 4K-plus cameras post the quickest 12.30% CAGR. In-vehicle modules capturing 8-megapixel frames boost object-classification accuracy especially at night, narrowing the distance margin for automated braking. Semiconductor progress pulls encoding power down so that 4K sensors now fit low-profile domes, enabling retrofit in retail ceilings. These upgrades signal a steady migration path that enlarges the premium end of the Multi Camera System market.
Note: Segment shares of all individual segments available upon report purchase
By End-use Industry: Automotive Leadership Faces Sports Analytics Challenge
Automotive dominated 54.05% of the Multi Camera System market in 2025, riding on fitment cascades mandated by UNECE and NHTSA regulations. Every incremental L2-plus autonomous feature requires an additional imager pair, elevating camera counts from four in 2023 sedans to six or eight in 2025 crossovers. Suppliers scale modular ECU boards so OEMs can differentiate via software while reusing hardware enclosures, securing volume efficiencies.
Sports and motion-analytics, though smaller, races ahead at a 11.65% CAGR. Stadium owners retrofit truss-mounted arrays that feed real-time stats overlays to broadcasters and coaching staffs. Canon’s orchestration workflow unveiled at ISE 2025 lets a single operator steer multiple PTZ units from one console, slashing crew costs. The segment’s dynamism positions it as the primary challenger to automotive volume over the forecast period.
Asia Pacific controlled 38.10% of global revenue in 2025 on the back of China’s surveillance projects and its status as the world’s largest vehicle producer. Local camera giants incorporate proprietary ASICs that embed deep-learning cores, accelerating edge-AI adoption while shielding data sovereignty. Municipal programs in Shenzhen and Hangzhou integrate license-plate and facial biometrics entirely on-premise to comply with strict national-security rules. These practices anchor long-term contract cycles that underpin the Multi Camera System market.
North America and Europe form mature but innovation-heavy arenas. Both regions enforce stringent data-privacy regimes-GDPR in Europe and CCPA in California-prompting vendors to add differential-privacy layers that mask personally identifiable information at the sensor. Automakers on both continents lead validation of camera-only autonomous stacks that fuse visible and infrared inputs. Federal agencies meanwhile update procurement lists to bar non-NDAA-compliant components, reshaping demand toward certified suppliers.
The Middle East and Africa, while holding a smaller baseline, exhibits the fastest 9.35% CAGR to 2031. Gulf mega-projects embed “security-by-design” with city-wide fiber spines and edge data centers. Ministries of interior allocate budget share to integrated command platforms that synchronize drones, fixed cameras, and mobile feeds, skipping legacy analog stages altogether. Defense modernization in the region injects incremental orders for ruggedized airborne and naval camera pods, augmenting the Multi Camera System market size for premium military-grade hardware.
Market Concentration
The value chain is moderately consolidated: the top five suppliers capture just over half of shipments, yet dozens of regional specialists populate vertical niches. Bosch, Continental, and Sony leverage multi-billion-dollar fabs and optics heritage to mass-produce automotive-grade imagers. Parallel to them, Hikvision and Dahua dominate smart-city tenders in Asia, bundling VMS software with camera hardware.
Strategic M&A centers on AI inference and edge-compute IP. Redwire’s USD 925 million purchase of Edge Autonomy offers turnkey airborne platforms for defense ISR tasks. Synaptics expands horizontally with SR-Series microcontrollers that shorten design cycles for battery-based devices. Honeywell’s plan to spin off its Automation arm will create a pure-play industrial-camera integrator capable of faster capital allocation.[6]Honeywell, “Honeywell Announces Intent to Separate Automation and Aerospace,” honeywell.com Smaller entrants fight on algorithms, not optics, offering subscription-based video analytics that retrofit existing fleets.
Regulation is another competitive wedge. US federal purchasing rules now exclude certain Chinese components; EU cyber-resilience acts require vulnerability disclosures. Vendors with secure-element credentials and transparent supply chains win share. Conversely, firms lacking in-house silicon pivot to software-defined open SDK models so customers can swap sensors without lock-in, a strategy that enlarges the Multi Camera System industry partner ecosystem.

*Disclaimer: Major Players sorted in no particular order
1. INTRODUCTION
2. RESEARCH METHODOLOGY
3. EXECUTIVE SUMMARY
4. MARKET LANDSCAPE
5. MARKET SIZE AND GROWTH FORECASTS (VALUES)
6. COMPETITIVE LANDSCAPE
7. MARKET OPPORTUNITIES AND FUTURE OUTLOOK
Market Definitions and Key Coverage
Our study defines the multi-camera system market as the revenue generated from integrated, factory-supplied arrays of two or more synchronized video sensors plus the central electronic control unit that stitches feeds into a 360-degree or panoramic view for situational awareness across automotive, industrial automation, and smart-city security use cases. These systems differ from single-lens modules because the software must merge, calibrate, and serve real-time composite images to human or machine users.
Scope Exclusions: single-sensor dashcams, smartphone camera modules sold without multi-sensor fusion, and standalone lenses retrofitted in the aftermarket are kept outside the present scope.
Segmentation Overview
Detailed Research Methodology and Data Validation
Primary Research
Mordor analysts interviewed module makers, Tier-1 automotive suppliers, city surveillance integrators, and fleet managers across Asia, Europe, and North America. These conversations tested desk-found adoption rates, validated bill-of-materials erosion, and clarified regulatory compliance costs before we locked our model.
Desk Research
We began with open datasets such as UNECE General Safety Regulation timelines, NHTSA FMVSS 111 rear-visibility filings, and OICA light-vehicle production tables, followed by UN Comtrade HS 8525 shipment statistics, patent families mined through Questel, and peer-reviewed optics papers on edge image stitching. Government import logs and traffic authority tenders added volume signals, while company 10-Ks and investor decks revealed average selling prices. Access to D&B Hoovers and Marklines let us cross-check supplier revenues and platform fitment ratios. This list is illustrative; dozens of other databases and public papers were reviewed to corroborate trends and numbers.
Market-Sizing & Forecasting
We anchor totals with a top-down construct that multiplies light-vehicle output plus new fixed-surveillance installations by verified multi-camera penetration rates, subsequently fine-tuning with sampled ASP × volume roll-ups from supplier disclosures. Key variables include regional ADAS mandate start dates, average cameras per vehicle, sensor resolution mix, ECU cost curves, and urban CCTV project counts. A multivariate regression, refreshed annually, relates those drivers to historic revenues. Scenario analysis captures upside from Level-3 automation or delays in city budgets. Gaps in bottom-up estimates are patched using shipment triangulation from customs records.
Data Validation & Update Cycle
Outputs pass three tiers of analyst review: variance checks against independent safety-recall data, benchmark comparisons with new patent citation counts, and a final sanity round before sign-off. Reports are rebuilt each year, and we push interim updates when material events shift key drivers.
Why Mordor's Multi Camera System Baseline Commands Reliability
Benchmark comparison
Published estimates often diverge because firms apply dissimilar scopes, pricing ladders, and refresh cadences.
We explain below where major gaps emerge.
| Market Size | Anonymized source | Primary gap driver | ||
|---|---|---|---|---|
USD 2.47 B (2025) | Mordor Intelligence | - | Anonymized source:Mordor Intelligence | Primary gap driver:- |
USD 1.97 B (2024) | Regional Consultancy A | Focuses on passenger vehicles only and counts park-assist units; excludes industrial and security deployments | ||
USD 217.54 B (2025) | Global Consultancy B | Sweeps in smartphones, general CCTV and drone rigs, applies vendor revenue roll-up without penetration cross-checks |
Pricing Strategy for Semiconductor Components
3 Min Read
Accelerating Additive Manufacturing Adoption in India
3 Min Read
Driving Growth in Hong Kong’s Auditing & Accounting Market
4 Min Read
When decisions matter, industry leaders turn to our analysts. Let’s talk.