
MTOR Inhibitors Market Size and Share
Market Overview
| Study Period | 2020 - 2031 |
|---|---|
| Market Size (2026) | USD 8.77 Billion |
| Market Size (2031) | USD 11.88 Billion |
| Growth Rate (2026 - 2031) | 6.27 % |
| Fastest Growing Market | Asia-Pacific |
| Largest Market | North America |
| Market Concentration | Medium |
Major Players *Disclaimer: Major Players sorted in no particular order Image © Mordor Intelligence. Reuse requires attribution under CC BY 4.0. | |
MTOR Inhibitors Market Analysis by Mordor Intelligence
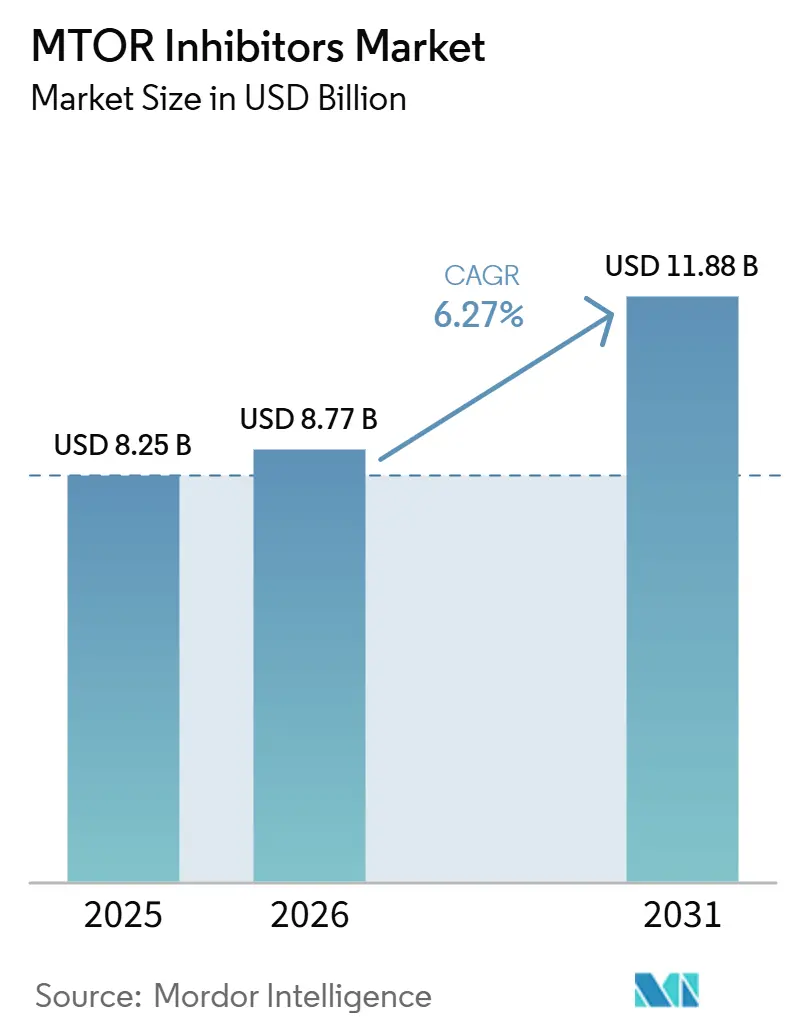
The MTOR Inhibitors Market size is expected to increase from USD 8.25 billion in 2025 to USD 8.77 billion in 2026 and reach USD 11.88 billion by 2031, growing at a CAGR of 6.27% over 2026-2031.
The rising cancer burden supports demand for therapies that act on the PI3K-AKT-mTOR pathway, while expanding oncology capacity can widen access to these medicines in later treatment lines. Global cancer estimates recorded 20.6 million new cases and 9.8 million deaths in 2024, and projected 34.4 million new cases by 2050. The mTOR inhibitors market also draws durable demand from transplant care because recipients require long-term immunosuppression after surgery. Record transplant activity, generic availability, and more focused treatment selection shape the direction of the mTOR inhibitors market, while metabolic toxicity and competition from other oncology regimens limit broader use. The mTOR inhibitors market is moving toward a more divided competitive setting, with established oral therapies facing generic pressure and newer agents, local delivery systems, and rare-disease formulations creating differentiated opportunities.
Key Report Takeaways
- By product type, Everolimus held 35.31% revenue share in 2025, while Nab-Sirolimus is forecast to expand at a 10.38% CAGR through 2031.
- By indication, Organ Transplantation held 38.44% revenue share in 2025, while Rare Genetic Diseases is forecast to expand at an 11.52% CAGR through 2031.
- By route of administration, Oral Administration held 78.24% revenue share in 2025, while Intravenous Administration is forecast to expand at an 8.22% CAGR through 2031.
- By formulation, Oral Tablets held 68.56% revenue share in 2025, while Albumin-Bound Injectable Formulations is forecast to expand at a 10.95% CAGR through 2031.
- By distribution channel, Hospital Pharmacies held 46.56% revenue share in 2025, while Online Pharmacies is forecast to expand at a 9.95% CAGR through 2031.
- By geography, North America held 38.61% revenue share in 2025, while Asia-Pacific is forecast to grow at a 8.65% CAGR through 2031.
Note: Market size and forecast figures in this report are generated using Mordor Intelligence’s proprietary estimation framework, updated with the latest available data and insights as of January 2026.
Market Trends and Insights
Drivers Impact Analysis of MTOR Inhibitors Market*
| Driver | (~) % Impact on CAGR Forecast | Geographic Relevance | Impact Timeline |
|---|---|---|---|
| Rising Cancer Incidence and Demand for Targeted Therapies | +1.4% | Global, with the highest burden in Asia, North America, and Europe | Long term (≥ 4 years) |
| Growing Organ Transplantation Activity | +1.0% | Global, with concentrated impact in North America, Europe, and Asia-Pacific | Medium term (2-4 years) |
| Expansion of Generic mTOR Inhibitor Availability | +0.8% | Global, with primary manufacturing and pricing impact in Asia-Pacific, South America, and Middle East and Africa | Short term (≤ 2 years) |
| Precision Oncology and Biomarker-Guided Treatment | +0.7% | North America and Europe, with spillover to core Asia-Pacific markets | Medium term (2-4 years) |
| mTOR Inhibitor and Immune Checkpoint Inhibitor Combinations | +0.5% | North America, Europe, and China | Long term (≥ 4 years) |
| Expansion of Localized and Rare-Disease Formulations | +0.4% | North America and Europe | Medium term (2-4 years) |
| Source: Mordor Intelligence | |||
Rising Cancer Incidence and Demand for Targeted Therapies
Cancer care remains a central source of demand for the mTOR inhibitors market because these medicines have roles in several established oncology treatment pathways. Global estimates identified 20.6 million new cancer diagnoses and 9.8 million deaths in 2024, then projected 34.4 million new cases by 2050, a 67% increase. Asia accounted for more than 50% of cases despite representing 58.8% of the global population, leaving substantial unmet care needs in settings with limited oncology resources. Patient access depends on diagnostic capacity, specialist availability, and availability of later-line medicines, so epidemiological growth alone will not determine treatment use as India, China, and Southeast Asian countries build oncology capacity. In renal cell carcinoma, everolimus has an established place after VEGF-directed therapy, which keeps the drug relevant when earlier regimen choices have been exhausted. The FDA approval of gedatolisib in July 2026 added a targeted option for PIK3CA wild-type HR-positive and HER2-negative advanced breast cancer, widening the relevant patient population for pathway-directed treatment.
Growing Organ Transplantation Activity
Growing transplant activity provides a long duration source of prescribing for sirolimus and everolimus in the mTOR inhibitors market. Global programs performed 173,727 solid organ transplants in 2024, the highest annual volume reported by the Global Observatory on Donation and Transplantation, following a 2% year-on-year increase. Kidney procedures accounted for 110,467 transplants, or 63.6% of the total, and mTOR inhibitors can be useful in regimens intended to reduce calcineurin inhibitor exposure. At the end of 2024, 668,160 patients were on waiting lists in 75 countries, while 31,853 died before receiving an organ, showing that demand remains far larger than organ supply. Spain recorded 53.9 deceased donors per million population, and India reported 15,504 living donors, showing that mature and expanding programs can both support treatment demand. This need for long-term follow-up and maintenance medicines supports further program development and sustained prescribing.
Expansion of Generic mTOR Inhibitor Availability
Generic availability can expand the mTOR inhibitors market by reducing treatment costs for patients and payers. Lower unit prices can improve access through public transplant programs and other cost-sensitive healthcare systems. This can matter where health systems must balance long-term transplant medication needs against limited specialty-drug budgets. India and China remain important sources of active pharmaceutical ingredients and finished medicines for this therapy class. Concord Biotech reported that it supplies sirolimus, everolimus, and temsirolimus active pharmaceutical ingredients to more than 70 countries from facilities certified by the U.S. Food and Drug Administration, European Union Good Manufacturing Practice authorities, Japan’s Pharmaceuticals and Medical Devices Agency, and Brazil’s National Health Surveillance Agency[1]Concord Biotech Limited, “Q1 FY26 Investor Presentation,” Concord Biotech, concordbiotech.com.. The wider supplier base creates price pressure for established brands but may also increase the number of patients able to receive maintenance treatment.
Precision Oncology and Biomarker-Guided Treatment
Biomarker-guided care is changing how prescribers select mTOR pathway therapies in the mTOR inhibitors market. PIK3CA and TSC1 or TSC2 mutation status can identify patient groups more precisely than tumor site alone, shifting selection toward biological features that may influence treatment response. The FDA approval for gedatolisib in PIK3CA wild-type HR-positive and HER2-negative breast cancer tied a dual PI3K and mTOR inhibitor to a defined molecular group. It is notable because it defines a therapy population by the absence of a particular mutation within an established cancer subtype. A Phase 0/1 study of ribociclib and everolimus in recurrent high-grade glioma used single-nucleus transcriptomics and pharmacokinetics to examine changes in malignant cell states, supporting more selective use where molecular profiles indicate a greater likelihood of benefit. Companion diagnostic requirements are also affecting testing and prescribing workflows in major oncology markets.
Restraints Impact Analysis of MTOR Inhibitors Market*
| Restraint | (~) % Impact on CAGR Forecast | Geographic Relevance | Impact Timeline |
|---|---|---|---|
| Dose-Limiting Metabolic and Immunosuppressive Toxicities | -1.1% | Global, with high clinical impact in North America and Europe | Short term (≤ 2 years) |
| Competition from Immune Checkpoint and VEGF-Targeted Therapies | -0.9% | North America, Europe, and core Asia-Pacific markets | Medium term (2-4 years) |
| Complex Exposure Management Across Formulations and Indications | -0.6% | Global, with regulatory compliance pressure in North America and Europe | Short term (≤ 2 years) |
| Limited Predictive Biomarker Adoption in Routine Care | -0.4% | Asia-Pacific, South America, and Middle East and Africa | Medium term (2-4 years) |
| Source: Mordor Intelligence | |||
Dose-Limiting Metabolic and Immunosuppressive Toxicities
Metabolic and immunosuppressive toxicities restrict use across the mTOR inhibitors market. Hyperglycemia was reported in 12-50% of patients receiving everolimus and temsirolimus in Phase III oncology trials, while grade 3-4 hyperglycemia occurred in 4-12% of cases[2]UT MD Anderson Cancer Center and NCI PAM Task Force, “Management of Metabolic Effects Associated with Anticancer Agents Targeting the PI3K-Akt-mTOR Pathway,” UT MD Anderson Cancer Center, mdanderson.elsevierpure.com.. These effects can require monitoring by oncology, endocrinology, dietetics, and primary care teams. Community treatment settings may not have the same capacity to manage this additional care burden as academic centers and specialty hubs. The resulting complexity can lead to dose reduction or discontinuation and can concentrate treatment in more specialized settings. The risk is especially relevant in transplant recipients with underlying metabolic and cardiovascular vulnerability.
Competition from Immune Checkpoint and VEGF-Targeted Therapies
Competition from immune checkpoint inhibitors and VEGF-targeted therapies constrains the mTOR inhibitors market in several oncology settings. In renal cell carcinoma, first-line treatment has shifted toward combination immunotherapy regimens. This shift places mTOR inhibitors more often in later treatment lines, where prior treatment can narrow the period of clinical benefit. A 2026 systematic review and meta-analysis of randomized glioblastoma trials associated mTOR inhibitors with worse overall survival than control treatments, with a hazard ratio of 1.43 and a 95% confidence interval of 1.08-1.89. The same review found modest but statistically significant progression-free survival benefits for immune checkpoint inhibitors. Developers are therefore evaluating rational combinations with checkpoint inhibitors, although these programs need time to establish commercially relevant results.
*Our forecasts treat driver/restraint impacts as directional, not additive. The impact forecasts reflect baseline growth, mix effects, and variable interactions.
MTOR Inhibitors Market Segment Analysis
By Product Type:
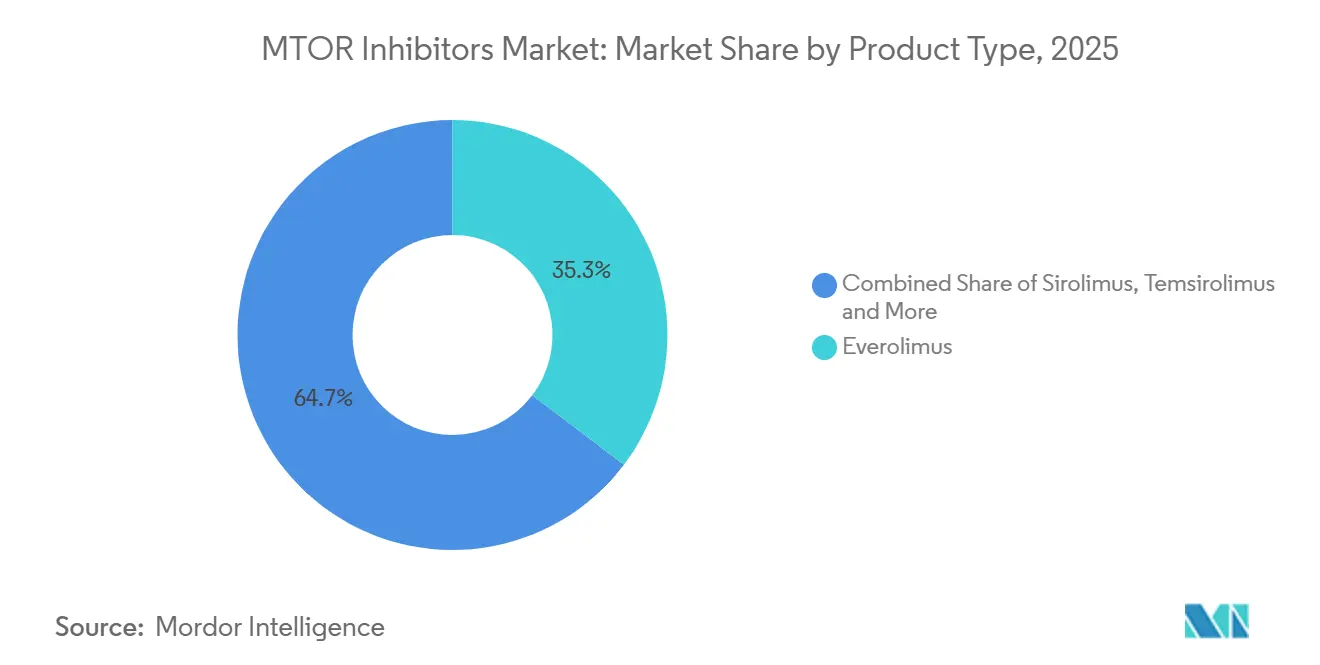
Everolimus Anchors Revenue While Nab-Sirolimus Scales UpEverolimus held 35.31% of the mTOR inhibitors market share by product type in 2025. Its revenue position rests on approved use across advanced renal cell carcinoma, HR-positive and HER2-negative breast cancer, pancreatic neuroendocrine tumors, subependymal giant cell astrocytoma associated with tuberous sclerosis complex, and solid organ transplantation. The medicine is sold under brands including Afinitor, Afinitor Disperz, Zortress, and Certican. This range of uses gives everolimus a broader base than a single-indication therapy. Evidence in pediatric tuberous sclerosis complex also supported the adjunctive antiepileptic use of mTOR inhibitors across different seizure-onset ages. Sirolimus supports transplant immunosuppression, while temsirolimus retains an intravenous oncology role. Ridaforolimus and other products add investigational activity, including next-generation dual mTORC1 and mTORC2 compounds. The diversity of product profiles keeps the mTOR inhibitors market tied to both mature and emerging clinical uses.
Nab-Sirolimus is forecast to grow at a 10.38% CAGR through 2031, making it the fastest-growing product type in the mTOR inhibitors market. The medicine is marketed as Fyarro for advanced malignant PEComa. Aadi Bioscience reported USD 24.4 million in annual Fyarro revenue, while its SARC046 Phase 2 study in epithelioid hemangioendothelioma was presented at ASCO 2026[3]Aadi Bioscience, “Aadi Bioscience Announces Financial Results for Q2 2024,” SEC Filing, sec.gov.. Its albumin-bound nanoparticle delivery approach is intended to increase intratumoral drug accumulation compared with oral rapalogs. This pharmacokinetic difference is relevant for mTOR-driven tumors with few established treatment choices. Long-term AMPECT data also supported the efficacy and safety profile of Fyarro in malignant PEComa. Product differentiation therefore depends less on the established rapalog class and more on delivery technology and targeted use.



By Indication:
Organ Transplantation Leads, Rare Diseases Accelerate FastestOrgan Transplantation accounted for 38.44% of the mTOR inhibitors market size by indication in 2025. This leading role reflects the 173,727 solid organ transplants performed globally in 2024 and the lifelong immunosuppression needs of kidney, liver, heart, and lung recipients. Sirolimus and everolimus are used in calcineurin-sparing regimens when nephrotoxicity needs to be reduced. This consideration is important for the 110,467 kidney transplant recipients recorded in 2024. Oncology forms another major demand area for everolimus and temsirolimus. Their established uses include renal cell carcinoma, breast cancer, and pancreatic neuroendocrine tumors. Autoimmune and inflammatory diseases, cardiovascular and antirestenosis uses, and neurological conditions contribute additional volumes.
Rare Genetic Diseases is forecast to expand at an 11.52% CAGR through 2031. The segment includes treatment demand related to tuberous sclerosis complex and rare dermatologic conditions. Topical sirolimus programs are also being developed for vascular malformations and other rare skin disorders. Palvella Therapeutics received FDA Fast Track Designation for QTORIN rapamycin gel in venous malformations in April 2024. The company later reported positive Phase 2 TOIVA topline results. These programs seek to serve conditions without approved therapies and can create a specialized area of demand. The mTOR inhibitors industry therefore extends beyond its long-standing transplant and oncology base.
By Route of Administration:
Oral Delivery Dominates, Intravenous Formats Grow BrisklyOral Administration captured 78.24% of revenue in 2025, reflecting the practical role of oral everolimus and sirolimus in oncology and transplant maintenance. Tablets and capsules enable outpatient treatment and reduce the need for repeated facility visits. This approach supports routine maintenance prescribing after transplantation. Oral sirolimus has variable bioavailability of 15%, which can make therapeutic drug monitoring necessary to maintain target blood concentrations. That monitoring requirement can add work for treatment teams and patients. It can also create adherence challenges outside specialized transplant centers. Even so, oral delivery remains the principal treatment format because it fits the long-term use of established products. The mTOR inhibitors market continues to rely on this format for its largest share of therapy volume.
Intravenous Administration is forecast to expand at an 8.22% CAGR through 2031. Temsirolimus infusion remains relevant in later-line renal cell carcinoma care. Nab-sirolimus also uses intravenous administration in PEComa and investigational solid-tumor trials. These medicines make infusion settings important for patients whose treatment requires closer observation. Topical Administration currently represents a small revenue base but has development potential in rare dermatologic disease. Palvella’s Phase 3 SELVA study in microcystic lymphatic malformations and Phase 2 LOTU study for angiokeratomas support this opportunity. In June 2025, Palvella secured a sixth U.S. patent covering 0.1-20% anhydrous mTOR inhibitor compositions, including everolimus and temsirolimus, across dermatologic conditions. Other routes include local delivery through drug-eluting balloon and stent platforms.
By Formulation:
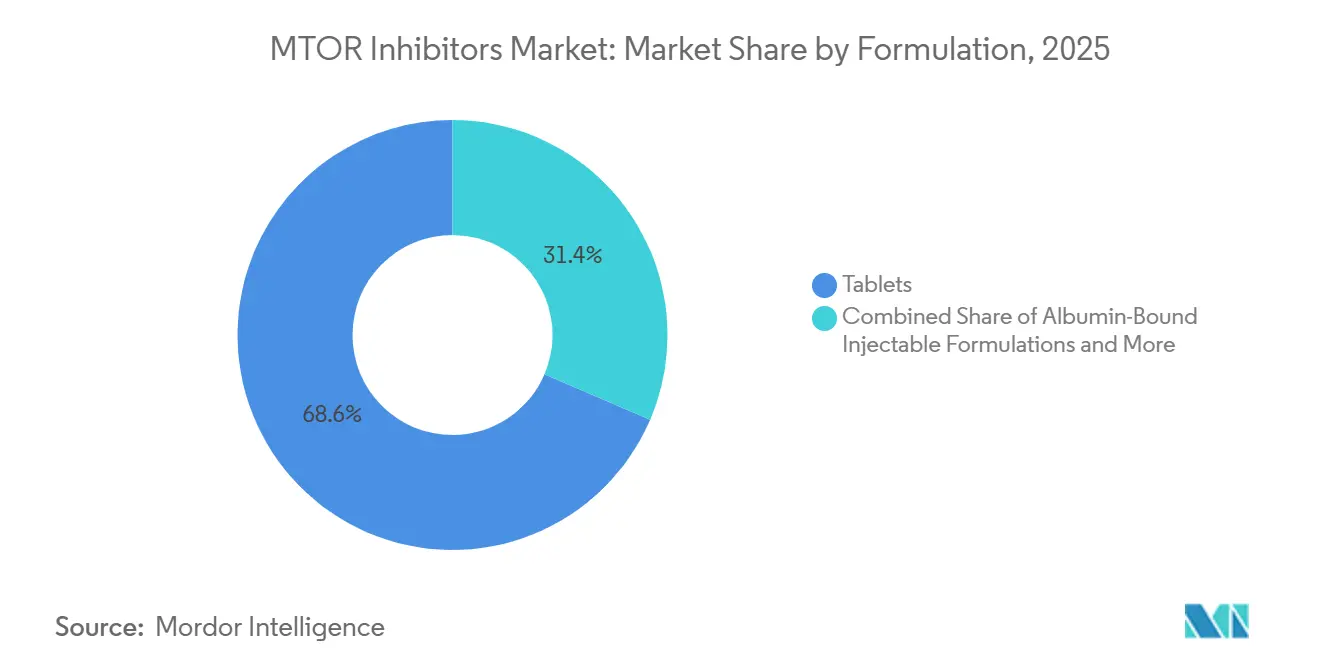
Tablets Dominate, Albumin-Bound Injectables Signal Innovation TrajectoryOral Tablets held 68.56% revenue share in 2025. This category includes branded and generic everolimus tablets, including Afinitor, Afinitor Disperz, and Zortress, as well as sirolimus tablets such as Rapamune. These formulations are used across transplant and oncology care. Generic competition can preserve tablet volume even as unit prices decline. Capsules account for a smaller part of oral prescribing. Injectable solutions support temsirolimus and standard sirolimus use in selected protocols. The formulation mix of the mTOR inhibitors market therefore combines high-volume, established oral products with smaller formats used in more specific care settings. Patent expiries for everolimus can further reinforce the shift toward generic tablets.
Albumin-Bound Injectable Formulations are forecast to expand at a 10.95% CAGR through 2031, the highest formulation-level rate in the mTOR inhibitors market. Nab-sirolimus uses albumin-bound nanoparticles to support higher intratumoral drug delivery than oral rapalogs. Its performance is linked to transport mechanisms involving secreted protein acidic and rich in cysteine, or SPARC. Long-term AMPECT evidence was published in the Journal of Clinical Oncology in March 2024. This evidence gives the formulation a clinical basis for use in malignant PEComa. Drug-eluting balloons and devices combine sirolimus with catheter-based delivery to arterial walls. Their development connects the therapy class with interventional cardiology and peripheral vascular care. The category shows how delivery methods can create differentiated clinical positions within an established drug class.
By Distribution Channel:
Hospital Pharmacies Lead, Online Platforms Gain Share RapidlyHospital Pharmacies commanded 46.56% of revenue in 2025. Their leading position reflects infusion-center use of intravenous mTOR therapies and the specialized handling required for transplant protocols. Hospital systems can coordinate dispensing with laboratory monitoring, dose adjustment, and clinical follow-up. This coordination matters for complex oncology and post-transplant treatment plans. Specialty Pharmacies remain important for oral oncology medicines that require patient counseling and prior authorization support. Retail pharmacies serve lower-complexity maintenance prescriptions. These channels keep the mTOR inhibitors market accessible to patients who do not need infusion care or hospital-led dispensing. Channel choice remains closely tied to treatment complexity and clinical monitoring needs.
Online Pharmacies are forecast to grow at a 9.95% CAGR through 2031. Their expansion follows wider telepharmacy infrastructure and demand for home delivery of chronic oral treatments. This model can be relevant for patients using sirolimus for transplant maintenance. Digital dispensing may reduce travel needs for refills, especially when treatment is stable. It does not replace the monitoring and counseling needed for complex regimens. Requirements linked to Risk Evaluation and Mitigation Strategies can also affect which providers handle particular mTOR agents. The mTOR inhibitors market can therefore support online growth while retaining hospital and specialty pharmacy roles for higher-acuity care. The balance between convenience, oversight, and reimbursement will shape channel development.
Geography Analysis
North America and Europe MTOR Inhibitors Market
North America accounted for 38.61% of the mTOR inhibitors market share in 2025. The United States recorded 16,989 deceased donors in 2024, or 49.7 per million population, and has a well-developed specialty oncology pharmacy system. These conditions support use of branded everolimus and temsirolimus in renal cell carcinoma and breast cancer care. The FDA approval of gedatolisib in July 2026 introduced the first approved therapy that inhibits all class I PI3K isoforms and both mTOR complexes for a defined advanced breast cancer population. Europe formed the second-largest regional base, led by Germany, France, the United Kingdom, Italy, and Spain. Spain’s 53.9 deceased donors per million population supported a high transplant volume relative to its population. Its structured transplant system and reimbursement environment sustain sirolimus and everolimus demand.
APAC MTOR Inhibitors Market
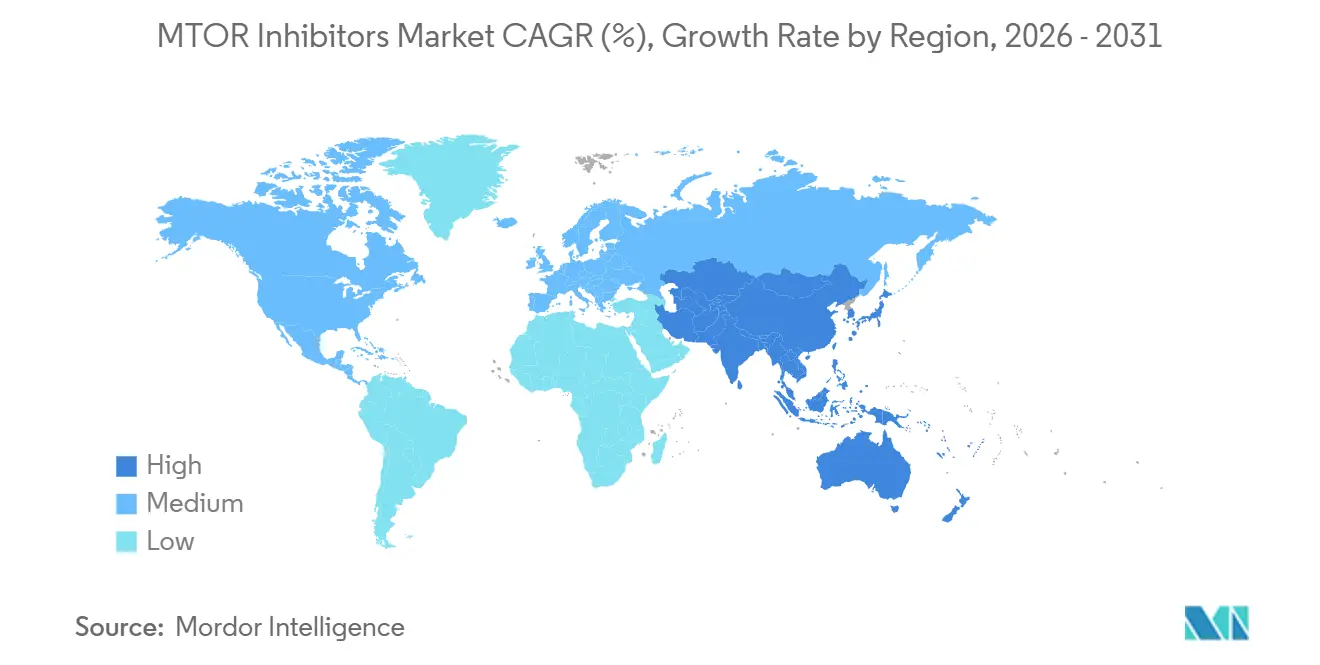
Asia-Pacific is forecast to grow at an 8.65% CAGR through 2031, the fastest regional rate in the mTOR inhibitors market. India reported 15,504 living donors in 2024, while Turkey recorded 54 living donors per million population. These figures show the continuing expansion of transplant capacity across South and West Asia. China performs more than 20,000 organ transplant procedures annually and is an important source of active pharmaceutical ingredients for global supply. India’s Hyderabad everolimus active pharmaceutical ingredient clusters expanded capacity by 40% after 2024. This change gives the country a greater role in generic supply and pricing. Japan and South Korea can adopt newer pathway therapies more quickly because of their established oncology systems and precision medicine frameworks.
MEA and South America MTOR Inhibitors Market
South America, the Middle East, and Africa represent smaller but expanding parts of the mTOR inhibitors market. Brazil leads demand in South America because its SUS public health system includes mTOR immunosuppressants in transplant medication coverage. Argentina and other South American countries add generic treatment volume. Saudi Arabia and the United Arab Emirates are expanding transplant infrastructure under national healthcare transformation programs. These investments can create new demand for branded and generic immunosuppressants. South Africa acts as a gateway for specialty medicines in Africa, although access limits and formulary restrictions constrain wider regional use. The geographic pattern contrasts North America’s branded, precision-oncology focus with Asia-Pacific’s generic and transplant-led expansion.

Competitive Landscape
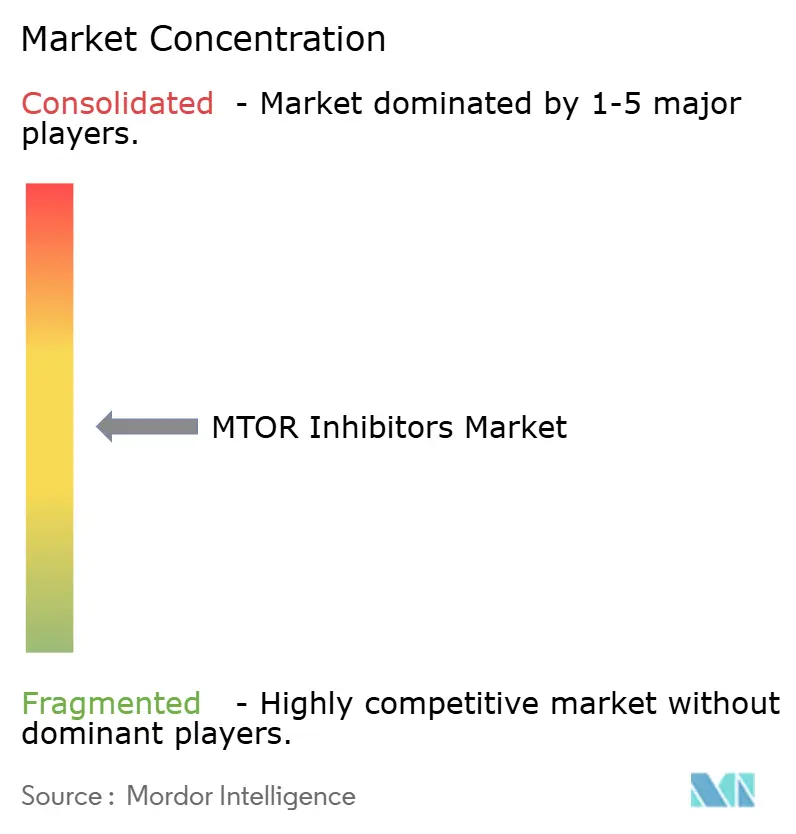
The mTOR inhibitors market is moderately consolidated at the branded level and fragmented in generic supply. Novartis, through Afinitor, Zortress, and Certican, and Pfizer, through Torisel, hold established positions in oncology and transplantation. Generic competition includes Dr. Reddy’s Laboratories, Teva Pharmaceutical, Viatris, Hikma Pharmaceuticals, Biocon, Gland Pharma, Zydus Lifesciences, Alkem Laboratories, and Intas Pharmaceuticals. Concord Biotech supplies sirolimus, everolimus, and temsirolimus active pharmaceutical ingredients from 2 fermentation facilities with combined capacity of 1,250 cubic meters. The company reported regulatory certifications that support supply to more than 70 countries. This upstream role makes active pharmaceutical ingredient supply an important element of competition. The mTOR inhibitors market includes both brand-led differentiation and cost-led generic manufacturing.
Concept Medical has built a focused position in sirolimus-coated balloons through its SIRONA, SirPAD, and MAGICAL programs. Its SIRONA 3-year data presented in April 2026 showed 88.2% freedom from clinically driven target lesion revascularization for MagicTouch PTA, compared with 80.2% for paclitaxel-coated balloons. This evidence supports a clinical and regulatory position that differs from oral pharmaceutical competition. Palvella Therapeutics is developing a topical rapamycin platform for rare dermatologic diseases with no FDA-approved therapies. The company announced a sixth U.S. patent in June 2025 for anhydrous mTOR inhibitor compositions. These strategies show how localized delivery and rare-disease development can create smaller, protected treatment niches. Device compliance requirements in Europe can favor companies with established regulatory documentation.
Celcuity’s July 2026 approval for gedatolisib positioned the company as the first approved developer of a dual pan-PI3K and mTOR inhibitor. The approval gives a smaller biotechnology company an early role in a differentiated mechanism. Novartis and Pfizer must defend established therapy positions against lower-priced generic products while funding next-generation pathway programs. Combinations may become another important competitive area. A multicenter Phase 1/2 study reported a 52.4% objective response rate for onatasertib, a dual TORC1 and TORC2 inhibitor, combined with toripalimab in cervical cancer. This result supports continued development interest in mTOR and checkpoint inhibitor combinations. The mTOR inhibitors market therefore remains open to innovations that offer clinically distinct mechanisms or delivery approaches.
MTOR Inhibitors Industry Leaders
Novartis AG
Pfizer Inc.
Aadi Bioscience, Inc.
Teva Pharmaceutical Industries Ltd.
Dr. Reddy’s Laboratories Ltd.
- *Disclaimer: Major Players sorted in no particular order
MTOR Inhibitors Market Companies Covered in this Report
- Aadi Bioscience, Inc.
- Abbvie
- Accord Healthcare
- Alkem Laboratories Ltd.
- Apotex
- Biocon
- Concept Medical
- Concord Biotech Limited
- Dr. Reddy’s Laboratories
- Endo International
- FUJIFILM
- GLAND PHARMA
- Glenmark Pharmaceuticals
- Hikma Pharmaceuticals
- Intas Pharmaceutical
- Medtronic
- Novartis
- Palvella Therapeutics, Inc.
- Par Pharmaceutical, Inc.
- Pfizer
- Teva Pharmaceutical Industries
- Viatris
- Zydus Lifesciences Limited

Recent Industry Developments in MTOR Inhibitors Market
- July 2026: The FDA approved Revtorpyk (gedatolisib) by Celcuity Inc. for HR+/HER2−, PIK3CA wild-type locally advanced or metastatic breast cancer, making it the first and only FDA-approved therapy to inhibit all class I PI3K isoforms and both mTOR complexes (mTORC1 and mTORC2).
- April 2026: Concept Medical released preliminary 3-year SIRONA trial data at the Charing Cross Symposium 2026, showing MagicTouch PTA achieved 88.2% freedom from clinically driven target lesion revascularization vs 80.2% for paclitaxel-coated balloons (Log-rank p=0.03, HR: 0.60), the first such long-term randomized comparative evidence in femoropopliteal disease.


Global MTOR Inhibitors Market Report Scope
As per the scope of the report, mTOR inhibitors are a class of drugs that specifically target and block the activity of the mammalian target of rapamycin (mTOR), a key protein kinase involved in regulating cell growth, proliferation, metabolism, and survival. These inhibitors are used in various medical applications, particularly in cancer therapy and immunosuppression after organ transplantation.
The mTOR inhibitors market is segmented by product type into sirolimus, everolimus, temsirolimus, nab-sirolimus, ridaforolimus, and other product types. By indication, the market is segmented into oncology, organ transplantation, autoimmune and inflammatory diseases, rare genetic diseases, cardiovascular and antirestenosis applications, neurological and neurodegenerative diseases, and other therapeutic indications. By route of administration, the market is segmented into oral administration, intravenous administration, topical administration, and other routes of administration. By formulation, the market is segmented into tablets, capsules, injectable solutions, albumin-bound injectable formulations, topical gels and creams, and drug-eluting balloons and devices. By distribution channel, the market is segmented into hospital pharmacies, specialty pharmacies, retail pharmacies, online pharmacies, and other distribution channels. By geography, the market is segmented into North America, Europe, Asia-Pacific, Middle East and Africa, and South America. The market report also covers the estimated market sizes and trends for 17 countries across major regions globally. For each segment, the market size and forecast are provided in terms of value (USD).
| Sirolimus |
| Everolimus |
| Temsirolimus |
| Nab-Sirolimus |
| Ridaforolimus |
| Other Product Types |
| Oncology |
| Organ Transplantation |
| Autoimmune and Inflammatory Diseases |
| Rare Genetic Diseases |
| Cardiovascular and Antirestenosis Applications |
| Neurological and Neurodegenerative Diseases |
| Other Therapeutic Indications |
| Oral Administration |
| Intravenous Administration |
| Topical Administration |
| Other Routes of Administration |
| Tablets |
| Capsules |
| Injectable Solutions |
| Albumin-Bound Injectable Formulations |
| Topical Gels and Creams |
| Drug-Eluting Balloons and Devices |
| Hospital Pharmacies |
| Specialty Pharmacies |
| Retail Pharmacies |
| Online Pharmacies |
| Other Distribution Channels |
| North America | United States |
| Canada | |
| Mexico | |
| Europe | Germany |
| United Kingdom | |
| France | |
| Italy | |
| Spain | |
| Rest of Europe | |
| Asia-Pacific | China |
| Japan | |
| India | |
| Australia | |
| South Korea | |
| Rest of Asia-Pacific | |
| Middle East and Africa | GCC |
| South Africa | |
| Rest of Middle East and Africa | |
| South America | Brazil |
| Argentina | |
| Rest of South America |
| By Product Type | Sirolimus | |
| Everolimus | ||
| Temsirolimus | ||
| Nab-Sirolimus | ||
| Ridaforolimus | ||
| Other Product Types | ||
| By Indication | Oncology | |
| Organ Transplantation | ||
| Autoimmune and Inflammatory Diseases | ||
| Rare Genetic Diseases | ||
| Cardiovascular and Antirestenosis Applications | ||
| Neurological and Neurodegenerative Diseases | ||
| Other Therapeutic Indications | ||
| By Route of Administration | Oral Administration | |
| Intravenous Administration | ||
| Topical Administration | ||
| Other Routes of Administration | ||
| By Formulation | Tablets | |
| Capsules | ||
| Injectable Solutions | ||
| Albumin-Bound Injectable Formulations | ||
| Topical Gels and Creams | ||
| Drug-Eluting Balloons and Devices | ||
| By Distribution Channel | Hospital Pharmacies | |
| Specialty Pharmacies | ||
| Retail Pharmacies | ||
| Online Pharmacies | ||
| Other Distribution Channels | ||
| By Geography | North America | United States |
| Canada | ||
| Mexico | ||
| Europe | Germany | |
| United Kingdom | ||
| France | ||
| Italy | ||
| Spain | ||
| Rest of Europe | ||
| Asia-Pacific | China | |
| Japan | ||
| India | ||
| Australia | ||
| South Korea | ||
| Rest of Asia-Pacific | ||
| Middle East and Africa | GCC | |
| South Africa | ||
| Rest of Middle East and Africa | ||
| South America | Brazil | |
| Argentina | ||
| Rest of South America | ||


Key Questions Answered in the Report
What is driving demand for mTOR inhibitors?
Cancer treatment needs and long-term transplant immunosuppression are the main demand sources. Global programs performed 173,727 solid organ transplants in 2024.
Which mTOR inhibitor product type is growing fastest?
Nab-Sirolimus is forecast to expand at a 10.38% CAGR through 2031, supported by its albumin-bound delivery approach, use in malignant PEComa, and the highest forecast rate among product types.
Why are generic mTOR inhibitor medicines important?
Generic products can lower treatment costs and expand access, while increasing price competition for established branded medicines.
What limits wider use of mTOR inhibitors?
Hyperglycemia and other metabolic effects can require intensive monitoring, while checkpoint and VEGF-targeted therapies compete in some oncology settings.
Which region is expanding fastest for mTOR inhibitors?
Asia-Pacific is forecast to grow at an 8.65% CAGR through 2031, supported by transplant activity and generic drug manufacturing capacity.
What is the expected value of the mTOR Inhibitors market by 2031?
The mTOR Inhibitors market is projected to reach USD 11.88 billion by 2031, from USD 8.77 billion in 2026.
Page last updated on:





