Monocyte Activation Test Market Size and Share
Market Overview
| Study Period | 2020 - 2031 |
|---|---|
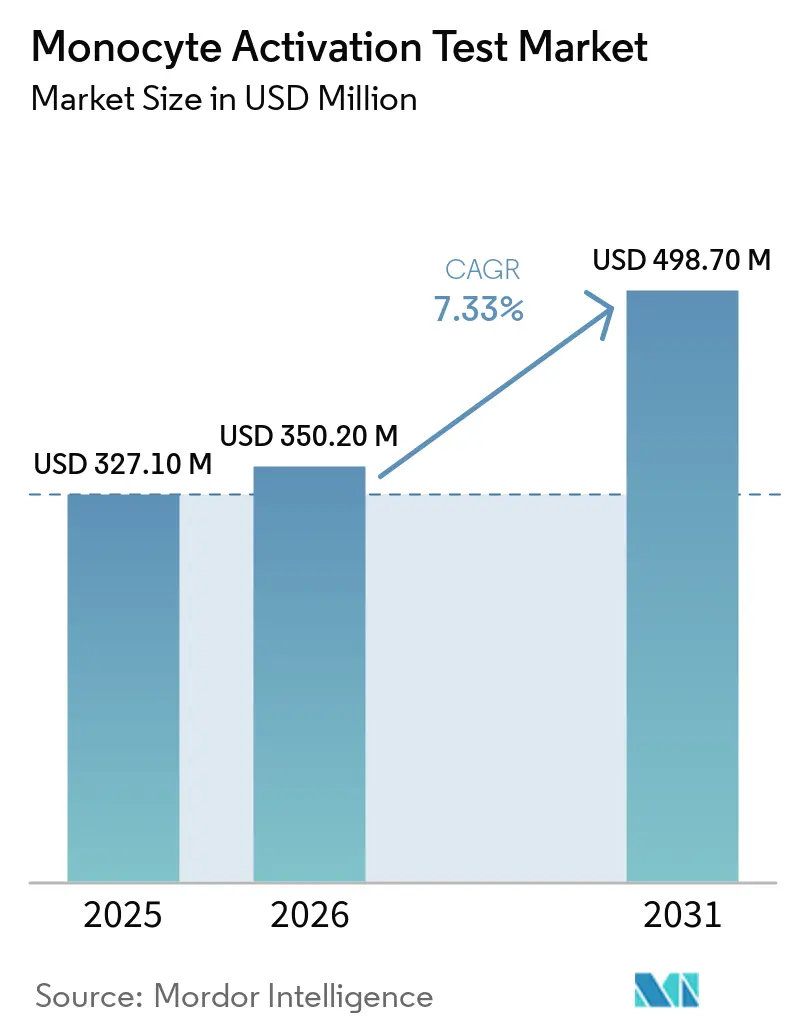
| Market Size (2026) | USD 350.20 Million |
| Market Size (2031) | USD 498.70 Million |
| Growth Rate (2026 - 2031) | 7.33% CAGR |
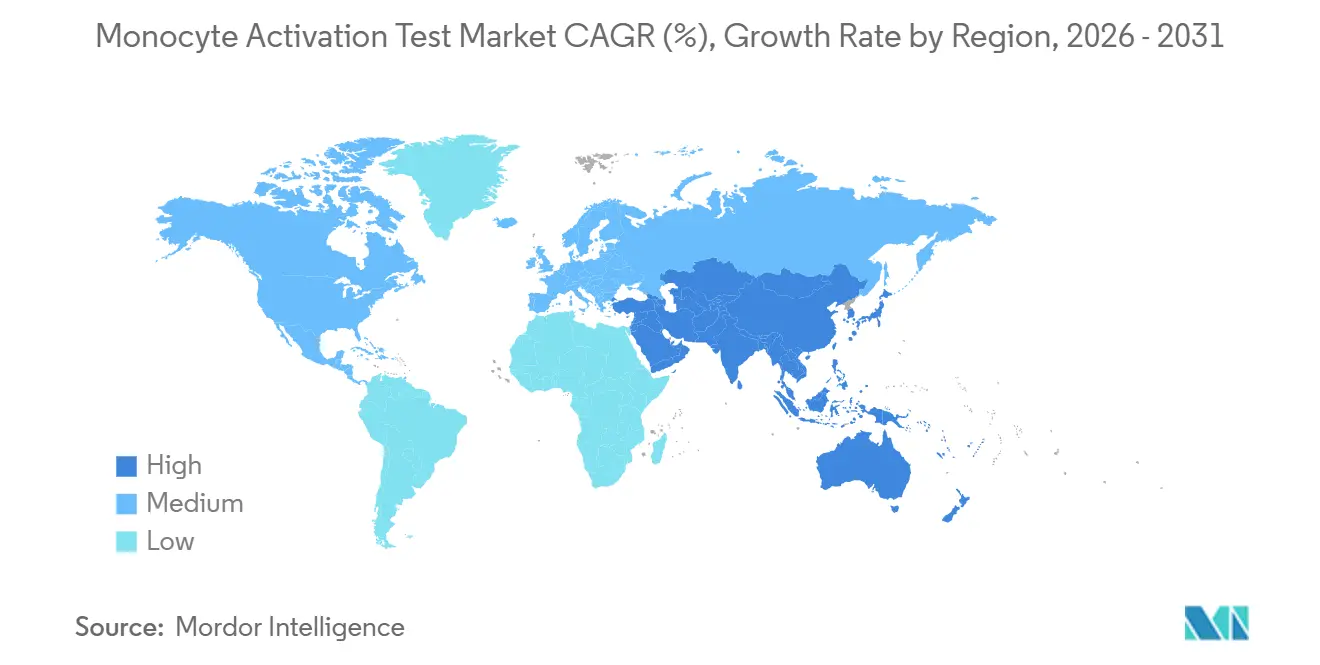
| Fastest Growing Market | Asia Pacific |
| Largest Market | North America |
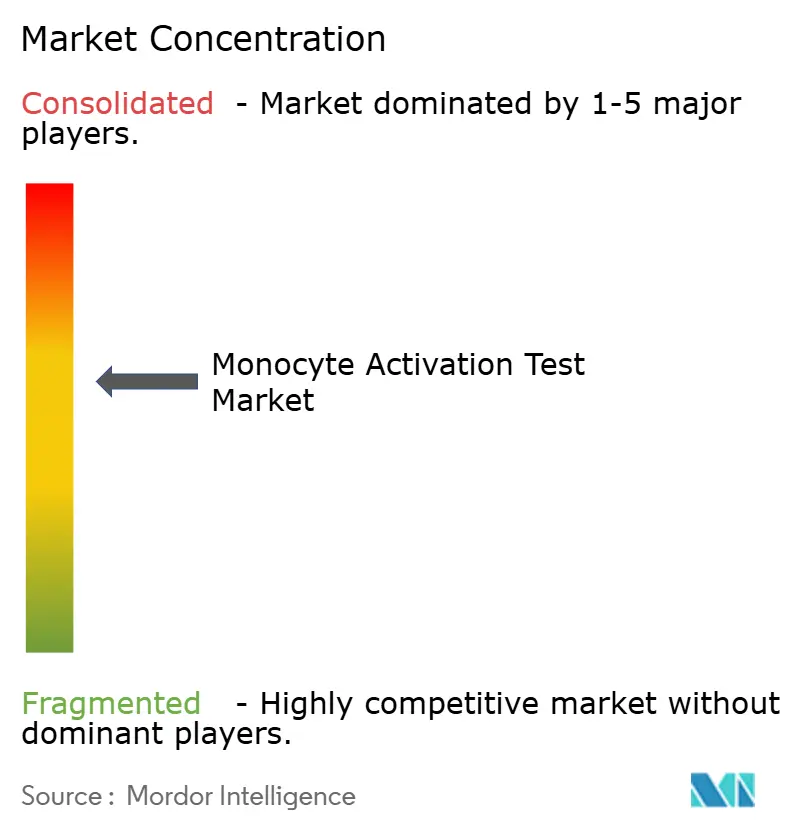
| Market Concentration | Medium |
Major Players *Disclaimer: Major Players sorted in no particular order Image © Mordor Intelligence. Reuse requires attribution under CC BY 4.0. | |
Monocyte Activation Test Market Analysis by Mordor Intelligence
The Monocyte Activation Test Market size is expected to grow from USD 327.10 million in 2025 to USD 350.20 million in 2026 and is forecast to reach USD 498.70 million by 2031 at 7.33% CAGR over 2026-2031.
Demand is rising because human-cell assays detect both endotoxins and non-endotoxins, unlike rabbit pyrogen and bacterial endotoxin tests. Europe’s pharmacopeia has suppressed the rabbit test, forcing manufacturers of biologics, vaccines, and cell therapies to validate MAT or risk release delays [1]European Directorate for the Quality of Medicines & HealthCare, “Rabbit Test Suppression and Chapter 5.1.13,” EDQM.eu. Rapid ELISA, reporter-gene, and digital PCR formats cut turnaround time from 2 days to 5 hours, reducing QC bottlenecks and aligning with real-time release strategies. Gene-therapy safety events in 2025 heightened FDA focus on innate-immune activation, prompting earlier MAT use in development programs. Asia-Pacific’s greenfield biomanufacturing capacity is embracing MAT without legacy rabbit infrastructure, while North America and Europe pursue compliance-driven replacement cycles.
Key Report Takeaways
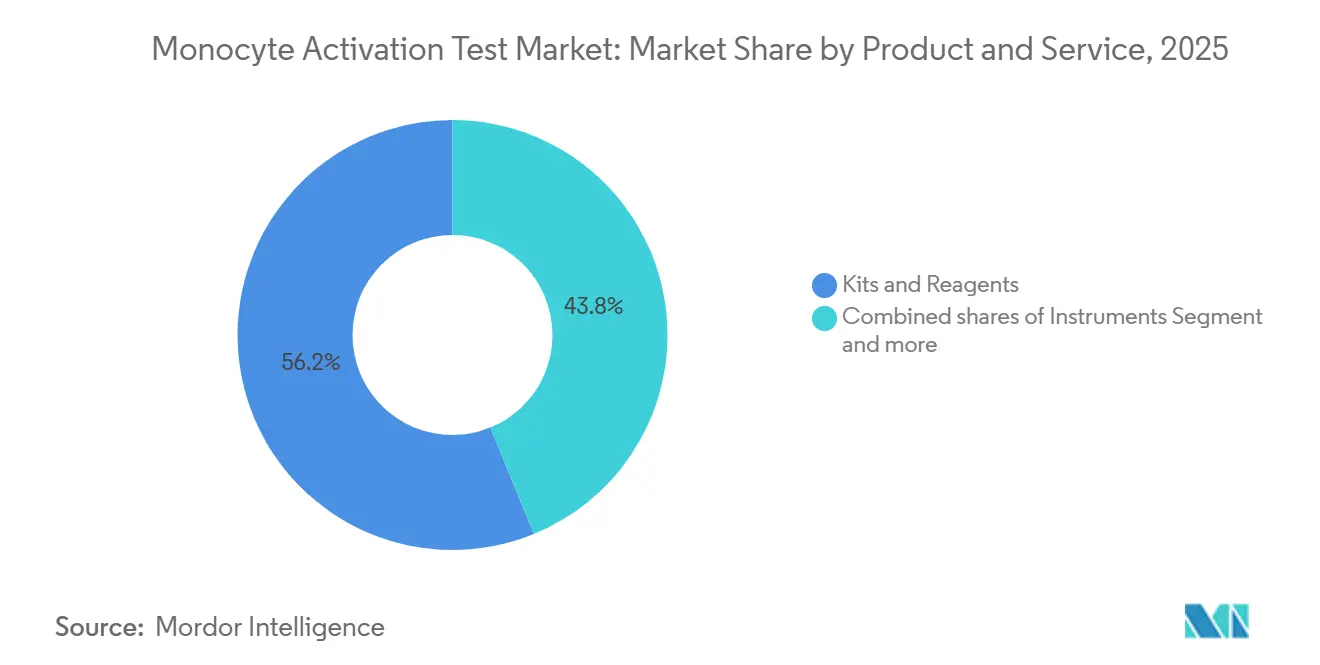
- By products and services, kits and reagents led the monocyte activation test market with 56.18% market share in 2025 and are expanding at a 7.65% CAGR through 2031.
- By source, PBMC-based assays accounted for 43.87% of the monocyte activation test market in 2025, yet cell-line-based systems are growing at 7.93% through 2031.
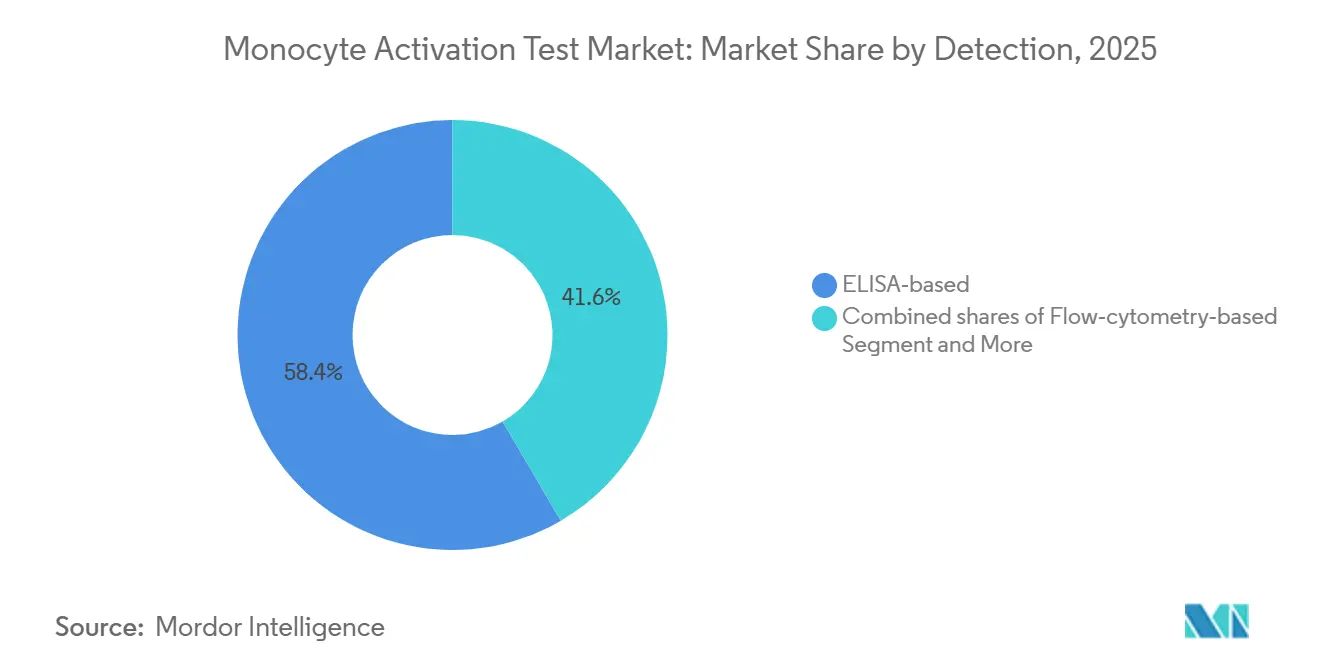
- By detection, ELISA readouts commanded 58.39% of the monocyte activation test market size in 2025, and qPCR / reporter-gene formats are advancing at 8.01% CAGR to 2031.
- By application, drug development and batch release accounted for 44.88% of the monocyte activation test market in 2025, while vaccine development is accelerating at a 7.67% CAGR through 2031.
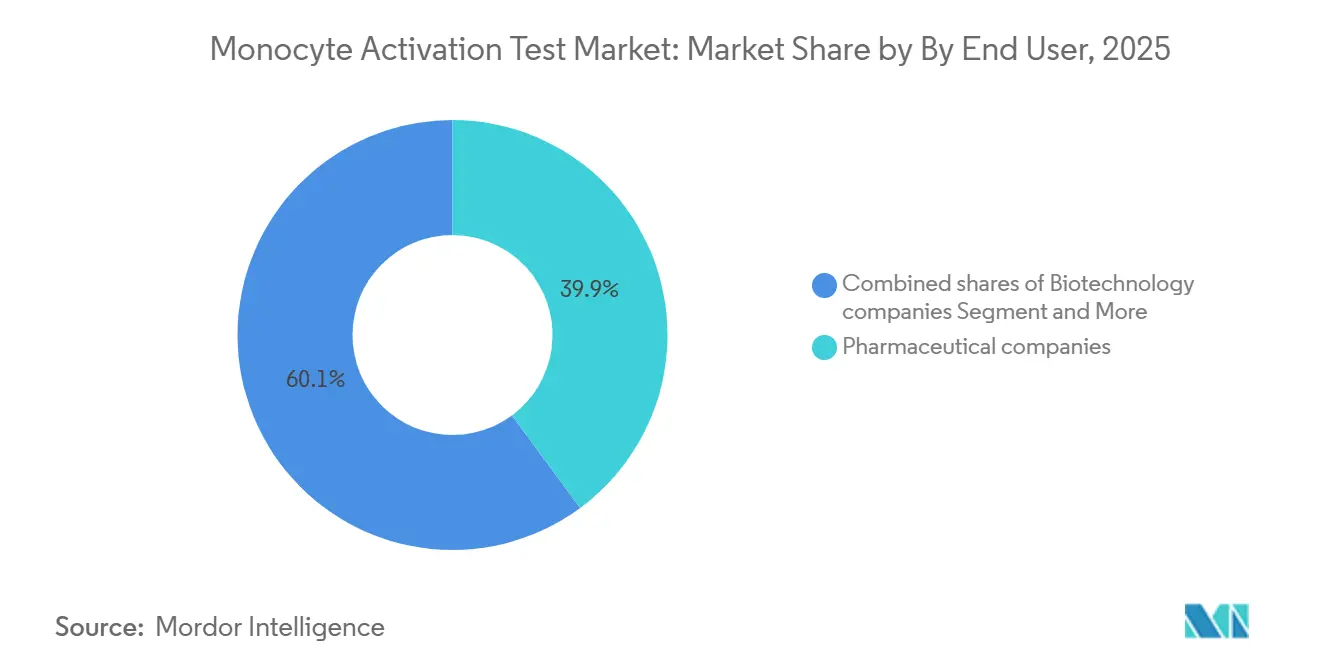
- By end user, pharmaceutical companies captured 39.87% revenue in 2025 and biotechnology companies represent the fastest-growing channel with a 7.76% CAGR over 2026-2031.
- By geography, North America captured 38.39% revenue share in 2025; Asia-Pacific is forecast to register the fastest regional CAGR at 7.59% to 2031.
Note: Market size and forecast figures in this report are generated using Mordor Intelligence’s proprietary estimation framework, updated with the latest available data and insights as of January 2026.
Global Monocyte Activation Test Market Trends and Insights
Drivers Impact Analysis*
| Driver | (~) % Impact on CAGR Forecast | Geographic Relevance | Impact Timeline |
|---|---|---|---|
| Regulatory phase-out of Rabbit Pyrogen Test in Europe accelerates MAT adoption | +1.8% | Europe, spillover to Middle East & Africa | Short term (≤ 2 years) |
| Expanding biologics, cell/gene therapy, and parenteral pipelines increase pyrogen testing volumes | +1.5% | Global, concentrated in North America, Europe, Asia-Pacific core | Medium term (2-4 years) |
| Ethical/3Rs mandates and corporate sustainability policies favor animal-free testing | +0.9% | Europe, North America, Australia | Medium term (2-4 years) |
| Rapid MAT formats reduce cycle time and QC bottlenecks | +1.2% | Global, early adoption in North America & Europe | Short term (≤ 2 years) |
| New EU Ph. Eur. 5.1.13 "Pyrogenicity" and NEP risk-assessment drive MAT where BET/rFC are insufficient | +1.0% | Europe, regulatory influence extending to MENA, Latin America | Medium term (2-4 years) |
| PBMC supply scaling and vendor partnerships improve lot-to-lot reproducibility and global availability | +0.7% | Global | Long term (≥ 4 years) |
| Source: Mordor Intelligence | |||
Regulatory Phase-Out of Rabbit Pyrogen Test in Europe Accelerates MAT Adoption
European Pharmacopoeia suppressed the rabbit pyrogen test from chapter 2.6.8 on 1 January 2026 and deleted it from 57 monographs by July 2025, eliminating the last regulatory fallback that delayed MAT investment. Manufacturers must now conduct non-endotoxin pyrogen risk assessments for every process change, effectively mandating MAT for complex biologics. Middle Eastern and African regulators, mirroring Ph. Eur. standards, are updating national guidelines, expanding the addressable demand. The majority of European parenteral products that were formerly tested on rabbits must convert to MAT by mid-2026, triggering a short-term surge that spills into Latin America and MENA over the medium term.
Expanding Biologics, Cell/Gene-Therapy Pipelines Increase Pyrogen Testing Volumes
Gene-therapy investment reached USD 15.2 billion in 2024, with more than half of new trials outside oncology, bringing lipid nanoparticles, viral capsids, and novel excipients that activate monocytes via TLR-independent pathways [2]“Riding the Gene-Therapy Rollercoaster into 2026,” Inside Precision Medicine, insideprecisionmedicine.com. FDA scrutiny of innate immune activation following AAV-related fatalities in 2025 has driven MAT adoption at the preclinical and Phase I stages. mRNA vaccines illustrate the need: their ionizable lipids induce TNF-α and IL-6 that ordinary endotoxin assays miss. Volumes therefore rise beyond batch release into development and validation workflows, particularly in North America and Europe, with Asia-Pacific adding capacity through 2030.
Ethical / 3Rs Mandates and Corporate Sustainability Policies Favor Animal-Free Testing
EU Directive 2010/63 and corporate ESG reporting intensify pressure to replace animal tests. Charles River positions MAT within its Alternative Methods Advancement Project, linking regulatory necessity with ethical imperatives. EDQM’s February 2026 symposium reaffirmed its commitment to alternatives, and major drugmakers now embed animal-free testing goals in ESG disclosures. These policies amplify regulatory and technical drivers, sustaining demand in regions with strong 3Rs enforcement.
Rapid MAT Formats Reduce Cycle Time and QC Bottlenecks
Traditional PBMC MAT takes up to two days. Lonza’s PyroCell MAT Rapid System and NOMO-1 NF-κB luciferase kits deliver results in three-to-five hours with sensitivity below 0.013 EU/mL. Digital PCR platforms quantify cytokine mRNA in four hours. Faster turnaround aligns with real-time release strategies for cell therapies and high-throughput vaccines. Early uptake is in the United States and Europe, with price premiums limiting penetration until 2028.
Restraints Impact Analysis*
| Restraint | (~) % Impact on CAGR Forecast | Geographic Relevance | Impact Timeline |
|---|---|---|---|
| Non-harmonized pharmacopeial acceptance and product-specific validations slow global rollout | -1.3% | Global, acute in Japan, Latin America, parts of Asia-Pacific | Medium term (2-4 years) |
| Donor/assay variability and inter-lab reproducibility challenges raise QA/validation burden | -0.8% | Global | Long term (≥ 4 years) |
| Limited NEP reference standards and control materials constrain robust PSV and comparability | -0.6% | Global | Long term (≥ 4 years) |
| Specialized equipment/readouts (ELISA/reporters) and trained staff needs elevate entry costs | -0.7% | Global, acute in emerging markets and small/mid-size companies | Medium term (2-4 years) |
| Source: Mordor Intelligence | |||
Non-Harmonized Pharmacopeial Acceptance and Product-Specific Validations Slow Global Rollout
USP lacks a dedicated MAT chapter, forcing sponsors to deliver full alternative-method validation under <1225> and product-specific verification, adding 6–12 months and up to USD 0.5 million per product. Japan and Pharmacopoeia Internationalis omit MAT entirely, compelling dual rabbit or endotoxin testing for those markets. Until ICH Q4B expands to MAT, multinational firms weigh the costs of duplication against scientific gains.
Donor/Assay Variability and Inter-Lab Reproducibility Challenges Raise QA Burden
Eleven percent of PBMC donors are low responders, and five-day refrigeration lowers reactivity threefold. Lot-to-lot revalidation increases costs, while inter-assay CVs up to 45% exceed typical endotoxin test variability. Cell-line platforms solve variability but face limited pharmacopeial guidance. This technical hurdle reduces adoption among smaller labs and cost-sensitive manufacturers.
*Our forecasts treat driver/restraint impacts as directional, not additive. The impact forecasts reflect baseline growth, mix effects, and variable interactions.
Segment Analysis
By Product & Service: Kits Anchor Revenue, Services Capture Validation Complexity
Kits and reagents led the monocyte activation test market, with a 56.18% share in 2025, and are growing at a 7.65% CAGR. Rapid ELISA and reporter-gene formats underpin demand. Instruments represent a smaller slice because one reader supports multiple assays, yet remain critical for cell-based workflows; vendors such as BMG LABTECH offer multimode readers with 37 °C incubation and 5% CO₂ control. Services expand as biotech firms outsource validation; Charles River provides turnkey testing, interference studies, and regulatory consulting, monetizing complexity.
Large biopharma internalizes MAT to cut unit costs, while small sponsors leverage CROs to avoid capital outlay. Service revenues are episodic, tied to product launches and validation cycles, whereas kit sales recur with every batch. Suppliers with integrated portfolios—cells, reagents, reference standards, and protocols—lower adoption barriers and defend margins. Demand for service bundles that include method development and submission support is increasing, creating a two-speed ecosystem within the monocyte activation test market.


By Source / Cell System: Cell Lines Gain on Reproducibility, PBMCs Retain Clinical Relevance
PBMC-based methods controlled 43.87% of the monocyte activation test market share in 2025, thanks to pharmacopeial precedent. Cell-line platforms are advancing at a 7.93% CAGR driven by reproducibility advantages. NOMO-1 or THP-1 NF-κB luciferase assays deliver detection limits below 0.013 EU/mL and remove donor-screening costs [3]NOMO-1 NF-κB Luciferase Reporter Assay Study, Nature, nature.com. Whole-blood formats remain niche for phage therapy and complex matrices because logistics limit scale.
Cell lines appeal to vaccine manufacturers and CDMOs handling high volumes, yet regulators require bridging studies to show parity with PBMC assays. MHRA’s 2025 phage-therapy guidance accepted MAT without prescribing cell source, indicating openness to validated alternatives. hiPSC-derived macrophages offer a promising future path for GMP production but await validation. The coexistence of PBMCs and cell lines ensures differentiated options across budgets and risk profiles in the monocyte activation test market.
By Detection: ELISA Dominates, Reporter Genes Disrupt
ELISA accounted for 58.39% of the monocyte activation test market in 2025; IL-6 remains the default cytokine for PBMC assays. Reporter-gene and qPCR platforms are scaling at 8.01% CAGR because they slash turnaround and expand dynamic range. NF-κB luciferase assays in cell lines produce results within 3 hours and detect endotoxin levels greater than 30-fold lower than ELISA, meeting real-time release needs. Flow cytometry provides mechanistic insight but lacks quantitative potency outputs required for compendial compliance.
Sponsors select a detection technique based on regulatory familiarity, speed, and sensitivity. Suppliers offering multimode kits enable users to switch formats as products progress from development to commercialization, creating cross-selling opportunities for reagents and instruments across the monocyte activation test market.
By Application: Batch Release Leads, Vaccines Accelerate on Inherent Pyrogenicity
Drug development and batch release contributed 44.88% of 2025 revenue. Vaccine development is the fastest-growing application, with a 7.67% CAGR, because lipid nanoparticle and adjuvanted vaccines inherently activate monocytes, making MAT essential under Ph. Eur. 2.6.40. Medical devices and raw-material testing are smaller yet rising as ISO 10993 updates highlight biological contaminants over material-mediated pyrogens.
Batch release volumes underpin baseline demand, with vaccine scale-ups adding incremental growth. Device and raw-material testing diversify end-user segments, broadening adoption across the monocyte activation test market.
By End User: Biotech Outsourcing Outpaces Pharma Internalization
Biotechnology companies are forecast to expand at a 7.76% CAGR through 2031, growing faster than the overall monocytic activation test market as they outsource validation to contract research organizations rather than absorbing the USD 200,000–500,000 up-front cost of instrumentation and method verification.
Pharmaceutical companies accounted for 39.87% of the 2025 monocyte activation test market share, a position anchored in high-volume injectable portfolios where in-house testing trims per-batch costs to USD 50–100 versus USD 300–500 for external services. Medical device manufacturers remain a smaller but rising cohort because ISO 10993-11 and ISO/TR 21582 now emphasize pyrogen screening of blood- or tissue-contact devices, compelling extraction protocols under ISO 10993-12 and interference studies to confirm that leachables do not suppress monocyte activation.
Geography Analysis
North America commanded 38.39% of revenue in 2025. FDA accepts MAT as an alternative method upon full validation, yet the absence of a compendial chapter raises costs. Lonza’s 18,000 sq ft Maryland expansion signals sustained regional demand. Concentrated gene-therapy pipelines and heightened scrutiny after 2025 safety events drive early-stage adoption. Canada and Mexico contribute modestly; Mexico’s biosimilar producers implement MAT to meet export standards.
Europe’s share benefits from legal certainty: the rabbit test was removed, and non-endotoxin pyrogen risk assessment is mandatory. Germany, the United Kingdom, and France are front-runners thanks to dense biopharma clusters and strong 3Rs culture. EDQM’s 2026 symposium provided implementation guidance, smoothing adoption. Southern European uptake lags, but spillover into MENA and Latin America via harmonized standards sustains growth.
Asia-Pacific is the fastest-growing region, with a 7.59% CAGR through 2031. China and India scale cell-therapy and biosimilar plants devoid of rabbit infrastructure, embracing MAT from the outset. Japan’s pharmacopoeia gap forces dual testing, muting growth. South Korea leverages its cell-therapy leadership, and Australia’s regulators prioritize in vitro methods. Southeast Asia and Taiwan represent emerging adopters as they align with export-market requirements. The Middle East & Africa and South America remain smaller but strategic. GCC health authorities and Brazil’s ANVISA align progressively with European standards, opening new markets for kits and validation services.

Competitive Landscape
The top five suppliers, Lonza, Merck KGaA, Charles River, Eurofins, and FUJIFILM Wako, account for the majority of combined revenue, leaving moderate room for specialists. Lonza and Merck leverage integrated portfolios spanning reagents, reference standards, and multimode instruments, reducing clients’ validation burden. Charles River and Eurofins package MAT within broader biologics testing suites, attracting sponsors migrating from rabbit tests.
Technology race centers on speed. Lonza’s 2023 PyroCell MAT Rapid System cut turnaround to overnight plus rapid ELISA, while cell-line NF-κB luciferase platforms deliver three-hour results with ultra-low detection limits. FUJIFILM highlighted MAT as a growth pillar in its 2025 life-sciences briefing. Emerging disruptors include hiPSC-derived macrophage suppliers and digital PCR developers targeting four-hour workflows.
CROs such as SGS, Nelson Labs, and WuXi AppTec capture high-margin validation consulting, essential where pharmacopeial disharmony persists. Niche cell-line innovators and reagent makers exploit gaps in donor variability and sensitivity. As Europe’s replacement cycle peaks by 2027, suppliers pivot to APAC and Latin America while bundling regulatory consultancy to defend share across the monocyte activation test market.
Monocyte Activation Test Industry Leaders
Lonza Group Ltd.
Merck KGaA
Charles River Laboratories International, Inc.
Eurofins Scientific SE
FUJIFILM Holdings Corporation
- *Disclaimer: Major Players sorted in no particular order

Recent Industry Developments
- February 2026: EDQM hosted a symposium on MAT implementation after rabbit-test suppression, providing validation and reproducibility guidance.
- November 2025: Burgmaier et al. validated MAT equivalence to rabbit tests in the International Journal of Molecular Sciences; FDA accepted the method in a BLA filing .
- February 2025: FUJIFILM’s Bio CDMO strategy spotlighted MAT kit launches aligned with Europe’s RPT phase-out.


Global Monocyte Activation Test Market Report Scope
As per the scope of the report, the monocyte activation test is a highly sensitive in vitro assay that utilizes human monocytes to detect a wide spectrum of pyrogens—fever-inducing substances in parenteral drugs, biologics, and medical devices. By simulating the initial stages of the human innate immune response, the MAT provides more accurate predictions of human responses than traditional animal-based methods, such as the Rabbit Pyrogen Test (RPT).
The monocyte activation test market is segmented by product and service, source, detection, application, end user, and geography. By product and services, the market is segmented into kits and reagents, instruments, and services. By source, the market is segmented into PBMC‑based, cell line–based, and whole blood–based. By detection, the market is segmented into ELISA‑based, Flow‑cytometry‑based, and qPCR/Reporter gene–based. By application, the market is segmented into drug development, vaccine development, inherently pyrogenic vaccines, medical devices, and raw materials. By end users, the market is segmented into pharmaceutical companies, biotechnology companies, medical device manufacturers, CROs/CMOs/CTOs, and academic & research institutes.
Geographically, the market is segmented into North America, Europe, Asia-Pacific, the Middle East & Africa, and South America. The market report also covers the estimated market sizes and trends for 17 countries across major regions globally. For each segment, the market size and forecast are provided in terms of value (USD).
| Kits and Reagents |
| Instruments |
| Services (CRO/CTO testing, validation, training) |
| PBMC‑based |
| Cell line–based (e.g., MM6, THP‑1, NOMO‑1) |
| Whole blood–based |
| ELISA‑based |
| Flow‑cytometry‑based |
| qPCR/Reporter gene–based (e.g., NF‑κB luciferase, dPCR) |
| Drug development / batch release |
| Vaccine development and inherently pyrogenic vaccines |
| Medical devices (material‑mediated pyrogens) |
| Raw materials / excipients / APIs |
| Pharmaceutical companies |
| Biotechnology companies |
| Medical device manufacturers |
| CROs/CMOs/CTOs |
| Academic & research institutes |
| North America | United States |
| Canada | |
| Mexico | |
| Europe | Germany |
| United Kingdom | |
| France | |
| Italy | |
| Spain | |
| Rest of Europe | |
| Asia-Pacific | China |
| India | |
| Japan | |
| South Korea | |
| Australia | |
| Rest of Asia-Pacific | |
| Middle East and Africa | GCC |
| South Africa | |
| Rest of Middle East and Africa | |
| South America | Brazil |
| Argentina | |
| Rest of South America |
| By Product & Service | Kits and Reagents | |
| Instruments | ||
| Services (CRO/CTO testing, validation, training) | ||
| By Source | PBMC‑based | |
| Cell line–based (e.g., MM6, THP‑1, NOMO‑1) | ||
| Whole blood–based | ||
| By Detection | ELISA‑based | |
| Flow‑cytometry‑based | ||
| qPCR/Reporter gene–based (e.g., NF‑κB luciferase, dPCR) | ||
| By Application | Drug development / batch release | |
| Vaccine development and inherently pyrogenic vaccines | ||
| Medical devices (material‑mediated pyrogens) | ||
| Raw materials / excipients / APIs | ||
| By End User | Pharmaceutical companies | |
| Biotechnology companies | ||
| Medical device manufacturers | ||
| CROs/CMOs/CTOs | ||
| Academic & research institutes | ||
| By Geography | North America | United States |
| Canada | ||
| Mexico | ||
| Europe | Germany | |
| United Kingdom | ||
| France | ||
| Italy | ||
| Spain | ||
| Rest of Europe | ||
| Asia-Pacific | China | |
| India | ||
| Japan | ||
| South Korea | ||
| Australia | ||
| Rest of Asia-Pacific | ||
| Middle East and Africa | GCC | |
| South Africa | ||
| Rest of Middle East and Africa | ||
| South America | Brazil | |
| Argentina | ||
| Rest of South America | ||


Key Questions Answered in the Report
How large is the monocyte activation test market expected to become by 2031?
It is forecast to reach USD 498.7 million, expanding at 7.33% CAGR from 2026 to 2031.
Why is Europe adopting MAT faster than other regions?
European Pharmacopoeia has eliminated the rabbit pyrogen test and requires non-endotoxin pyrogen risk assessments, making MAT the default assay.
Which product category leads revenue?
Kits and reagents hold 56.18% share in 2025 due to rapid ELISA and reporter-gene formats that cut turnaround times.
What restrains global MAT rollout?
Lack of harmonized pharmacopeial chapters outside Europe forces dual validation and raises costs, dampening uptake.
Page last updated on:


