Mobile Applications for Melanoma Detection Market Size and Share
Market Overview
| Study Period | 2020 - 2031 |
|---|---|
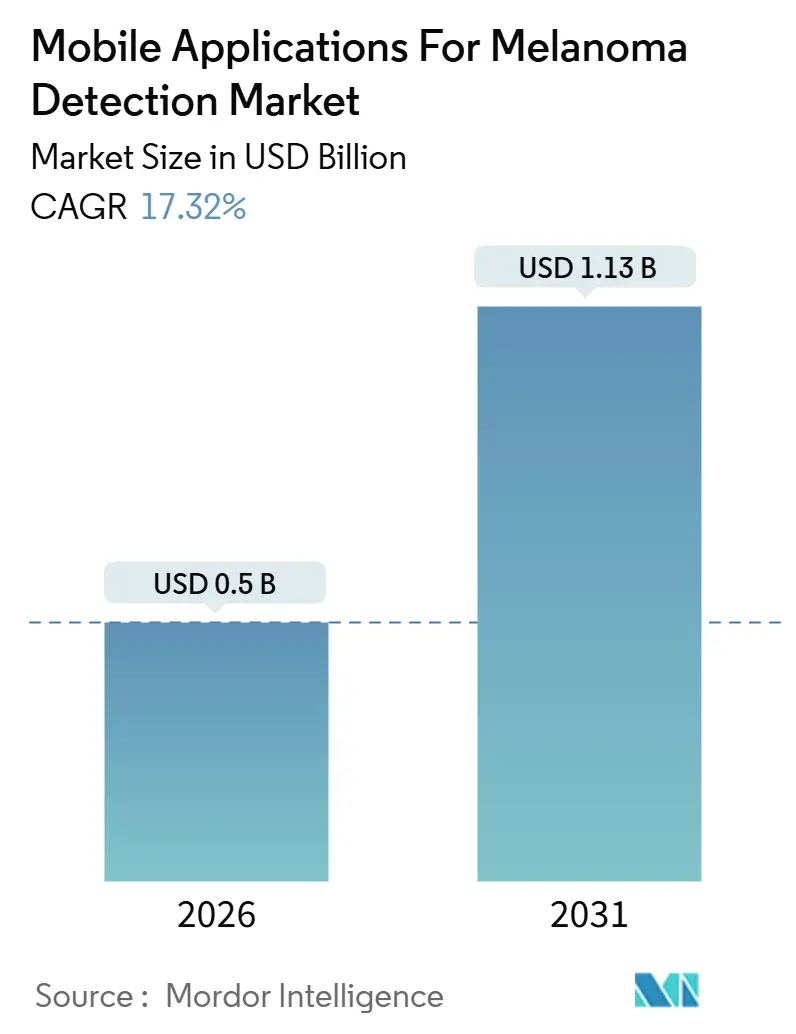
| Market Size (2026) | USD 0.5 Billion |
| Market Size (2031) | USD 1.13 Billion |
| Growth Rate (2026 - 2031) | 17.32% CAGR |
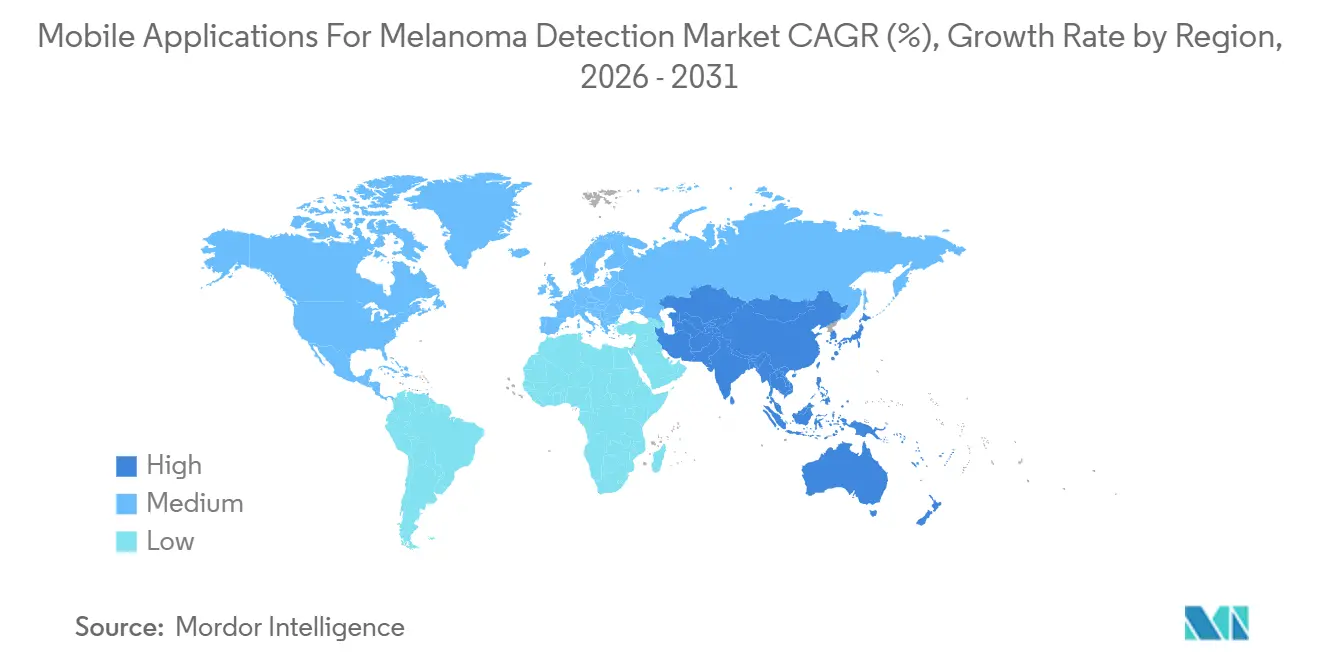
| Fastest Growing Market | Asia Pacific |
| Largest Market | North America |
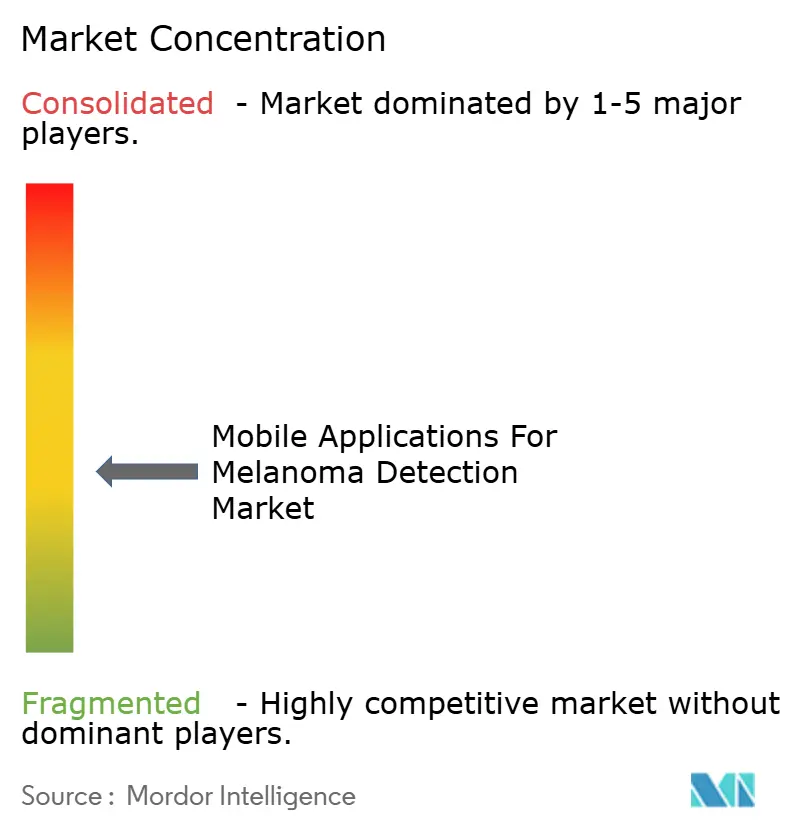
| Market Concentration | Medium |
Major Players *Disclaimer: Major Players sorted in no particular order Image © Mordor Intelligence. Reuse requires attribution under CC BY 4.0. | |
Mobile Applications for Melanoma Detection Market Analysis by Mordor Intelligence
The Mobile Applications For Melanoma Detection Market size is estimated at USD 0.5 billion in 2026, and is expected to reach USD 1.13 billion by 2031, at a CAGR of 17.32% during the forecast period (2026-2031).
Growing clinical confidence in artificial intelligence, continuous upgrades in smartphone camera optics, and permanent telehealth reimbursement codes are combining to push adoption into mainstream clinical workflows. Diagnostic apps still account for nearly half of revenue, yet research-grade endpoints are attracting the fastest capital inflows as pharmaceutical sponsors integrate lesion imaging into decentralized oncology trials. Employer wellness platforms and health plans view on-phone skin screening as a low-cost, high-frequency touchpoint that can cut late-stage treatment spend. At the same time, hardware innovators are pairing dermoscopy-quality optics with explainable AI to address accuracy gaps across diverse skin tones, signaling a pivot from pure software toward hybrid solutions that satisfy tougher regulatory expectations.
Key Report Takeaways
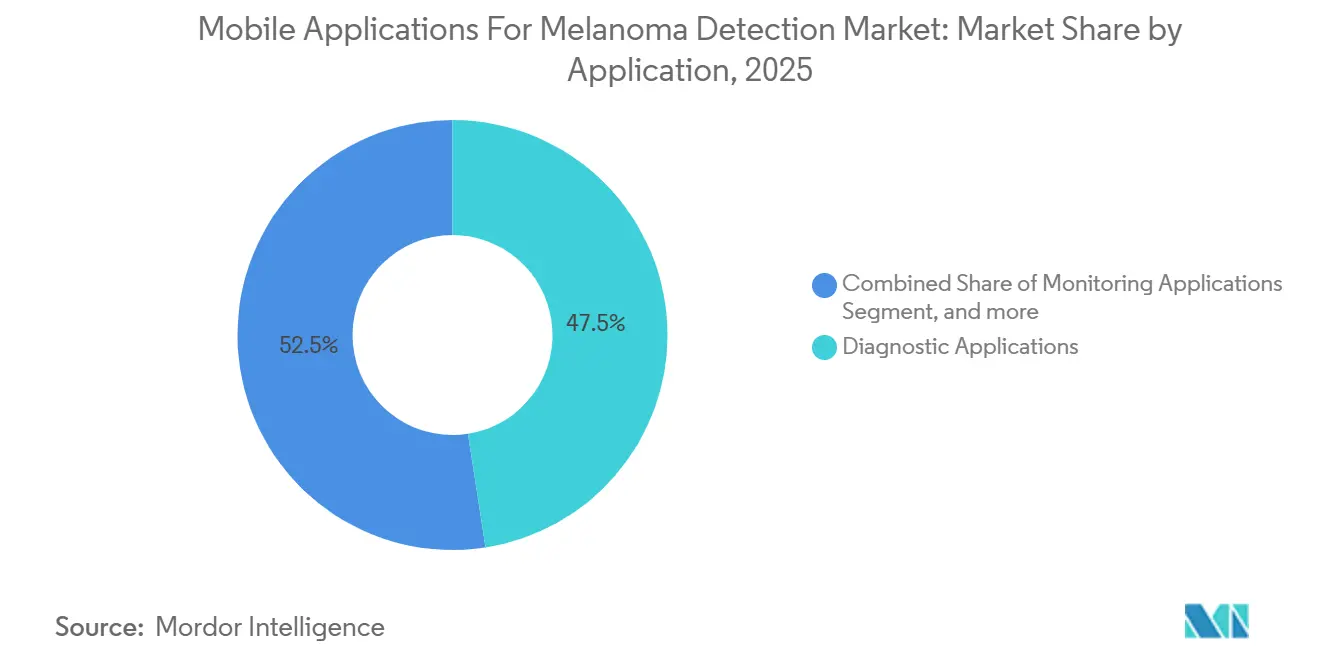
- By application, consumer-focused diagnostic software accounted for 47.54% of the melanoma detection market share in 2025; research endpoints are forecast to expand at a 19.54% CAGR through 2031.
- By end-user, patients and consumers accounted for 52.45% of the melanoma detection market for mobile applications in 2025, whereas pharmaceutical companies and CROs are projected to show the highest 20.45% CAGR to 2031.
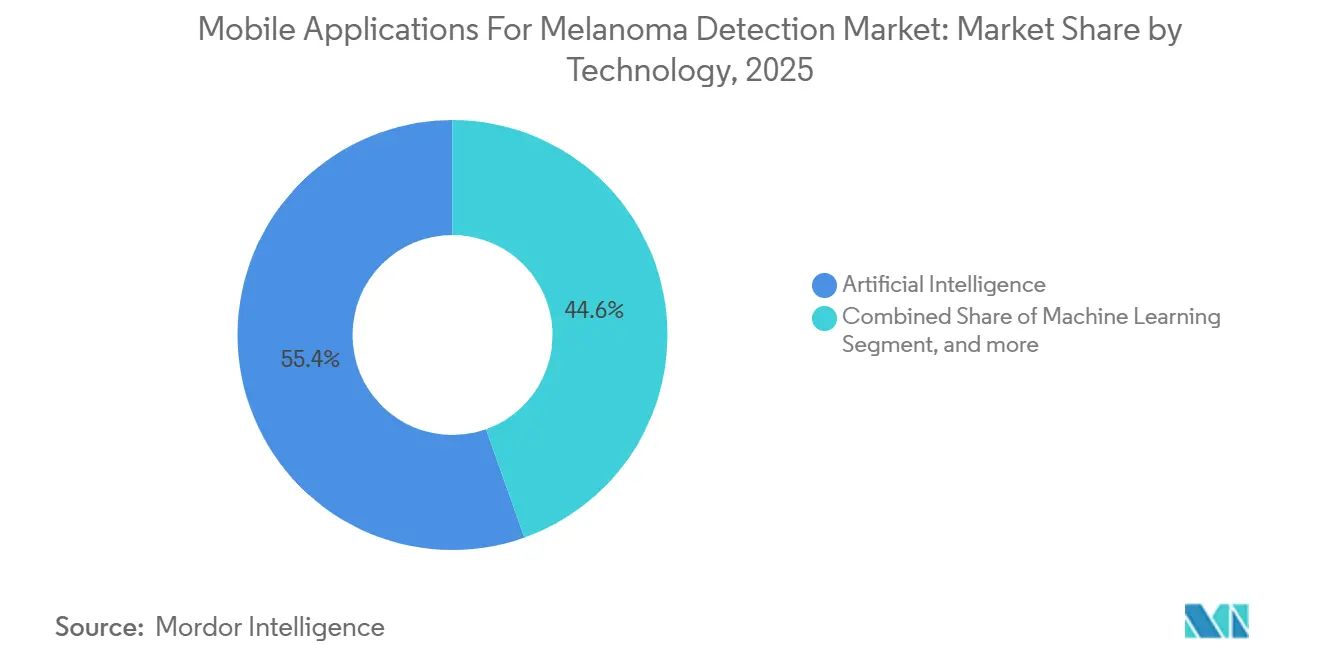
- By technology, artificial-intelligence platforms accounted for 55.43% of 2025 revenue, yet wearable-linked imaging is expected to grow at a 19.77% CAGR over 2026-2031.
- By commercial model, freemium offerings led with 47.65% revenue share in 2025; subscription plans are on track for a 19.21% CAGR through 2031.
- By geography, North America contributed 42.65% of 2025 revenue, while Asia-Pacific is set to post the fastest CAGR of 18.54% through 2031.
Note: Market size and forecast figures in this report are generated using Mordor Intelligence’s proprietary estimation framework, updated with the latest available data and insights as of January 2026.
Global Mobile Applications for Melanoma Detection Market Trends and Insights
Drivers Impact Analysis*
| Driver | (~) % Impact on CAGR Forecast | Geographic Relevance | Impact Timeline |
|---|---|---|---|
| Accelerating adoption of mobile health technologies | +3.2% | Global, with APAC core and spill-over to MEA | Medium term (2-4 years) |
| Escalating burden of skin cancer worldwide | +2.8% | Global, concentrated in Australia, North America, Europe | Long term (≥ 4 years) |
| Technological advancements in AI-driven dermatology diagnostics | +2.5% | North America & EU, expanding to APAC | Short term (≤ 2 years) |
| Ubiquitous availability of high-resolution smartphone cameras | +2.1% | Global | Short term (≤ 2 years) |
| Integration of melanoma apps into national telehealth reimbursement frameworks | +1.8% | North America, EU (select markets) | Medium term (2-4 years) |
| Expansion of employer-sponsored digital skin screening programs | +1.5% | North America, EU | Medium term (2-4 years) |
| Source: Mordor Intelligence | |||
Accelerating Adoption of Mobile Health Technologies
Mobile health ecosystems are displacing clinic-centric skin checks by allowing on-phone triage that fits rural and urban lifestyles alike. Asia-Pacific’s smartphone penetration surpassed 73% in 2024, and the regional mobile economy is projected to reach USD 1 trillion by 2030, providing melanoma apps with a ready hardware base. United States guidance released in 2024 recognized digital endpoints captured remotely, a change that cemented the role of validated imaging software in late-phase oncology studies. Hardware-software pairs such as FotoFinder’s skeen dermatoscope, which earned MDR clearance in 2025, illustrate how industrial design awards and regulatory nods can coexist to drive rapid provider uptake. Corporate wellness vendors now bundle annual skin checks alongside mental-health or metabolic screenings, creating sticky engagement loops and richer longitudinal datasets.
Escalating Burden of Skin Cancer Worldwide
Melanoma incidence continues to rise across aging populations with high ultraviolet exposure. The International Agency for Research on Cancer reported in 2024 that age-standardized rates are still rising fastest in Australia, Europe, and North America[1]International Agency for Research on Cancer, “GLOBOCAN 2024 Melanoma Factsheet,” iarc.fr. U.S. workforce forecasts published in 2024 highlight long-term dermatologist shortages in rural counties, pressing primary-care networks to adopt AI-assisted triage to avoid referral bottlenecks. Australia backed its own Centre of Excellence in Melanoma Imaging in 2025, confirming a state-level commitment to digital surveillance. Pharmaceutical firms cite these epidemiological pressures when allocating budget to mobile biomarkers that can enrich survival data without extra site visits. Together, disease prevalence and clinical capacity gaps reinforce the demand pull for validated phone-based screening.
Technological Advancements in AI-Driven Dermatology Diagnostics
Peer-reviewed trials have demonstrated dermatologist-level sensitivity when AI is embedded inside routine dermoscopy workflows. A 2024 multicenter study showed algorithmic support lifts diagnostic accuracy and reduces reading time. In 2025, explainable visual overlays further increased clinician trust according to additional research published in Nature Communications. Standardized evaluation arrived with the MIDAS dataset introduced by NEJM AI in 2025, streamlining cross-platform benchmarking. U.S. regulators granted DermaSensor clearance in January 2024 for its handheld optical-AI probe, cementing a milestone that reassures investors and providers. Yet studies on Fitzpatrick IV-VI skin underscore residual gaps, prompting guidance that now compels disclosure of training-set demographics within every submission.
Integration of Melanoma Apps into National Telehealth Reimbursement Frameworks
The Centers for Medicare & Medicaid Services made permanent codes for asynchronous dermatology review and remote patient monitoring within the CY 2025 and CY 2026 Physician Fee Schedules[2]Centers for Medicare & Medicaid Services, “CY 2026 Physician Fee Schedule Final Rule,” cms.gov. Providers can now bill for image-enabled consultations, turning a previously consumer-only workflow into a reimbursable service. In November 2025, CMS clarified modifiers and documentation rules, slashing administrative uncertainty. The United Kingdom’s NHS DigiTrials program backed the MyMelanoma study in 2024, demonstrating public-payer interest in mobile endpoints. Private insurers and self-insured employers have followed, embedding lesion checks into wellness stipends and paying ongoing per-member fees that underpin subscription momentum.
Restraints Impact Analysis*
| Restraint | (~) % Impact on CAGR Forecast | Geographic Relevance | Impact Timeline |
|---|---|---|---|
| Persistent clinical validation and accuracy challenges | -1.9% | Global | Short term (≤ 2 years) |
| Stringent data privacy and cybersecurity regulations | -1.6% | North America & EU, expanding globally | Medium term (2-4 years) |
| Complex and divergent global regulatory approval processes | -1.4% | Global, most acute in multi-market launches | Long term (≥ 4 years) |
| Algorithmic performance variability across diverse skin phototypes | -1.2% | Global, pronounced in APAC, Africa, Latin America | Medium term (2-4 years) |
| Source: Mordor Intelligence | |||
Persistent Clinical Validation and Accuracy Challenges
A Nature Medicine analysis published in 2024 concluded that regulatory authorization alone rarely ensures robust, prospective validation across real-world cohorts. NICE echoed this stance in its 2025 early value assessment that calls for subgroup efficacy reporting to spot hidden bias[3]National Institute for Health and Care Excellence, “Early Value Assessment AI Skin Lesion Triage,” nice.org.uk. Software recalls, including a 2025 bug in a continuous glucose monitoring app, highlight postmarket vigilance duties. U.S. guidance released in 2025 now mandates change-control plans that document how algorithms will evolve after launch. The lack of industry-wide imaging-quality benchmarks continues to hinder apples-to-apples procurement comparisons for health systems.
Stringent Data Privacy and Cybersecurity Regulations
The FTC’s revised Health Breach Notification Rule took effect in April 2024, extending breach reporting requirements to health apps that store identifiable images or biometric data. GDPR in Europe and HIPAA in the United States impose encryption, consent, and data minimization, making compliance a heavier lift for small developers. Apps often embed third-party analytics SDKs that create unseen data-sharing paths, raising enforcement risk. Cross-border data transfer limits in India, China, and Brazil require region-locked servers, increasing DevOps complexity. Securing cloud inference, edge storage, and clinician dashboards against ransomware increases the total cost of ownership.
*Our forecasts treat driver/restraint impacts as directional, not additive. The impact forecasts reflect baseline growth, mix effects, and variable interactions.
Segment Analysis
By Application: Research Endpoints Outpace Consumer Diagnostics
Research apps represented a smaller base in 2025 but are predicted to compound at 19.54% CAGR through 2031, fueled by decentralized immunotherapy studies that prefer remotely captured lesion images as digital biomarkers. Diagnostic software maintained 47.54% of the melanoma detection market share in 2025 and will remain the revenue anchor, though its growth is slower due to tougher validation requirements. Monitoring tools for high-risk patients occupy a modest revenue niche that is expanding as dermatology offices combine initial in-person mapping with remote follow-ups to conserve capacity. Educational downloads generate reach but minimal direct income; they instead funnel users toward paid modules.
The stricter October 2025 AI-medical-device guidance raises evidence thresholds, easing barriers to consumer-only apps while favoring platforms embedded in regulated clinical trials. Sponsors fund multi-arm imaging sub-studies, offsetting developer costs and accelerating regulatory filings. Publication of the MIDAS dataset provides research teams with a shared yardstick, thereby shortening review cycles. Patients wanting paid diagnostic certainty gravitate toward apps with visible FDA or CE marks, aligning commercial success with clinical rigor.


By End-User: Pharma and CROs Redefine App Validation
Patients and consumers accounted for 52.45% of 2025 revenue, driven by freemium convenience, yet the highest expected 20.45% CAGR belongs to pharmaceutical companies and contract research organizations that now budget for phone-based lesion capture in protocol design. Healthcare providers—including dermatologists and primary-care physicians—deliver stable uptake but must reconcile EHR integration and malpractice coverage before mass rollout. Academic researchers leverage institutional licenses to gather reference data, but it remains a smaller revenue line.
Medicare’s November 2025 billing guidance expands provider reimbursement, fostering clinical uptake, yet pharma sponsors advance faster because imaging endpoints can cut site visits and extend trial reach into underserved zip codes. Employer wellness portals create a hybrid category that combines consumer-driven onboarding with institutional oversight. Academic-pharma consortia supply external validation that regulators want, completing a virtuous circle between evidence generation and market growth.
By Technology: Wearable-Linked Imaging Challenges AI Dominance
Artificial intelligence platforms owned 55.43% of 2025 sales, underpinned by machine-learning image recognition that triages lesions in seconds. Even so, wearable-linked imaging is forecast to achieve the highest CAGR of 19.77% because clinicians crave optics that replicate dermoscopy quality. Devices like FotoFinder’s handyscope combine magnetic alignment, polarized light, and real-time AI analysis into a single workflow, improving diagnostic accuracy across variable lighting conditions. Telemedicine services mature more slowly, as reimbursement and workflow standards favor asynchronous store-and-forward reviews integrated with AI scoring.
Regulatory guidance treats hybrid hardware-software kits similarly to purely digital products, but historical familiarity with medical devices eases reviewer acceptance. AI engines are layering explainability features, heat-map overlays, and continual-learning plans to meet new post-market surveillance requirements. Synthetic training data and federated learning aim to shrink performance gaps across skin tones, underscoring hardware-software synergy as the likely winning formula.
By Commercial Model: Subscription Stickiness Erodes Freemium Share
Freemium adoption accounted for nearly half of 2025 revenue through viral downloads, yet subscription plans are on track for a 19.21% CAGR thanks to recurring employer and insurer payments. Pay-per-scan pricing fits urgent-care or pharmacy kiosks but scales modestly. License agreements with large health systems guarantee minimum seats, providing predictable cash but demanding heavy compliance support.
As wellness vendors consolidate benefits into single sign-ons, bundled pricing for mental-health, metabolic, and dermatology modules drives subscription stickiness. Freemium apps must upgrade clinical proof and customer support to convert more users to paid tiers, but rising validation costs compress margins. Regulatory guidance that tightens post-market monitoring raises ongoing overhead, reinforcing the appeal of predictable subscription cash flows.
Geography Analysis
North America contributed 42.65% of 2025 revenue, anchored by FDA 510(k) clearances and permanent Medicare telehealth codes that allow phone-captured images to be billed as billable events. Employer wellness adoption is advanced, and venture capital remains readily available, yet algorithmic bias scrutiny slows blanket rollout in communities with higher proportions of Fitzpatrick IV-VI skin types. Dermatologist shortages documented by HRSA heighten interest in scalable triage, particularly in rural counties.
Asia-Pacific is the fastest-growing region at 18.54% CAGR for 2026-2031, propelled by mobile-first care models and rising skin cancer awareness. Australia’s state-backed imaging center reinforces national leadership, while India-based startups capitalize on vernacular interfaces and local training data to sidestep Western bias. Divergent regulatory timelines and limited payer infrastructure outside Australia and Japan temper expansion, but do not erase the sheer volume opportunity.
Europe shows steady uptake under stricter Medical Device Regulation rules. German-engineered devices that merge optics and AI secure MDR badges, positioning them as premium choices for privacy-conscious customers. NHS DigiTrials’ endorsement of MyMelanoma signals public-payer readiness, yet GDPR compliance adds cost layers that slow consumer rollouts. Emerging regions in the Middle East, Africa, and South America have low base revenue but attractive growth rates as smartphone adoption widens and public health agencies launch UV-exposure campaigns.

Competitive Landscape
More than 20 recognized suppliers contest the mobile applications for melanoma detection market, spanning clinical-grade firms such as DermaSensor and MetaOptima to mass-market apps like SkinVision and Miiskin. Vertical integration is evident as FotoFinder bundles dermatoscopes with its proprietary AI, securing both device margins and software annuities. Indian challengers CureSkin and Coralai differentiate by training on darker skin tones and by offering support in regional languages, gaining traction in Asia-Pacific.
Strategic moves center on explainable AI, federated learning for data privacy, and EHR connectors that cut manual upload steps for clinicians. Pharma-CRO alliances shift cash flows toward B2B contracts that underwrite validation trials, lowering start-up risk for developers. Guidance finalized by the FDA in October 2025 raises documentation burdens, favoring incumbents with compliance teams and prompting smaller apps to seek merger or licensing exits. Benchmark datasets such as MIDAS encourage transparency, sharpening performance comparisons, and accelerating natural consolidation.
Mobile Applications for Melanoma Detection Industry Leaders
SkinVision
Skin Analytics
MetaOptima (MoleScope)
FotoFinder
Miiskin
- *Disclaimer: Major Players sorted in no particular order

Recent Industry Developments
- December 2025: Medical Care Technologies Inc. launched a AI wound and skin monitoring platform. The Company has strategically aligned with Derm Foundation, a Google-backed pretrained dermatology imaging model, enabling the app to rapidly evolve into one of the most accessible early-warning tools for melanoma, infection risks, and chronic wound deterioration directly from a smartphone.
- January 2024: DermaSensor received FDA 510(k) clearance for its handheld optical-AI probe that screens for melanoma, basal cell carcinoma, and squamous cell carcinoma, opening U.S. clinical channels


Global Mobile Applications for Melanoma Detection Market Report Scope
As per the scope of the report, mobile applications for melanoma detection are software tools designed to analyze skin lesions using smartphone cameras. They assist users in identifying potential melanoma signs through image analysis and algorithms. These apps aim to improve early detection and encourage timely medical consultation.
The Mobile Applications for Melanoma Detection Market Report is Segmented by Application (Diagnostic, Monitoring, Educational, Research, and Other Applications), End-User (Healthcare Providers, Patients/Consumers, Researchers/Academics, Pharmaceutical Companies/CROs, and Other End-Users), Technology (AI, ML, Image Recognition, Wearable-Linked Imaging, and Telemedicine), Commercial Model (Freemium, Subscription, and Pay-Per-Scan/License), and Geography (North America, Europe, Asia-Pacific, MEA, and South America). The market report also covers the estimated market sizes and trends for 17 countries across major regions globally. The report offers the value (in USD million) for the above segments.
| Diagnostic Applications |
| Monitoring Applications |
| Educational Applications |
| Research Applications |
| Other Applictions |
| Healthcare Providers |
| Patients / Consumers |
| Researchers & Academics |
| Pharmaceutical Companies & CROs |
| Other End-Users |
| Artificial Intelligence |
| Machine Learning |
| Image Recognition |
| Wearable-Linked Imaging |
| Telemedicine Solutions |
| Freemium |
| Subscription |
| Pay-Per-Scan / License |
| North America | United States |
| Canada | |
| Mexico | |
| Europe | Germany |
| United Kingdom | |
| France | |
| Italy | |
| Spain | |
| Rest Of Europe | |
| Asia-Pacific | China |
| Japan | |
| India | |
| Australia | |
| South Korea | |
| Rest Of Asia-Pacific | |
| Middle East & Africa | GCC |
| South Africa | |
| Rest Of Middle East & Africa | |
| South America | Brazil |
| Argentina | |
| Rest Of South America |
| By Application | Diagnostic Applications | |
| Monitoring Applications | ||
| Educational Applications | ||
| Research Applications | ||
| Other Applictions | ||
| By End-User | Healthcare Providers | |
| Patients / Consumers | ||
| Researchers & Academics | ||
| Pharmaceutical Companies & CROs | ||
| Other End-Users | ||
| By Technology | Artificial Intelligence | |
| Machine Learning | ||
| Image Recognition | ||
| Wearable-Linked Imaging | ||
| Telemedicine Solutions | ||
| By Commercial Model | Freemium | |
| Subscription | ||
| Pay-Per-Scan / License | ||
| Geography | North America | United States |
| Canada | ||
| Mexico | ||
| Europe | Germany | |
| United Kingdom | ||
| France | ||
| Italy | ||
| Spain | ||
| Rest Of Europe | ||
| Asia-Pacific | China | |
| Japan | ||
| India | ||
| Australia | ||
| South Korea | ||
| Rest Of Asia-Pacific | ||
| Middle East & Africa | GCC | |
| South Africa | ||
| Rest Of Middle East & Africa | ||
| South America | Brazil | |
| Argentina | ||
| Rest Of South America | ||


Key Questions Answered in the Report
How large is the Mobile Applications for Melanoma Detection Market in 2026?
The Mobile Applications for Melanoma Detection Market size stands at USD 0.50 billion in 2026.
What is the expected CAGR for mobile melanoma apps through 2031?
The market is forecast to grow at a 17.32% CAGR between 2026 and 2031.
Which application segment is expanding fastest?
Research endpoints, used in decentralized clinical trials, are projected to post a 19.54% CAGR through 2031.
Why is Asia-Pacific viewed as the most attractive growth geography?
High smartphone adoption and mobile-first health infrastructure are set to drive an 18.54% CAGR for the region from 2026 to 2031.
How are subscriptions overtaking freemium models?
Employers and insurers buy recurring access, pushing subscription revenue to a 19.21% CAGR, while freemium margins tighten under stricter validation rules.
What regulatory change most affects new entrants?
FDA guidance finalized in October 2025 on AI-enabled software as a medical device raises validation and post-market surveillance requirements, elevating market entry costs.
Page last updated on:


