Middle East and Africa Global Capability Centers Market Size and Share
Market Overview
| Study Period | 2020 - 2031 |
|---|---|
| Forecast Data Period | 2026 - 2031 |
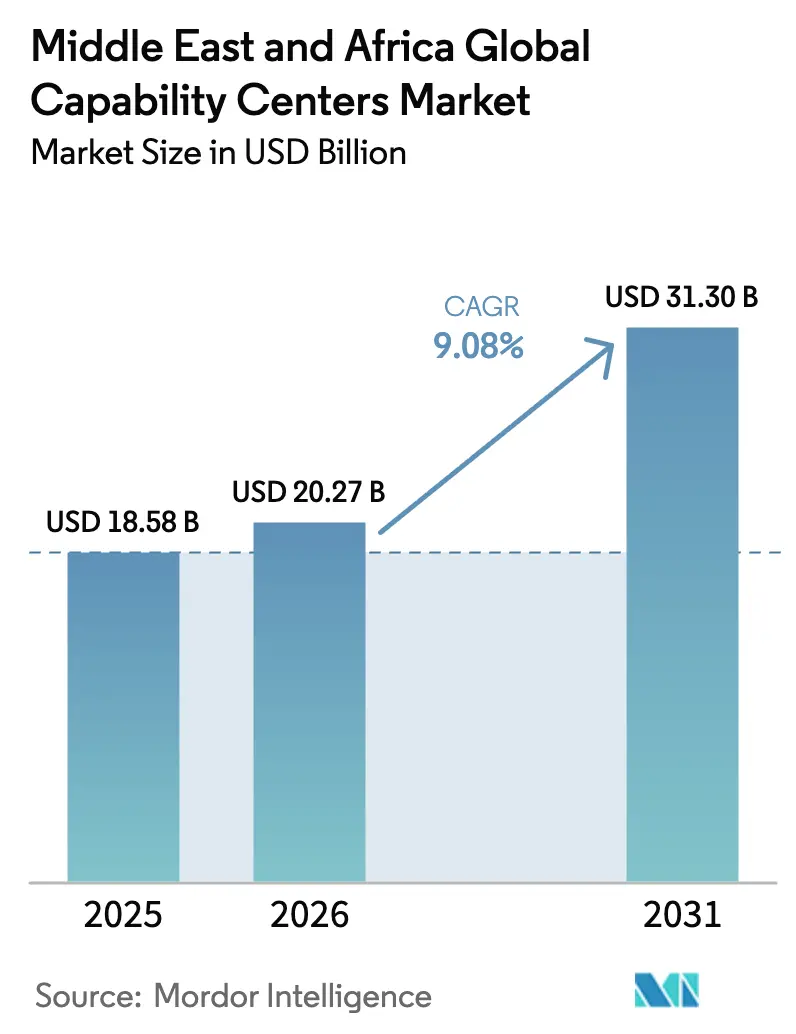
| Base Year Market Size (2025) | USD 18.58 Billion |
| Market Size (2026) | USD 20.27 Billion |
| Market Size (2031) | USD 31.3 Billion |
| Growth Rate (2026 - 2031) | 9.08% CAGR |
| Market Concentration | Medium |
Major Players *Disclaimer: Major Players sorted in no particular order Image © Mordor Intelligence. Reuse requires attribution under CC BY 4.0. | |
Middle East and Africa Global Capability Centers Market Analysis by Mordor Intelligence
The Middle East and Africa global capability centers market size is expected to grow from USD 18.58 billion in 2025 to USD 20.27 billion in 2026 and is forecast to reach USD 31.3 billion by 2031 at 9.08% CAGR over 2026-2031. Private and sovereign investors are channeling fresh capital into digital infrastructure, artificial intelligence clusters, and green data centers, creating a supportive foundation for large-scale capability hubs. Multinational corporations are relocating high-value engineering and knowledge-intensive processes to the region to serve Europe, Asia, and Africa from a single time zone, while local regulators are courting investors with 30-year tax holidays and fast-track licensing. Mature free zones in the United Arab Emirates and new sandbox regimes in Saudi Arabia and Egypt shorten set-up timelines, pushing the Middle East and Africa global capability centers market toward double-digit growth. At the same time, Saudi Arabia’s USD 10 billion pipeline of hyperscale data facilities, paired with expanded submarine cable landings in Egypt, keeps latency low for cloud workloads, which further reduces the total cost of ownership for global data centers.
Key Report Takeaways
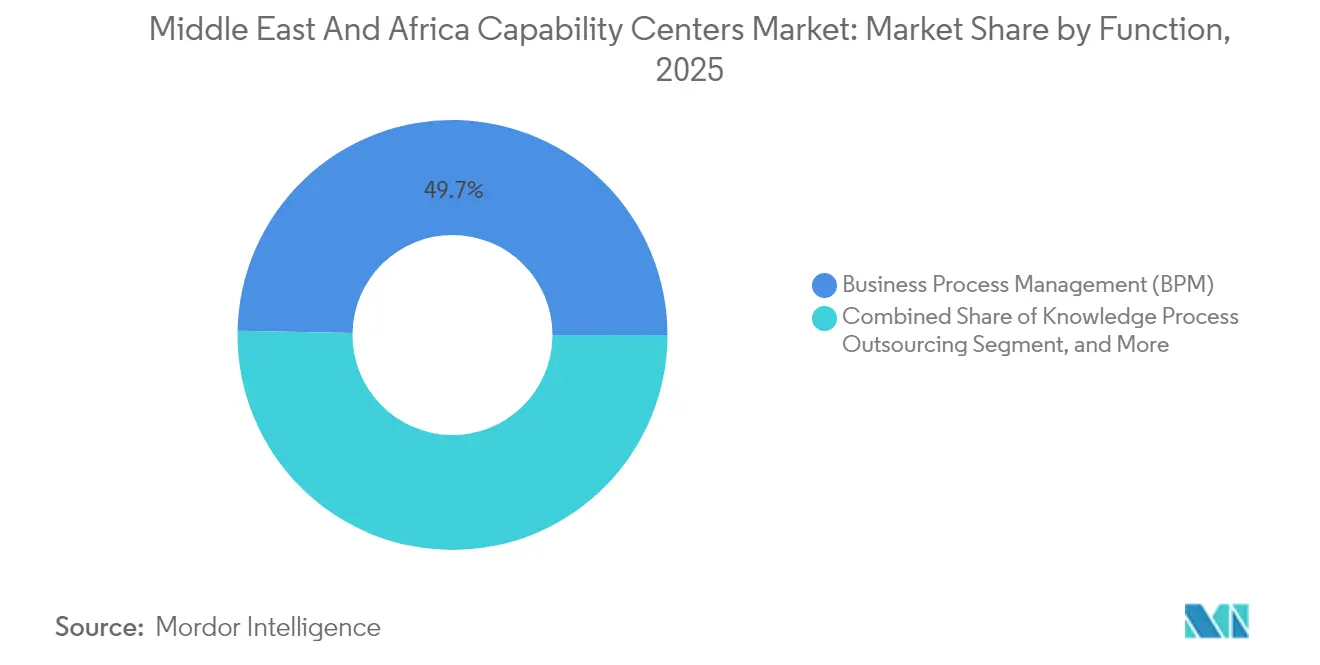
- By function, Business Process Management led with a 49.68% share of the Middle East and Africa global capability centers market size in 2025; Information Technology and Digital Services is advancing at a 9.72% CAGR through 2031.
- By engagement model, captive centers accounted for 58.35% of the Middle East and Africa global capability centers market share in 2025; hybrid Build-Operate-Transfer models are projected to expand at a 10.05% CAGR to 2031.
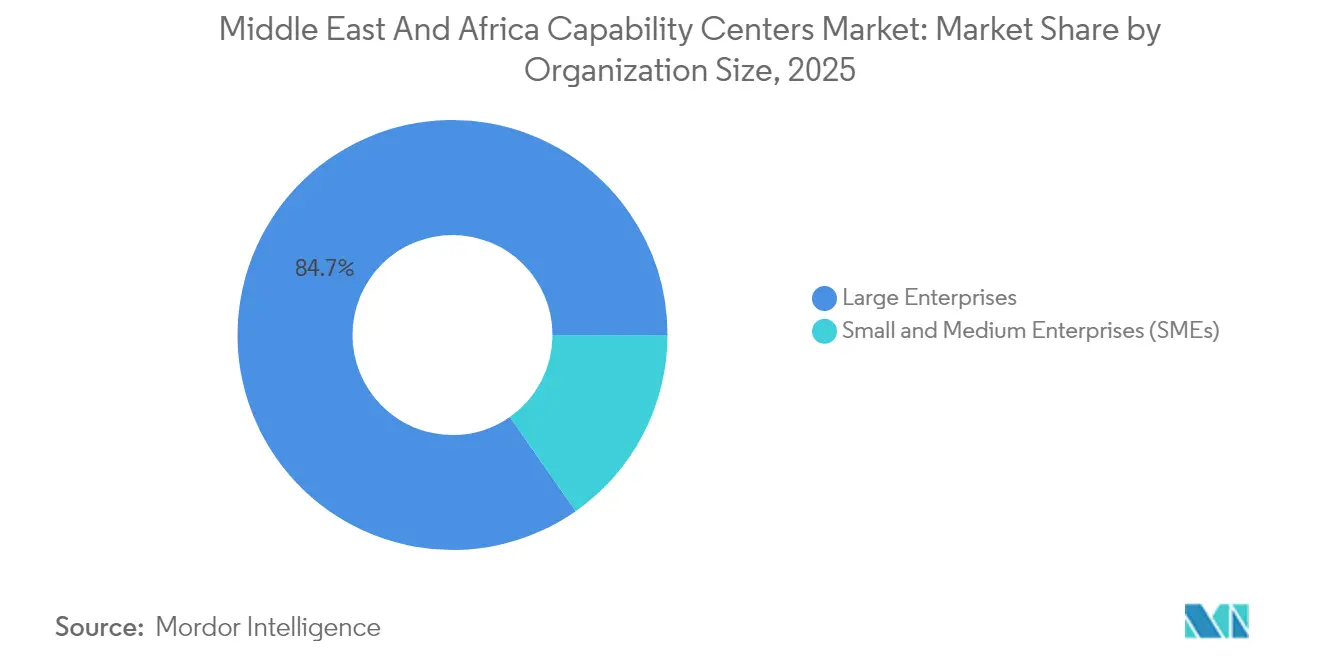
- By organization size, large enterprises accounted for 84.72% of 2025 revenue, whereas small and medium enterprises are growing the fastest at a 11.18% CAGR.
- By industry vertical, telecommunications and IT accounted for a 33.05% revenue share in 2025; the manufacturing and automotive sectors are forecast to grow at a 10.01% CAGR through 2031.
- By country, the United Arab Emirates held 27.62% revenue share in 2025; Saudi Arabia is forecast to grow at a 10.18% CAGR through 2031.
Note: Market size and forecast figures in this report are generated using Mordor Intelligence’s proprietary estimation framework, updated with the latest available data and insights as of 2026.
Middle East and Africa Global Capability Centers Market Trends and Insights
Drivers Impact Analysis*
| Driver | (~) % Impact on CAGR Forecast | Geographic Relevance | Impact Timeline |
|---|---|---|---|
| Digital-first national visions and sovereign investment push | +2.1% | UAE, Saudi Arabia, Qatar, with spillover to Egypt | Medium term (2-4 years) |
| Regional talent-pool expansion via STEM and visa reforms | +1.8% | Global, with early gains in the UAE, Saudi Arabia, and South Africa | Long term (≥ 4 years) |
| Rising demand for near-shore, multi-lingual CX and tech support | +1.4% | MENA core, expanding to North Africa | Short term (≤ 2 years) |
| M&A and BOT accelerators offered by free-zone regulators | +1.2% | UAE free zones, Saudi NEOM, Qatar Financial Center | Medium term (2-4 years) |
| AI-native greenfield Global Capability Center designs lower time-to-value | +1.7% | Saudi Arabia, UAE, with expansion to Egypt | Medium term (2-4 years) |
| Africa's impact-sourcing incentives unlocking cost agility | +1.4% | South Africa, Egypt, and Kenya, with regional expansion | Long term (≥ 4 years) |
| Source: Mordor Intelligence | |||
Digital-First National Visions Drive Sovereign Investment Push
Regional governments designed national agendas that place digital infrastructure at the heart of economic diversification. Saudi Arabia alone attracted USD 10 billion in data-center commitments in 2024, including an AWS program that will add three availability zones by 2026, and Oracle’s second public cloud region, which went live in Riyadh late in 2024. The United Arab Emirates followed suit under its "We the UAE 2031" agenda, backing a Microsoft AI cloud cluster in Abu Dhabi and an OpenAI-linked 5-gigawatt AI complex. Egypt’s National AI Strategy 2025-2030 sets a USD 42.7 billion contribution target to the national GDP and launched a government cloud facility in January 2025. Collectively, these initiatives supply the fiber, power, and policy underpinnings that global corporations require before green-lighting capability centers.[1]Oracle Press Release, “Oracle Opens Second Cloud Region in Riyadh,” oracle.com
Regional Talent-Pool Expansion Through STEM and Visa Reforms
Talent scarcity has historically restricted scaling; however, joint efforts by education ministries, free-zone authorities, and private firms are reversing this pattern. Saudi Arabia’s Mostaqbali program collaborates with hyperscalers to train 50,000 nationals in AI workflows, while Ethiopia aims to train 5 million coders by 2030. Parallel visa reforms enable remote technologists to reside in the UAE without company sponsorship and grant Saudi Arabia long-term residency to in-demand specialists, thereby widening the accessible labor pool. Egypt now fields 175,000 ICT professionals and leverages its trilingual workforce to service Europe, Africa, and the Middle East from a single delivery hub.[2]Personal Data Protection Authority Saudi Arabia, “PDPL Executive Regulations,” pdp.gov.sa
Rising Demand for Near-Shore, Multilingual Customer Experience Services
European and North American firms are increasingly seeking business continuity sites outside congested Asian corridors. Near-shore hubs in Cairo, Casablanca, and Cape Town combine Arabic, English, French, and local languages, enabling omnichannel support across more than 20 markets while reducing operating costs by up to 80%. Egypt increased digital services exports to USD 6.2 billion in FY 2022-23 and set a USD 9 billion goal for 2026, aided by a new renewable-powered data center program on the Suez axis.[3]Ministry of Communications and Information Technology Egypt, “Egypt Cloud Computing Center Launch,” mcit.gov.eg
AI-Native Greenfield Global Capability Center Designs Lowering Time-to-Value
Emerging projects embed automation from the outset, reducing the conventional 18-month ramp-up to approximately nine months. NEOM’s cognitive city blueprint integrates process-automation suites that tenants can license on arrival, cutting configuration cycles and capex. Microsoft’s USD 2.1 billion Saudi cloud stack supplies managed AI pipelines to accelerate the deployment of predictive models in banking and healthcare use cases. Early adopters report productivity increases of over 30% within the first year of operation, which draws additional firms into the model.[4]Jared Spataro, “How AI Integration in Global Capability Centers Delivers Over 30 Percent Productivity Gains,” Microsoft 365 Blog, microsoft.com
Restraints Impact Analysis*
| Restraint | (~) % Impact on CAGR Forecast | Geographic Relevance | Impact Timeline |
|---|---|---|---|
| Fragmented data-protection regimes and cross-border data friction | -1.3% | Regional, with acute challenges in cross-border operations | Short term (≤ 2 years) |
| Scarcity of senior digital leadership and high churn costs | -1.8% | UAE, Saudi Arabia core markets with talent competition | Medium term (2-4 years) |
| Escalating geopolitical and supply-chain security risks | -1.1% | Regional, with Red Sea corridor impacts | Short term (≤ 2 years) |
| Limited grade-A office stock outside core hubs is inflating rents | -0.7% | Dubai, Riyadh are prime locations with spillover effects | Medium term (2-4 years) |
| Source: Mordor Intelligence | |||
Fragmented Data-Protection Regimes Create Cross-Border Operational Complexity
Capability centers that straddle jurisdictions must juggle overlapping data-sovereignty statutes. Saudi Arabia enforces local-hosting rules for sensitive financial records, while the UAE now mandates breach-notification windows as short as 72 hours. South Africa’s POPIA differs in consent requirements, forcing multinational centers to apply granular policy engines or duplicate storage, which raises compliance expenditure and erodes scale efficiencies.
Scarcity of Senior Digital Leadership Drives Talent Competition Intensity
Rapid output growth drives demand for experienced site leaders who combine in-depth domain knowledge with cultural fluency and regulatory expertise. Free-zone authorities require select functions, such as compliance and cybersecurity, to be overseen locally, intensifying competition for a thin executive pool. Average churn costs surpass 150% of annual pay when relocation, family allowances, and knowledge-transfer lags are factored in, translating into notable margin pressure for early-stage Global Capability Centers.
*Our forecasts treat driver/restraint impacts as directional, not additive. The impact forecasts reflect baseline growth, mix effects, and variable interactions.
Segment Analysis
By Function: Business Process Management Maintains Lead While Digital Services Surge
The segment accounted for 49.68% of the Middle East and Africa global capability centers market in 2025, as shared-service finance, collections, and contact-center workstreams grew in parallel with the expansion of telecom and banking footprints. The market share reflects a base of mature centers that first established a routine back-office scope and later layered advanced analytics. Information Technology and Digital Services is closing the gap quickly, supported by hyperscale cloud regions that lower latency for development, testing, and AI-inference workloads. The Middle East and Africa global capability centers market size for IT and Digital Services is forecast to post a 9.72% CAGR to 2031, underpinned by the rollouts of AWS, Oracle, and Microsoft.
Customers increasingly request integrated pods that bundle DevOps, cybersecurity, and low-code platform management with contact center oversight, blurring traditional functional lines. Saudi Arabia’s USD 5.3 billion AWS build and Egypt’s target to incubate 250 AI-driven startups by 2030 strengthen the region’s software talent credentials. Parallel growth in automotive engineering and renewable-energy analytics spurs deeper R&D mandates, gradually redirecting work from India and Eastern Europe to Middle Eastern hubs.


By Engagement Model: Hybrid BOT Frameworks Accelerate Adoption
Captive structures accounted for 58.35% of 2025 revenue, as multinationals sought to control codebases and personally identifiable information. Yet risk-averse firms combine internal oversight with external operating partners through Build-Operate-Transfer variants, which are expanding at a 10.05% CAGR. The Middle East and Africa global capability centers market size for hybrid BOT agreements remains modest, but it attracts first-time entrants who aim to flip ownership after proving value. Regulators within Dubai Internet City and Riyadh’s King Salman Energy Park now pre-approve template contracts, which reduce the average BOT negotiation cycle from nine months to three.
Transformational BOT models introduce vendor-led automation and culture change before equity hand-off, solving scale hurdles that previously discouraged 71% of surveyed firms from BOT. Virtual-captive approaches, popular in the UAE, enable founders to leverage pre-registered entities and shared functions, treating occupancy costs as operating expenses rather than capital expenditures. Logically, smaller-ticket projects, especially for cloud-native fintechs, typically commence within a virtual captive wrapper and upgrade to full captives once revenues exceed USD 200 million.
By Organization Size: SME Demand Outpaces Large-Enterprise Growth
Large corporations dominated the market, accounting for 84.72% of the revenue in 2025, thanks to mega-programs spanning finance, procurement, and DEVSECOPS. Nonetheless, the Middle East and Africa global capability centers market records an 11.18% CAGR in the SME cohort, the fastest among all size tiers. Cloud-native architecture enables a 100-seat digital commerce specialist in Cairo or Nairobi to integrate with managed Kubernetes, SOC-as-a-service, and financial shared ledger platforms through monthly subscriptions. Government interventions add momentum; Egypt’s MSME Law 152/2020 reroutes subsidized loans toward tech adoption, while Saudi Arabia’s Monsha’at agency expands low-cost cloud credits.
By utilizing pay-as-you-go seats, early-stage e-commerce firms can absorb seasonal demand spikes during Ramadan and Singles' Day without incurring the capital-intensive costs of real estate leases. Service providers respond with modular real estate pods, quick-deploy HR policies, and turnkey ERP stacks. This commercial model enables SMEs to attract brand-name clients in Western Europe seeking 24/7 multilingual support, bringing new revenue into the supplier base and diversifying the employer landscape beyond marquee corporations.
By Industry Vertical: Manufacturing and Automotive Disrupt Telecom Supremacy
Telecommunications and IT maintained a 33.05% lead in 2025, driven by the rollout of fifth-generation mobile networks and the aggressive adoption of cloud-native OSS and BSS. However, the Middle East and Africa global capability centers market size for manufacturing and automotive is projected to grow at a 10.01% CAGR as Saudi Arabia seeds a localized EV cluster targeting 500,000 units per year by 2030. Battery-materials labs, embedded-software pods, and digital-twins engineering scrums co-locate near production lines, shortening iteration cycles.
BFSI continues to adopt AI-driven anti-money laundering monitoring from Cairo and robo-advisory model calibration in Johannesburg. Healthcare leverages telehealth-platform support centers in Dubai Healthcare City, while retail marries Cairo-based customer-experience agents with Riyadh social-commerce analytics pods. Renewable-energy developers commission ESG-reporting hubs in Abu Dhabi to align with the EU taxonomy, opening a new services sub-segment in sustainability analytics.
Geography Analysis
The Middle East and Africa global capability centers market posts 27.62% share in the United Arab Emirates, owing to decades-old free-zone legislation, near-zero import duties, and a diplomatic network spanning 180 trade missions. Dubai’s prime office space now costs USD 60 per square foot, up 25% from 2024, and vacancy in Grade-A towers has dipped below 3%. As leases tighten, Sharjah Research Technology and Innovation Park lures spill-over demand with 15-year rent guarantees. Abu Dhabi fortifies its value proposition by anchoring an OpenAI cluster and positioning itself as a sovereign cloud hub.
Saudi Arabia represents the fastest-growing territory with a 10.18% CAGR, underpinned by the Regional Headquarters mandate compelling foreign contractors to base senior management domestically. A USD 10 billion data-center slate reinforces the edge-cloud mesh needed for latency-sensitive AI inference, while a 30-year tax break mitigates initial investment risk. NEOM’s OXAGON industrial city offers plug-and-play zones for R&D pods linked directly to advanced port facilities, enhancing attraction for the automotive and renewables verticals.
South Africa and Egypt round out the top four destinations. Cape Town leverages an English-first workforce and a deep financial services lineage to support capital markets surveillance and actuarial processing for insurers across sub-Saharan Africa. Johannesburg broadens the mix with agile software studios targeting fintech disruptors on the continent. In Egypt, the Middle East, and Africa global capability centers market share remains lower, but growth remains strong. The USD 30 million Deloitte Innovation Hub, launched in 2024, signals confidence in Cairo’s developer talent. Government cloud services running on 100% renewable power underscore their cost-advantage and sustainability credentials, which resonate with European buyers sensitive to Scope 3 emissions.
Competitive Landscape
The market exhibits moderate concentration as hyperscalers, Indian heritage outsourcers, and regional specialists compete for large contracts. Amazon leads infrastructure with USD 7 billion committed to Saudi Arabia and multiple African nations, creating an ecosystem for dependent ISVs and managed-service partners. Microsoft partners with capital through joint ventures, such as the G42 relationship, illustrating the need for local equity stakeholding in regulated sectors. Oracle’s sovereign-cloud strategy leverages partnerships with stc Group, offering in-country data residency compliance across two live Saudi regions.
TCS, Infosys, and Wipro scale their Indian playbooks by tapping local universities, making the trio formidable for hybrid BOT assignments. Regional boutiques fold sector depth into the contest: Riyadh-based Raqami Islamic Banking Solutions captures Sharia-compliant finance work, while Cape Town’s DyDx unites blockchain specialists under a fintech sandbox license. Strategic maneuvers increasingly revolve around ESG credentials, with Amazon signing solar PPAs for a 450 megawatt portfolio in Saudi Arabia and Oracle targeting LEED Platinum certification for new data halls.
Future rivalry will center on automation maturity, sovereign-cloud alignment, and talent development track records, rather than pure cost. Providers able to demonstrate a quantifiable sustainability impact and compliance with regulated data will likely capture high-margin workloads, such as health-tech diagnostics and carbon-credit verification.
Middle East and Africa Global Capability Centers Industry Leaders
Cognizant Technology Solutions
International Business Machines Corporation
Accenture PLC
Capgemini SE
Tata Consultancy Services Limited
- *Disclaimer: Major Players sorted in no particular order

Recent Industry Developments
- January 2025: Egypt launched its first government data and cloud computing center on the Ain Sokhna corridor, initially covering 10,000 m² with room for future doubling.
- January 2025: Egypt unveiled a National Artificial Intelligence Strategy 2025-2030, targeting a USD 42.7 billion GDP contribution by 2030.
- December 2024: Middle East investors deployed USD 3.6 billion into global climate-tech ventures, according to PwC Middle East.
- October 2024: Oracle completed its second public cloud region in Riyadh under a USD 1.5 billion Saudi expansion.


Middle East and Africa Global Capability Centers Market Report Scope
The scope of the global capability center study for the market segmentation by the Function/Capability for (i) Information Technology (IT) and Digital Services segment is limited to Software Development, Cloud and Infrastructure Management, Cybersecurity, Data Analytics and AI/ML; (ii) Engineering / ER&D segment is limited to Product Design and Testing, Embedded Systems, Digital Twin / Simulation; (iii) Business Process Management (BPM) segment is limited to Finance and Accounting, HR, Payroll and Talent Management, Procurement, Customer Service; and (iv)Knowledge Process Outsourcing (KPO) segment is limited to Market Research and Insights, Risk and Compliance, Legal and Regulatory Support, Strategy and Consulting Support. Similarly, for segmentation by the Engagement Model, scope for (i) Hybrid Build-Operate-Transfer (BOT) is limited to Joint Venture / Strategic Partnership and Virtual Captive Model. The rest of the segment scope is as specified for the listed segment.
| Information Technology (IT) and Digital Services |
| Engineering / ER&D |
| Business Process Management (BPM) |
| Knowledge Process Outsourcing (KPO) |
| Captive (Self-Build) / In-house |
| Build-Operate-Transfer (BOT) |
| Hybrid Build-Operate-Transfer (BOT) (Joint Venture / Strategic Partnership and Virtual Captive Model) |
| Large Enterprises |
| Small and Medium Enterprises (SMEs) |
| Banking, Financial Services, and Insurance (BFSI) |
| Telecom and IT |
| Healthcare and Life Sciences |
| Manufacturing, Automotive and Industrial |
| Retail and Consumer Goods |
| Other Industry Verticals |
| United Arab Emirates |
| Saudi Arabia |
| South Africa |
| Egypt |
| Rest of Middle East and Africa |
| By Function / Capability | Information Technology (IT) and Digital Services |
| Engineering / ER&D | |
| Business Process Management (BPM) | |
| Knowledge Process Outsourcing (KPO) | |
| By Engagement Model | Captive (Self-Build) / In-house |
| Build-Operate-Transfer (BOT) | |
| Hybrid Build-Operate-Transfer (BOT) (Joint Venture / Strategic Partnership and Virtual Captive Model) | |
| By Organization Size | Large Enterprises |
| Small and Medium Enterprises (SMEs) | |
| By Industry Vertical | Banking, Financial Services, and Insurance (BFSI) |
| Telecom and IT | |
| Healthcare and Life Sciences | |
| Manufacturing, Automotive and Industrial | |
| Retail and Consumer Goods | |
| Other Industry Verticals | |
| By Country | United Arab Emirates |
| Saudi Arabia | |
| South Africa | |
| Egypt | |
| Rest of Middle East and Africa |


Key Questions Answered in the Report
What is the projected value of the Middle East and Africa global capability centers market by 2031?
The market is expected to reach USD 31.3 billion by 2031, reflecting a 9.08% CAGR from 2026.
Which country is growing the fastest for capability centers in the region?
Saudi Arabia leads the growth with a forecast 10.18% CAGR, aided by policy incentives and large-scale data center construction.
Which functional segment is expanding most rapidly?
Information Technology and Digital Services is advancing at a 9.72% CAGR as firms adopt AI-native and cloud-first operating models.
Why are small and medium enterprises accelerating their share of Global Capability Center demand?
Cloud-native platforms and pay-as-you-go engagement models reduce entry costs, enabling SMEs to adopt enterprise-grade capabilities and grow at a 11.18% CAGR.
What is the main regulatory barrier for cross-border Global Capability Center operations?
Divergent data-protection laws across jurisdictions create compliance complexity and demand localized hosting strategies.
Page last updated on:


