Microarray Scanners Market Size and Share
Market Overview
| Study Period | 2020 - 2031 |
|---|---|
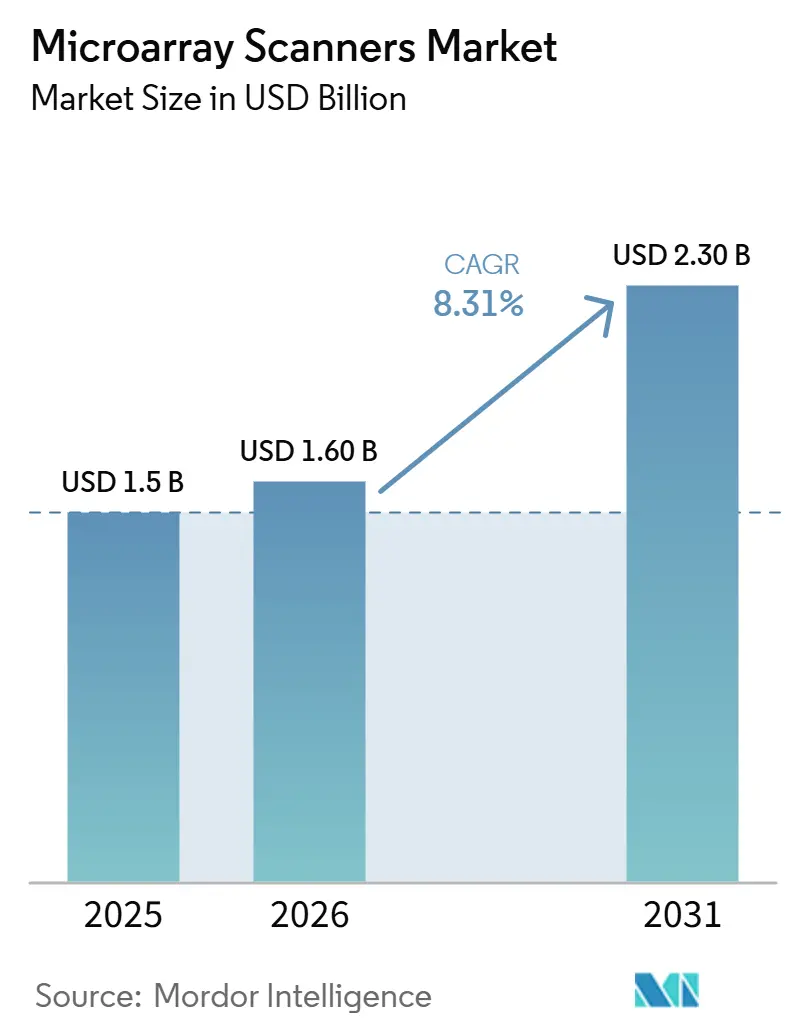
| Market Size (2026) | USD 1.60 Billion |
| Market Size (2031) | USD 2.30 Billion |
| Growth Rate (2026 - 2031) | 8.31% CAGR |
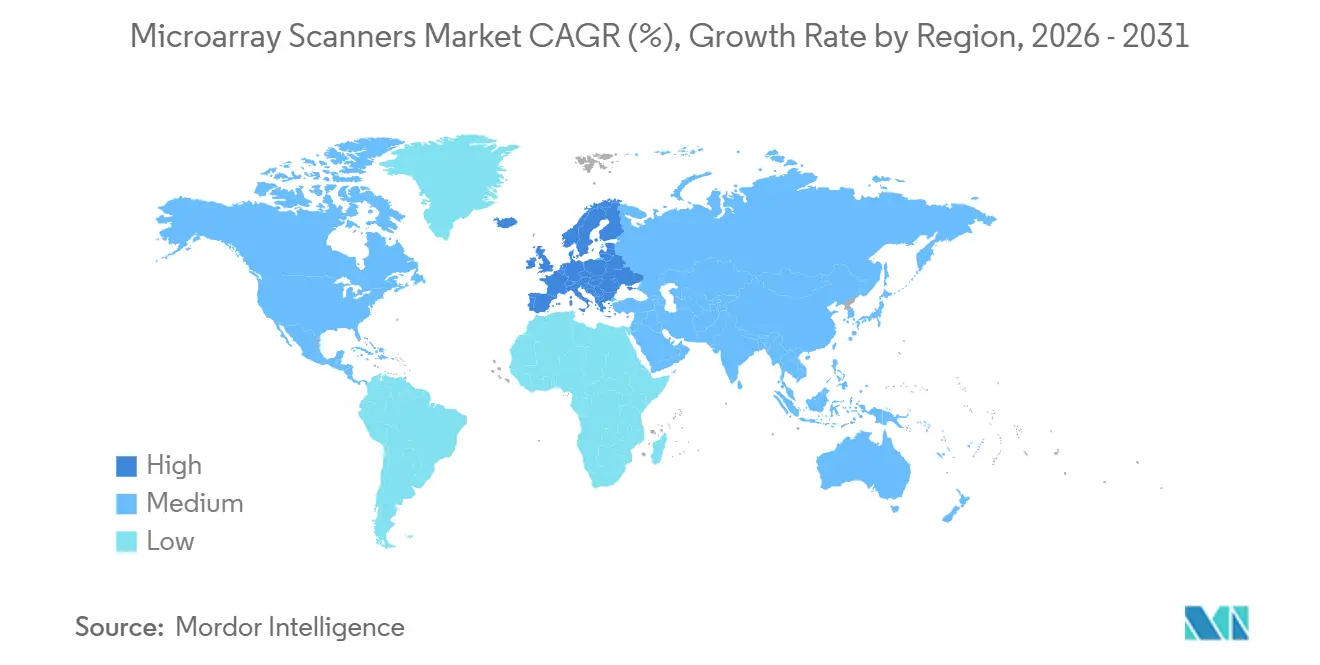
| Fastest Growing Market | Europe |
| Largest Market | North America |
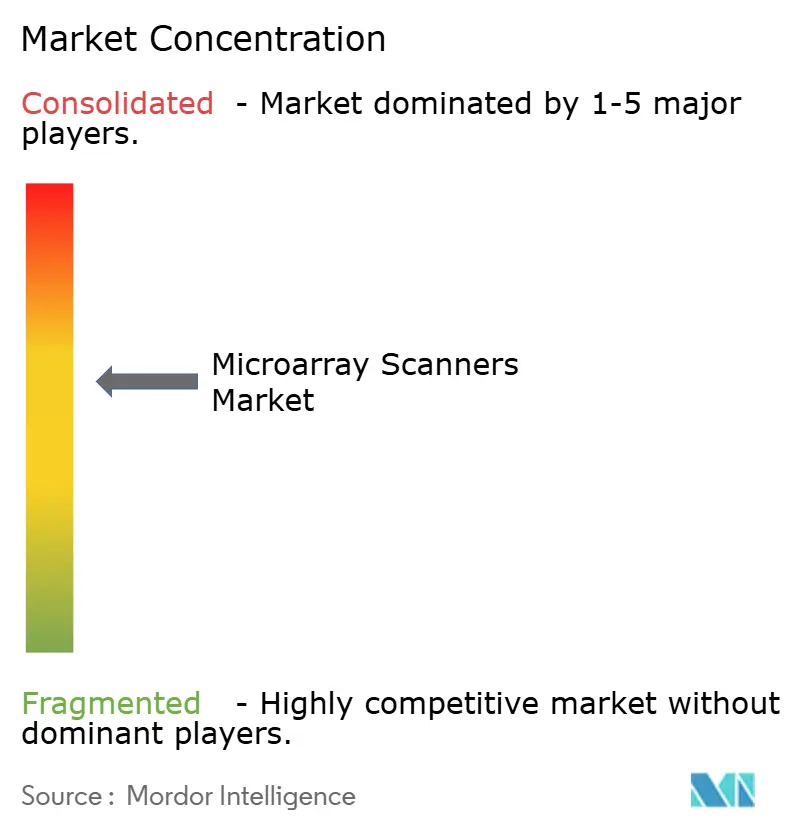
| Market Concentration | Medium |
Major Players *Disclaimer: Major Players sorted in no particular order Image © Mordor Intelligence. Reuse requires attribution under CC BY 4.0. | |
Microarray Scanners Market Analysis by Mordor Intelligence
The Microarray Scanners Market size is expected to grow from USD 1.5 billion in 2025 to USD 1.60 billion in 2026 and is forecast to reach USD 2.30 billion by 2031 at 8.31% CAGR over 2026-2031.
Clinical volumes stay resilient because chromosomal microarray analysis (CMA) remains guideline-backed for prenatal and postnatal testing, yet vendors confront sequencing substitution that is eroding new‐unit demand. Fluorescence scanners still anchor routine DNA and CGH workflows, although multi-mode CCD/CMOS imagers that combine fluorescence, chemiluminescence, and near-infrared detection are winning budgets in laboratories that want one platform for many assays. Protein, glycan, and peptide arrays are broadening the customer base beyond genetics, giving the Microarray scanners market fresh relevance in therapeutic antibody discovery and vaccine research. Replacement cycles dominate revenue strategy as hospital and core-facility managers upgrade aging fleets rather than add incremental capacity.
Key Report Takeaways
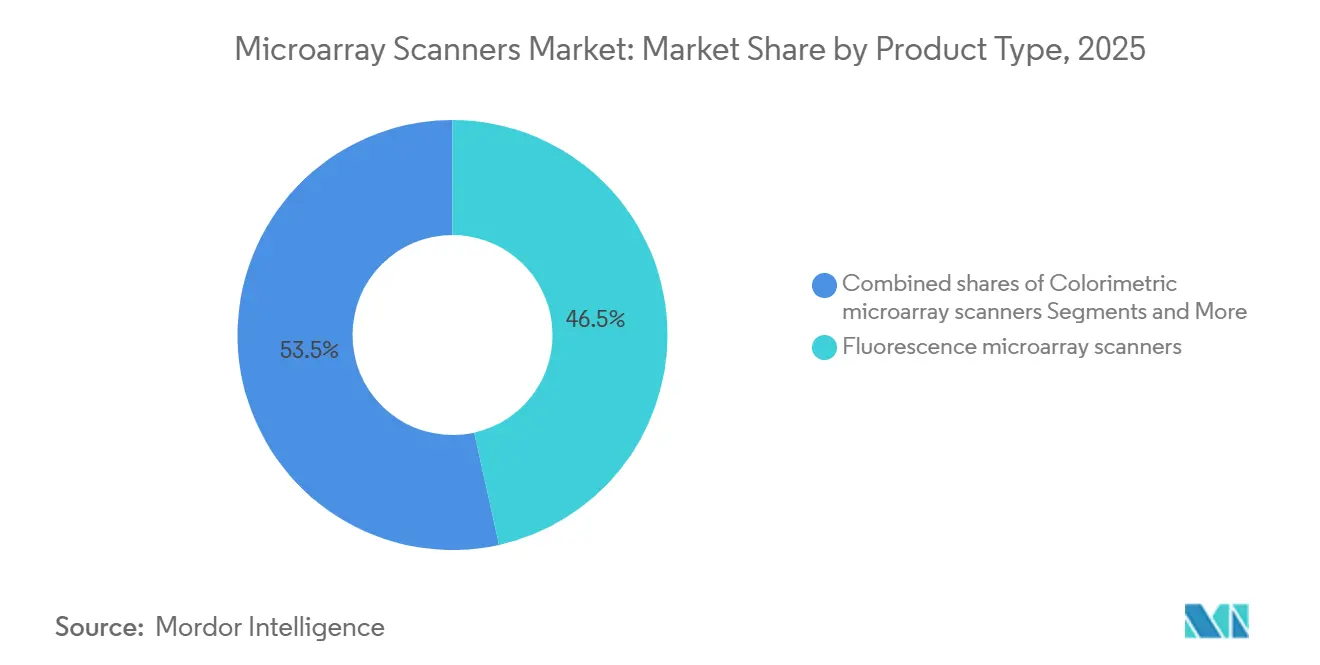
- By product type, fluorescence scanners held 46.53% of the Microarray scanners market share in 2025, while CCD/CMOS imagers are forecast to advance at an 8.57% CAGR through 2031.
- By technology, DNA/CGH/SNP arrays retained 51.78% of the Microarray scanners market size in 2025, whereas protein, antibody, and glycan arrays are projected to grow at an 8.63% CAGR to 2031.
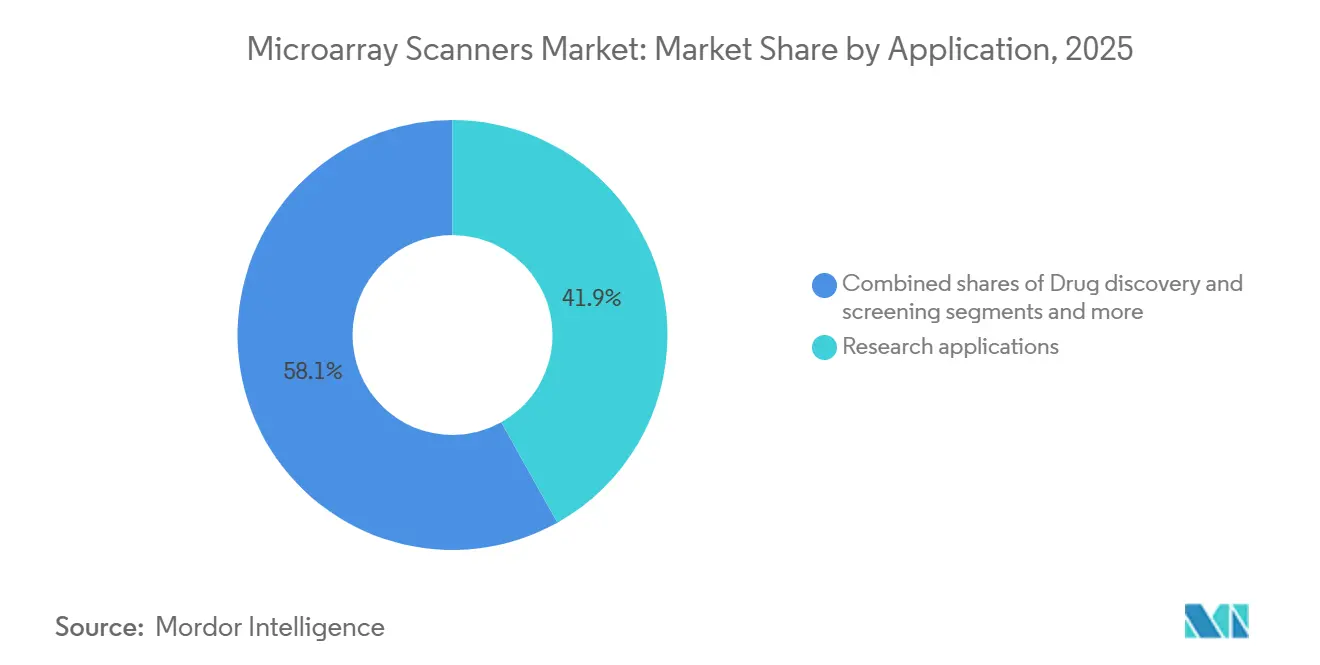
- By application, diagnostics and clinical cytogenetics are set to climb at an 8.71% CAGR over 2026-2031, outpacing the research segment’s 41.89% revenue share in 2025.
- By end user, pharmaceutical and biotechnology companies will expand at an 8.66% CAGR between 2026 and 2031, overtaking the 46.89% share held by academic institutes in 2025.
- By geography, North America led with 44.16% market share, yet Europe is expected to grow at 8.59% CAGR by 2031.
Note: Market size and forecast figures in this report are generated using Mordor Intelligence’s proprietary estimation framework, updated with the latest available data and insights as of January 2026.
Global Microarray Scanners Market Trends and Insights
Drivers Impact Analysis*
| Driver | (~) % Impact on CAGR Forecast | Geographic Relevance | Impact Timeline |
|---|---|---|---|
| Guideline-backed prenatal/postnatal CMA sustains clinical scanning volumes | +1.8% | North America, Europe, Middle East | Medium term (2-4 years) |
| Research arrays remain cost-effective for GWAS/epigenomics vs sequencing | +1.5% | Global, with concentration in North America & APAC | Long term (≥ 4 years) |
| Large installed base of arrays prolongs scanner replacement cycles | +1.2% | Global | Long term (≥ 4 years) |
| Growth in protein/glycan/peptide arrays expands use cases | +0.9% | North America, Europe | Medium term (2-4 years) |
| Multi-mode imagers broaden access to slide-based microarray scanning | +0.7% | Global, early adoption in Europe & APAC | Short term (≤ 2 years) |
| MEA policy codification strengthens CMA utilization | +0.6% | Middle East (UAE, Saudi Arabia, Qatar) | Short term (≤ 2 years) |
| Source: Mordor Intelligence | |||
Guideline-Backed Prenatal/Postnatal CMA Sustains Clinical Scanning Volumes
The Society for Maternal-Fetal Medicine reaffirmed CMA as first-tier prenatal testing in January 2025, and the American College of Obstetricians and Gynecologists echoed this position in March 2026, preserving reimbursement under U.S. CPT codes 81228, 81229, and 81349[1]Society for Maternal-Fetal Medicine, “Chromosomal Microarray Analysis in Prenatal Diagnosis,” smfm.org. Canada’s professional bodies maintain similar endorsements, ensuring a stable clinical demand floor across North America. These policies shield existing scanner fleets from immediate obsolescence even as exome sequencing gains public coverage. Hospitals therefore, allocate capital toward refreshing legacy hardware rather than embracing disruptive technologies in cytogenetics. The cushion, however, may thin if sequencing’s diagnostic yield continues to outperform CMA in head-to-head trials.
Research Arrays Remain Cost-Effective for GWAS/Epigenomics vs Sequencing
Large population studies still prefer array technology when budgets are tight and cohort sizes exceed 10,000 samples. Illumina’s Global Screening Array costs USD 40 per genotyping sample, versus USD 80-100 for low-pass sequencing at equivalent scale [2]Illumina, “Global Screening Array Product Sheet,” illumina.com. MethylationEPIC v2.0 profiles nearly one million CpG sites for USD 200, fourfold cheaper than whole-genome bisulfite sequencing, supporting epidemiology programs in China and Japan. Cost advantages, coupled with mature informatics pipelines, encourage funders to extend array grants through the remainder of the decade. Nevertheless, arrays do forfeit rare-variant and structural-variant insight, limiting their role in precision oncology.
Large Installed Base Prolongs Scanner Replacement Cycles
Roughly 8,000-10,000 scanners remain in service worldwide, and many exceed 15 years of use. With refurbished units advertised at USD 12,500, fiscally constrained labs often upgrade only when vendors halt support. STRATEC’s 2024 report showed instrument revenue stagnation but 14.8% growth in reagents, underscoring a consumables-driven model [3]STRATEC SE, “Annual Report 2024,” stratec.com. Tecan and Bio-Rad discontinuations raise maintenance risks, yet they also propel demand toward brands that pledge long-tail servicing, chiefly Illumina and Agilent.
Growth in Protein/Glycan/Peptide Arrays Expands Use Cases
Protein arrays deliver high-throughput epitope mapping and off-target screening that sequencing cannot address. ProImmune’s ProArray Ultra, launched in 2025, offers 9,000 full-length human proteins and has been adopted by 15 of the top 20 biopharma companies. Glycan arrays facilitate vaccine research through carbohydrate-binding profiling, while peptide arrays support post-translational modification studies. These modalities open fresh revenue channels and reduce dependence on DNA-centric assays, extending the relevance of the Microarray scanners market.
Restraints Impact Analysis*
| Restraint | (~) % Impact on CAGR Forecast | Geographic Relevance | Impact Timeline |
|---|---|---|---|
| Sequencing substitute pressure (ES/GS first-tier in pediatrics) | -1.4% | Global, most acute in North America & Europe | Short term (≤ 2 years) |
| High instrument cost and specialized staffing needs | -1.1% | Emerging markets (APAC ex-China, MEA, South America) | Medium term (2-4 years) |
| Cross-platform file/format incompatibilities | -0.8% | Global | Long term (≥ 4 years) |
| Legacy product discontinuations and parts/service risk | -0.6% | Global, concentrated in North America & Europe | Medium term (2-4 years) |
| Source: Mordor Intelligence | |||
Sequencing Substitute Pressure (ES/GS First-Tier in Pediatrics)
A 2024 Czech cohort study showed exome sequencing achieving 48.9% diagnostic yield versus CMA’s historical 15-20%. The American College of Medical Genetics now permits exome sequencing as a first-tier test for developmental delay, eroding the unique clinical justification for arrays. Illumina’s NovaSeq X can deliver whole genomes at USD 200, intensifying cost-per-answer competition. Hospitals weigh whether to refresh scanners or divert funds to sequencing platforms that satisfy broader diagnostic menus.
High Instrument Cost and Specialized Staffing Needs
Entry-level fluorescence scanners start at USD 80,000 and rise to USD 250,000 for autoloaders, sums that outstrip capital budgets in regions where annual per-capita health spending sits below USD 500. A 2025 Southeast Asian survey reported 60% of labs citing equipment price as the prime CMA hurdle and 40% pointing to limited technician expertise. Staff shortages and expensive upgrades constrain penetration in India, Indonesia, and most of Africa, collectively reducing the Microarray scanners market velocity by minimal CAGR.
*Our forecasts treat driver/restraint impacts as directional, not additive. The impact forecasts reflect baseline growth, mix effects, and variable interactions.
Segment Analysis
By Product Type: Multi-Mode Convergence Reshapes Demand
Fluorescence instruments dominated 46.53% of the Microarray scanners market share in 2025, yet CCD/CMOS biomolecular imagers are expected to clock an 8.57% CAGR through 2031, fueled by triple-modal detection that integrates chemiluminescence and near-infrared channels. The Microarray scanners market size for autoloaders is projected to reach USD 350 million by 2031 as pharmaceutical companies automate slide handling to support 384-array peptide screens. Colorimetric scanners, though niche, remain vital in allergy testing labs that lack laser safety infrastructure. Vendors such as Innopsys and Azure Biosystems co‐market cooled sensors with 16-bit dynamic range, delivering 1-micron resolution that enhances low-abundance protein capture. Refurbished fluorescence units sell for under USD 15,000, stretching lifecycles in cost-constrained labs but lowering new-unit bookings.
Capital budgets now favor platforms that aggregate Western blot, nucleic-acid, and antibody imaging to cut bench-space and maintenance costs. Laboratories upgrading from Tecan PowerScanner or Bio-Rad VersaDoc often pick multi-mode replacements to future-proof workflows. Innopsys’ InnoScan 1100 AL and Azure’s Sapphire show 30% year-over-year booking growth in Europe, where IVDR compliance urges consolidation of imaging assets. Fluorescence-only systems maintain relevance in clinical CMA labs because regulatory validation exists only for legacy dyes, yet emerging facilities skip single-mode options in favor of converged imagers. The product mix shift is pivotal to the Microarray scanners market trajectory through 2031.


By Technology Supported: Protein Arrays Gain Pharma Traction
DNA/CGH/SNP arrays still generated 51.78% of 2025 revenue, but protein, antibody, and glycan arrays will ascend at an 8.63% CAGR by 2031. Pharmaceutical companies rely on 9,000-feature protein arrays to probe antibody specificity at scale, an activity that cannot be substituted by sequencing. Methylation arrays remain entrenched in epidemiology because they interrogate 935,000 CpG loci for USD 200 per sample, beating bisulfite sequencing on cost and turnaround. MicroRNA and transcriptomics arrays lose share to RNA-seq, but persist in more than1,000-sample discovery screens that prioritize cost over novel isoform resolution.
Protein arrays diversify scanner payloads, sustaining demand outside classical cytogenetics. Glycan chips help virologists decode viral receptor preferences; peptide libraries map kinase inhibitor selectivity faster than LC-MS. Such assays all depend on glass slides and high-sensitivity laser excitation, reaffirming hardware importance. DNA array volume may plateau, yet aggregate throughput across non-nucleic targets keeps utilization high, tempering sequencing headwinds that otherwise threaten the Microarray scanners market.
By Application: Diagnostics Outpace Research Growth
Research held 41.89% of 2025 consumption, but diagnostic cytogenetics is slated to grow at an 8.71% CAGR. Society-backed prenatal and postnatal CMA ensures stable reimbursement in North America and Europe, pushing hospitals to replace aging scanners that fail ISO 15189 uptime metrics. Research remains vital for GWAS and epigenome mapping, yet faces slower budget increases as sequencing prices drop. Drug discovery teams adopt protein arrays for off-target analyses, carving a durable pharma niche. Agrigenomics continues to favor SNP arrays at USD 20 per sample for hybrid selection in maize and cattle.
Clinical volume drives predictable reagent spend and service contracts, which produce higher gross margins than academic projects. Hospitals seek autoloaders to shrink manual slide handling, boosting accessory revenue. At the same time, research institutes stretch grant dollars by refurbishing scanners from secondary markets, sustaining consumables flow but muting hardware growth. The result is a mixed demand picture in which diagnostics supply the fastest revenue line while research provides scale economies for consumables manufacturing.
By End User: Pharma Spending Accelerates
Academic and research institutes controlled 46.89% of 2025 revenue, yet pharma and biotech companies will post an 8.66% CAGR through 2031, reflecting intensified biologics pipelines that demand high-throughput epitope screening. CROs provide overflow capacity at USD 50-80 per sample, enabling small biotechs to outsource genotyping without capital expenditure. Hospitals ramp CMA volume in response to updated prenatal guidelines and allocate budget to replacement scanners that meet cybersecurity and QC automation standards.
Pharma adoption of protein arrays underwrites premium-priced multi-mode imagers, enlarging average selling price and increasing maintenance revenue. Academic users rely on grant cycles; their purchasing cadence is lumpy but sizeable when national biobank projects kick off. CROs opt for scalable leasing models, smoothing vendor revenue. Consequently, vendor sales teams rotate focus toward pharma key accounts where mid-life upgrade orders promise recurring consumable pull-through, solidifying the Microarray scanners market over the forecast horizon.
Geography Analysis
North America delivered 44.16% of 2025 revenue, but Europe will lead growth at an 8.59% CAGR thanks to In Vitro Diagnostic Regulation enforcement that compels labs to upgrade to compliant scanners. The Microarray scanners market in Europe is forecast to grow at 8.59% CAGR by 2031. Asia-Pacific benefits from China’s 14th Five-Year Plan genomics spending and Japan’s AMED cohorts, but penetration lags in India and Southeast Asia, where scanner cost remains prohibitive. The Middle East grows as Saudi Arabia and the UAE formalize reimbursement, although absolute volumes remain modest. Africa and South America add fewer than 100 new units through 2031 due to infrastructure shortfalls.
IVDR raises the bar on software validation and post-market surveillance, steering buyers toward vendors with deep regulatory resources. U.S. hospitals maintain CMA throughput under stable CPT payment but monitor sequencing guidelines for potential shifts. China emphasizes domestic manufacturing through CapitalBio, insulating its installed base from foreign currency swings. Japan’s AMED funds keep SNP arrays central to national biobank strategies, while Singapore’s Precision Medicine Initiative adds incremental scanner orders to serve Southeast Asian ancestry projects. Regional heterogeneity therefore shapes the revenue mix but uniformly favors vendors that combine compliance, service depth, and multi-mode imaging technology.

Competitive Landscape
Illumina, Agilent Technologies, and Thermo Fisher Scientific collectively hold the majority of global scanner revenue, but each allocates minimal R&D to next-generation hardware as sequencing margins eclipse arrays. Illumina’s microarray revenue fell notably year-over-year in Q3 2024 despite the company's sales of USD 1.1 billion. Agilent’s SureScan remains popular in clinical cytogenetics, yet the firm has not launched a new scanner since 2018. Thermo Fisher invests mainly in consumables, leaving Affymetrix GeneTitan as its solitary active platform.
Specialist challengers differentiate on multi-mode capability and regional pricing. Innopsys pushes 1-micron dual-laser imaging to European core facilities, recording significant booking growth in 2025. Azure Biosystems sells a USD 120,000 chemiluminescence-plus-NIR scanner that folds Western blot and array imaging into one unit, trimming lab workflows. CapitalBio Technology commands China’s local market with renminbi pricing and same-day service. STRATEC profits from OEM reagent lock-in, posting significant consumables growth in 2024. Legacy exits from Tecan and Bio-Rad fragment parts supply, nudging customers to switch to supported systems. Moderate consolidation persists, yet white-space exists in low-cost colorimetric scanners for point-of-care genotyping and in mid-range multi-mode imagers for emerging biopharma R&D.
Microarray Scanners Industry Leaders
Illumina Inc
Agilent Technologies
Thermo Fisher Scientific
Revvity, Inc
Bio‑Rad Laboratories
- *Disclaimer: Major Players sorted in no particular order

Recent Industry Developments
- March 2026: Agilent entered a definitive agreement to acquire Biocare Medical, a player in immunohistochemistry and FISH solutions. This move integrates clinical pathology solutions directly into Agilent's diagnostic group.
- October 2025: Thermo Fisher Scientific introduced the Applied Biosystems SwiftArrayStudio, an all-in-one microarray system that brings four genotyping steps together in a single instrument.
- February 2025: PathogenDx released the Panorama Human Cancer Version 1 Protein Functional Microarray, designed for high-sensitivity cancer biomarker screening.


Global Microarray Scanners Market Report Scope
As per the scope of the report, microarray scanners are specialized laboratory instruments designed to detect and quantify fluorescent signals from biological samples bound to a "chip" or microarray. These scanners typically employ high-performance lasers—commonly a 532 nm green laser and a 633–640 nm red laser—to excite fluorescent dyes, such as Cyanine-3 (Cy3) and Cyanine-5 (Cy5), that have been tagged to the sample molecules.
The microarray scanners market is segmented by product type, technology supported, applications, end users, and geography. By product type, the market is segmented into fluorescence microarray scanners, CCD/CMOS biomolecular imagers used for microarrays, colorimetric microarray scanners, and autoloaders & workflow accessories. By technology supported, the market is segmented DNA/CGH/SNP microarrays, methylation microarrays. protein/antibody/glycan microarrays, miRNA/transcriptomics arrays. By application, the market is segmented into research applications, disease diagnostics/clinical cytogenetics, drug discovery and screening, and agri genomics/non-human arrays. By end user, the market is segmented into academic & research institutes, pharmaceutical & biotechnology companies, hospitals & diagnostic laboratories, and contract research/service labs.
Geographically, the market is segmented across North America, Europe, the Asia-Pacific region, the Middle East & Africa, and South America. The market report also covers the estimated market sizes and trends for 17 countries across major regions globally. For each segment, the market size and forecast are provided in terms of value (USD).
| Fluorescence microarray scanners |
| CCD/CMOS biomolecular imagers used for microarrays |
| Colorimetric microarray scanners |
| Autoloaders & workflow accessories |
| DNA/CGH/SNP microarrays |
| Methylation microarrays |
| Protein/antibody/glycan microarrays |
| miRNA/transcriptomics arrays |
| Research applications |
| Disease diagnostics/clinical cytogenetics (CMA, oncology) |
| Drug discovery and screening |
| Agrigenomics/non-human arrays |
| Academic & research institutes |
| Pharmaceutical & biotechnology companies |
| Hospitals & diagnostic laboratories |
| Contract research/service labs |
| North America | United States |
| Canada | |
| Mexico | |
| Europe | Germany |
| United Kingdom | |
| France | |
| Italy | |
| Spain | |
| Rest of Europe | |
| Asia-Pacific | China |
| India | |
| Japan | |
| South Korea | |
| Australia | |
| Rest of Asia-Pacific | |
| Middle East and Africa | GCC |
| South Africa | |
| Rest of Middle East and Africa | |
| South America | Brazil |
| Argentina | |
| Rest of South America |
| By Product Type | Fluorescence microarray scanners | |
| CCD/CMOS biomolecular imagers used for microarrays | ||
| Colorimetric microarray scanners | ||
| Autoloaders & workflow accessories | ||
| By Technology Supported | DNA/CGH/SNP microarrays | |
| Methylation microarrays | ||
| Protein/antibody/glycan microarrays | ||
| miRNA/transcriptomics arrays | ||
| By Application | Research applications | |
| Disease diagnostics/clinical cytogenetics (CMA, oncology) | ||
| Drug discovery and screening | ||
| Agrigenomics/non-human arrays | ||
| By End User | Academic & research institutes | |
| Pharmaceutical & biotechnology companies | ||
| Hospitals & diagnostic laboratories | ||
| Contract research/service labs | ||
| By Geography | North America | United States |
| Canada | ||
| Mexico | ||
| Europe | Germany | |
| United Kingdom | ||
| France | ||
| Italy | ||
| Spain | ||
| Rest of Europe | ||
| Asia-Pacific | China | |
| India | ||
| Japan | ||
| South Korea | ||
| Australia | ||
| Rest of Asia-Pacific | ||
| Middle East and Africa | GCC | |
| South Africa | ||
| Rest of Middle East and Africa | ||
| South America | Brazil | |
| Argentina | ||
| Rest of South America | ||


Key Questions Answered in the Report
How fast will the Microarray scanners market grow through 2031?
Revenue is forecast to increase from USD 1.6 billion in 2026 to USD 2.3 billion by 2031 at an 8.31% CAGR
Which product category is expanding quickest?
CCD/CMOS multi-mode imagers are projected to post an 8.57% CAGR as labs consolidate protein and nucleic-acid imaging.
Why is Europe the fastest-growing region?
The 2025 enforcement of IVDR compels laboratories to replace non-compliant scanners, pushing European sales up at an 8.59% CAGR.
What keeps arrays competitive against sequencing?
For cohorts larger than 10,000, arrays cost less than half of low-pass sequencing while covering key SNP or CpG targets.
Which end-user segment will contribute the most new revenue?
Pharmaceutical and biotechnology companies will grow at an 8.66% CAGR, driven by protein array adoption for antibody discovery.
Page last updated on:


