Metabolism Assays Market Size and Share
Market Overview
| Study Period | 2020 - 2031 |
|---|---|
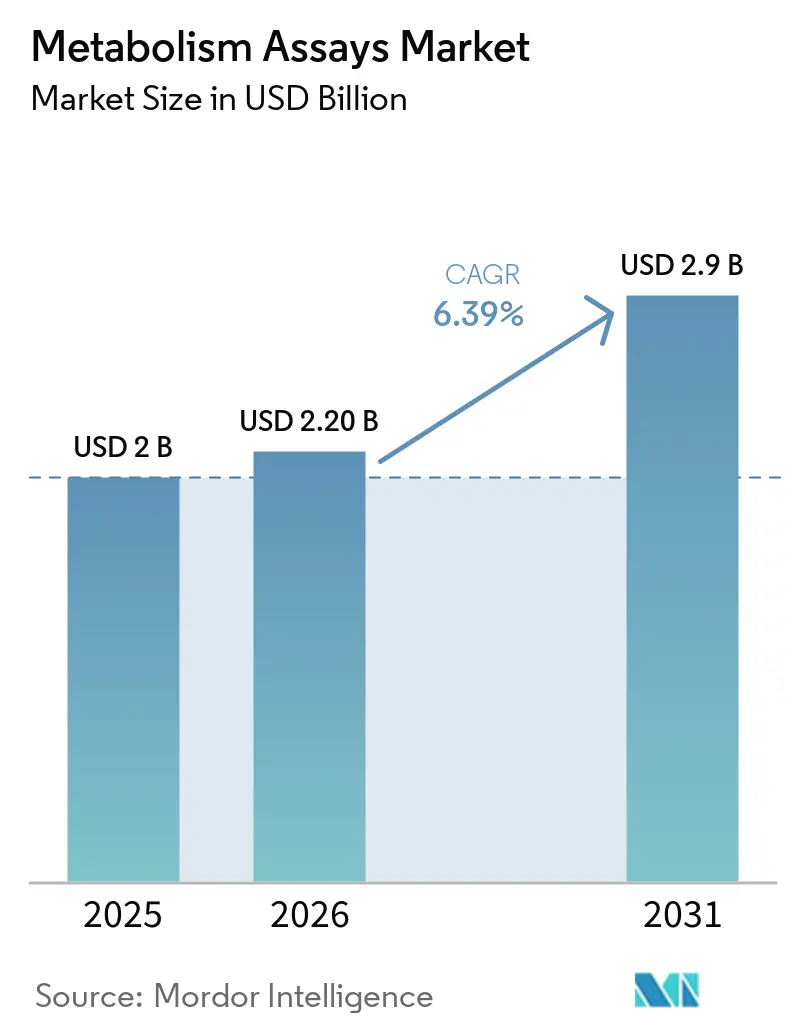
| Market Size (2026) | USD 2.20 Billion |
| Market Size (2031) | USD 2.9 Billion |
| Growth Rate (2026 - 2031) | 6.39% CAGR |
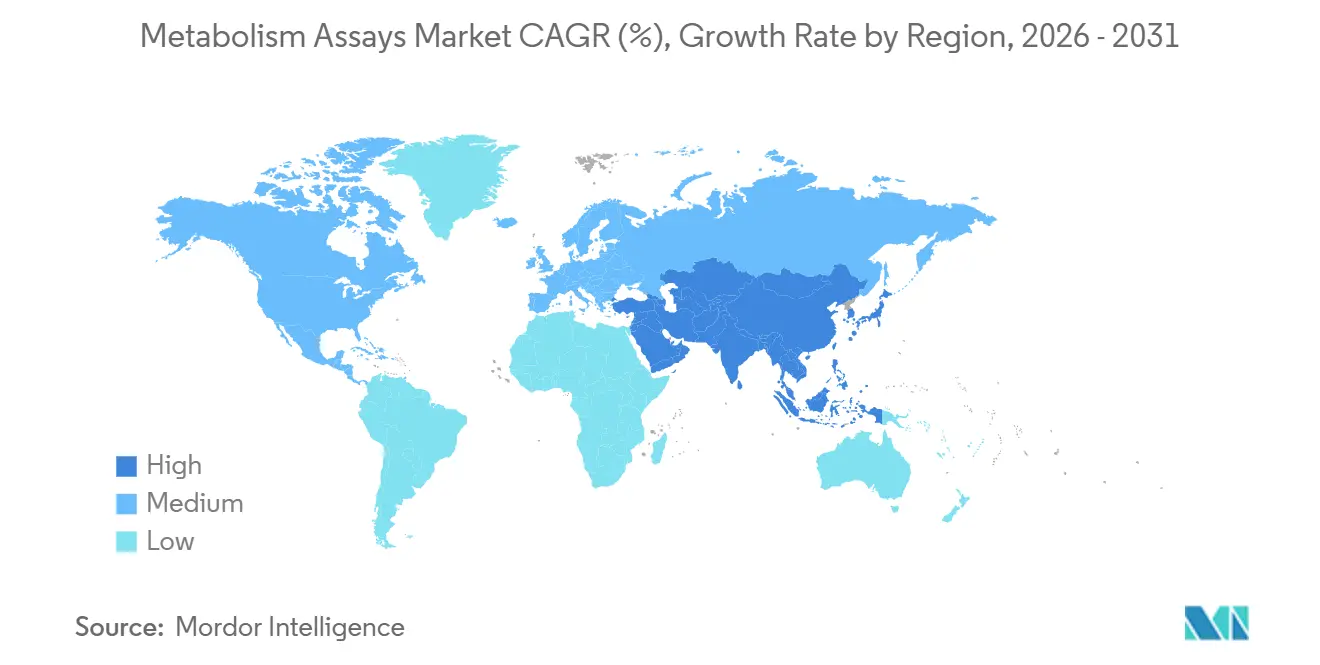
| Fastest Growing Market | Asia Pacific |
| Largest Market | North America |
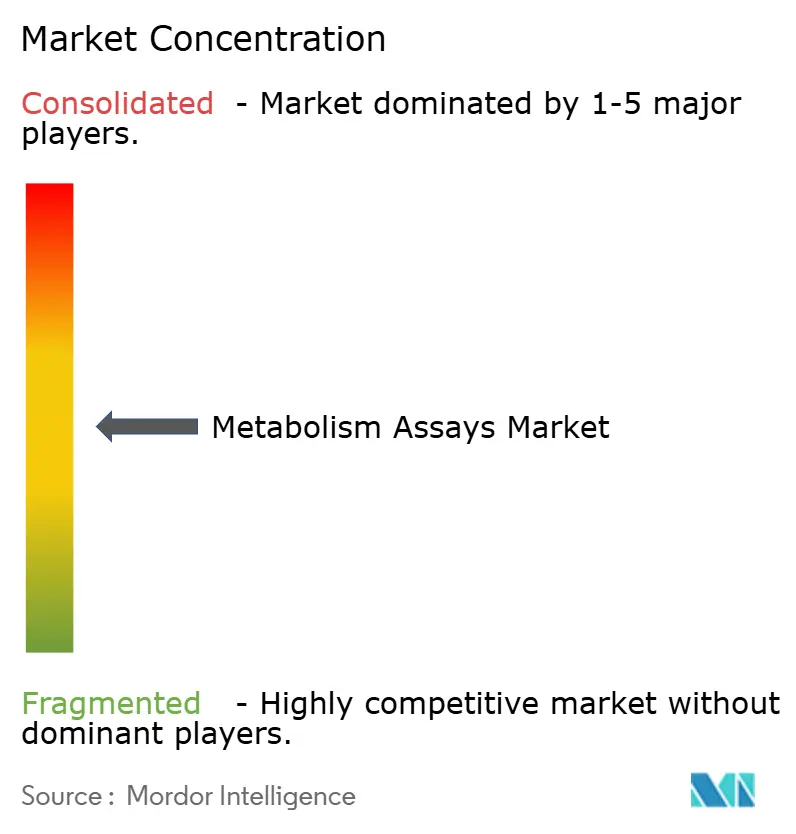
| Market Concentration | Medium |
Major Players *Disclaimer: Major Players sorted in no particular order Image © Mordor Intelligence. Reuse requires attribution under CC BY 4.0. | |
Metabolism Assays Market Analysis by Mordor Intelligence
The Metabolism Assays Market size was valued at USD 2 billion in 2025 and is estimated to grow from USD 2.20 billion in 2026 to reach USD 2.9 billion by 2031, at a CAGR of 6.39% during the forecast period (2026-2031).
Demand for early detection of mitochondrial dysfunction, insulin resistance, and lipid dysregulation is rising as the prevalence of metabolic syndrome has climbed from 11.9% in 2000 to 28.4% in 2023 [1]Zhixin Rao et al., “Global, regional, and national burdens of metabolic syndrome,” Nature Communications, nature.com. Hospitals, diagnostic laboratories, and pharmaceutical companies are adopting real-time flux platforms that shorten assay turnaround times and improve mechanistic insight, while funding programs such as NIH PAR-25-153 are accelerating kit innovation. Capital spending on multimode readers and ultra-high-performance liquid chromatography platforms continues despite tighter research budgets because the systems enable multiplexed, pathology-specific panels that command premium reimbursement. The metabolism assays market is also capturing white space in cell and gene therapy lot-release testing following the FDA's December 2023 guidance highlighting metabolic activity as a critical quality attribute.
Key Report Takeaways
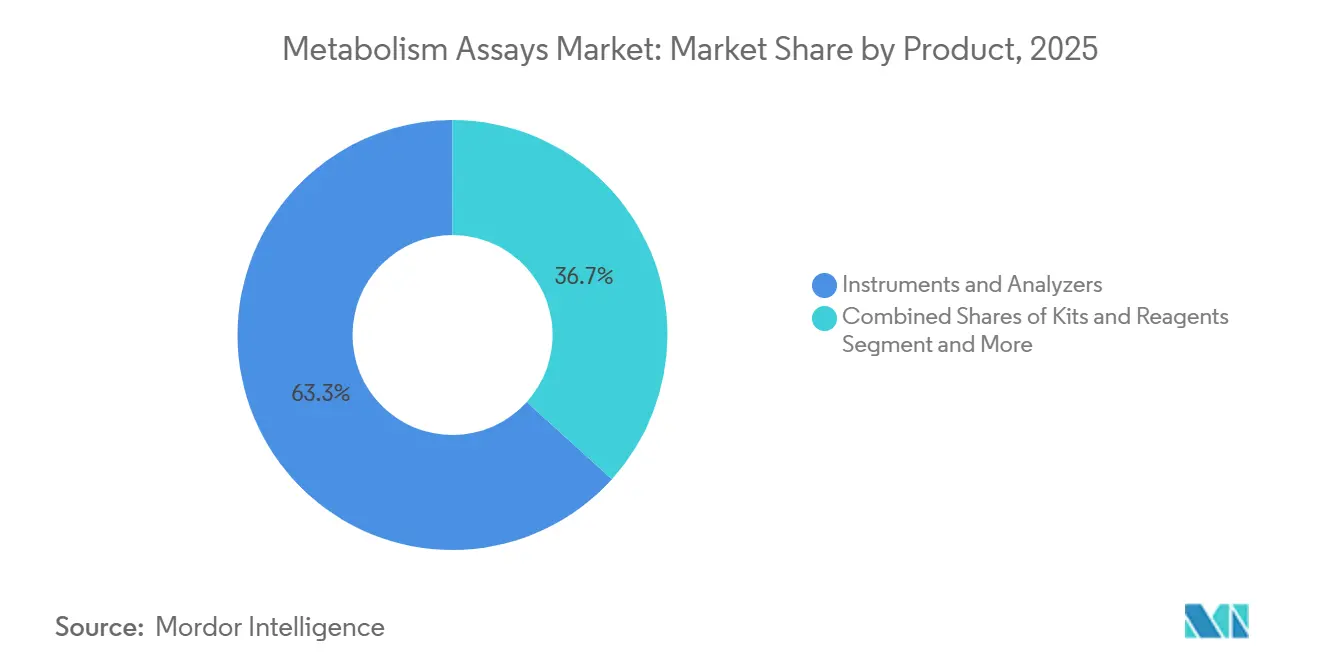
- By product, instruments and analyzers led with a 63.29% share of the metabolism assays market size in 2025 and is expected to grow at 6.98% CAGR through 2031.
- By technology, colorimetry held 53.29% of the metabolism assays market share in 2025, while fluorimetry is advancing at a 6.76% CAGR through 2031.
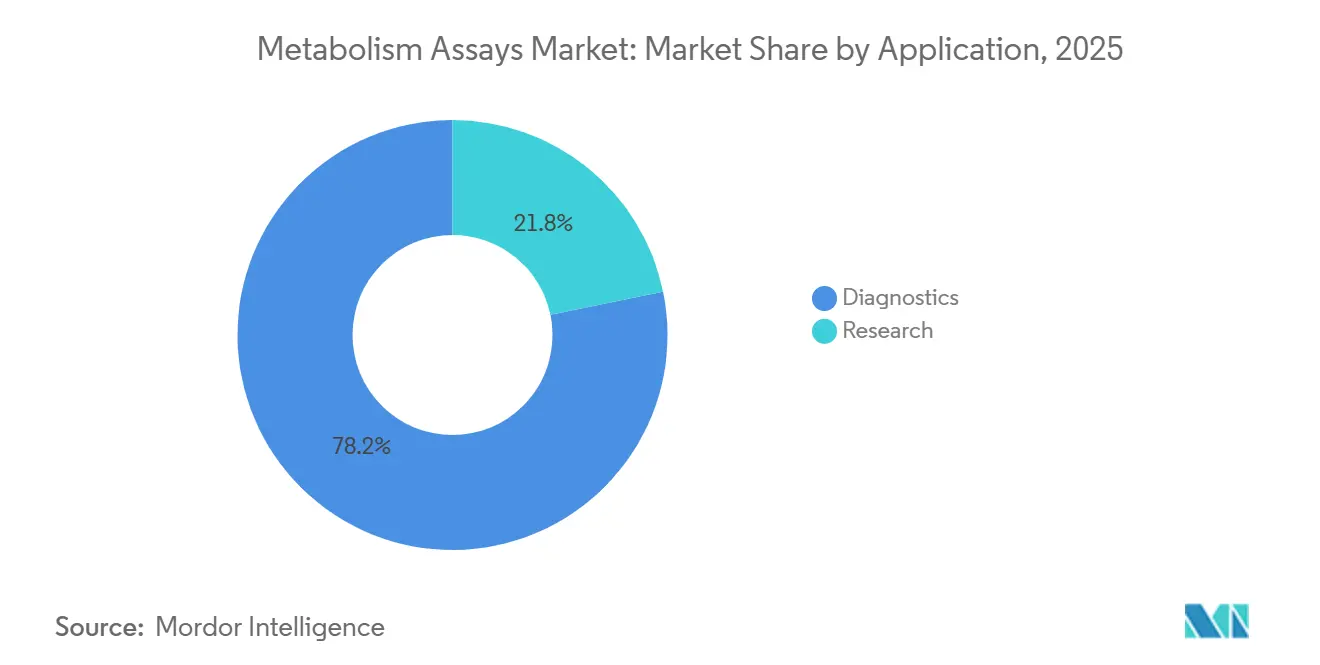
- By application, diagnostics accounted for 78.23% of revenue in 2025; the research segment is projected to grow at a 6.72% CAGR through 2031.
- By end user, hospitals captured 36.98% revenue in 2025, yet CROs and academic institutes are expanding at a 6.81% CAGR through 2031.
- By geography, North America dominated with 35.19% revenue in 2025; Asia-Pacific is forecast to register a 6.65% CAGR over 2026-2031.
Note: Market size and forecast figures in this report are generated using Mordor Intelligence’s proprietary estimation framework, updated with the latest available data and insights as of January 2026.
Global Metabolism Assays Market Trends and Insights
Driver Impact Analysis*
| Driver | (~) % Impact on CAGR Forecast | Geographic Relevance | Impact Timeline |
|---|---|---|---|
| Chronic and metabolic disease burden expanding research and diagnostics use-cases | +1.2% | Global, highest burden in Asia-Pacific and North America | Medium term (2-4 years) |
| Rising R&D funding and pharma adoption in drug discovery workflows | +0.9% | North America and Europe; emerging in China | Medium term (2-4 years) |
| Technology advances in real-time flux, high-throughput kits, and multimode readers | +0.8% | Global, led by North America and Europe | Short term (≤ 2 years) |
| Shift toward personalized and cell-based assays in translational research | +0.7% | North America and Europe | Long term (≥ 4 years) |
| Cell and gene therapy QC/potency readouts adopting metabolic profiling | +0.6% | North America and Europe; early uptake in Japan | Medium term (2-4 years) |
| Live-cell kinetic ATP/MMP analytics enabling mechanism-aware screening | +0.5% | Global pharma R&D hubs | Short term (≤ 2 years) |
| Source: Mordor Intelligence | |||
Chronic and Metabolic Disease Burden Expanding Research and Diagnostics Use-Cases
Metabolic syndrome now affects 1.54 billion adults, and diabetes cases are projected to reach 853 million by 2050. Hospitals are adding branched-chain amino acid and ceramide panels that detect pathology years before glucose rises. A 2026 multi-omic study showed machine-learning models with AUC greater than 0.85 for type 2 diabetes prediction, prompting payers to consider coverage for multiplexed kits. Glycated albumin and adipokine assays provide a short glycemic window, supporting monthly monitoring and new revenue for reagent suppliers. Consequently, the metabolism assays market continues to integrate into routine screening pathways.
Rising R&D Funding and Pharma Adoption in Drug Discovery Workflows
NIH grants PAR-25-153 and PAR-25-059 are channeling resources to assay miniaturization and high-content screening [2]National Institutes of Health, “PAR-25-153,” grants.nih.gov. Pharmaceutical firms deploy untargeted LC-MS panels to flag mitochondrial liabilities early; Thermo Fisher’s Orbitrap Astral Zoom detects more than 2,000 ions with sub-ppm accuracy, cutting toxicology attrition. CRO revenue is therefore rising faster than in-house budgets because outsourcing offers flexibility and access to niche expertise. As drug pipelines shift toward metabolic and immunometabolic targets, the metabolism assays market sees deeper penetration into primary and secondary screens.
Technology Advances in Real-Time Flux, High-Throughput Kits, and Multimode Readers
Agilent’s Seahorse XF Pro quantifies oxygen consumption and extracellular acidification in live cells within 3 hours, a drastic reduction compared to overnight colorimetric workflows [3]Agilent Technologies, “Form 10-K 2025,” sec.gov. Sartorius added kinetic ATP and mitochondrial membrane potential dyes to its Incucyte CX3 platform, enabling mechanism-aware time-lapse analytics. BMG LABTECH multimode readers now bundle absorbance, fluorescence, and luminescence, driving lab consolidation and standardization. These advances expand the market for metabolism assays by reducing per-sample run time and enabling multiplexing previously cost-prohibitive.
Shift Toward Personalized and Cell-Based Assays in Translational Research
A 66-metabolite plasma panel explained 52% of BMI variance and predicted response to bariatric surgery. Merck KGaA and Promega are co-developing 3D organoid metabolism kits that reproduce tissue architecture and oxygen gradients. Patient-derived organoids linked to mass spectrometry-based metabolomics help stratify therapy responders, making the metabolism assay market a linchpin of precision medicine pipelines.
Restraints Impact Analysis*
| Restraint | (~) % Impact on CAGR Forecast | Geographic Relevance | Impact Timeline |
|---|---|---|---|
| High capital and operational costs and skilled expertise requirements | –0.7% | Global, acute in Southeast Asia, Latin America, MEA | Medium term (2-4 years) |
| Substitution overlap with metabolomics MS/NMR; standardization gaps | –0.5% | Global research institutions | Long term (≥ 4 years) |
| Reproducibility and normalization challenges in real-time assays | –0.4% | Global academic labs and CROs | Short term (≤ 2 years) |
| Compound fluorescence/luminescence interference requiring orthogonal validation | –0.3% | Global pharma screening labs | Short term (≤ 2 years) |
| Source: Mordor Intelligence | |||
High Capital and Operational Costs and Skilled Expertise Requirements
Seahorse XF Pro analyzers list above USD 200,000, while annual consumables and service contracts can add another USD 50,000–100,000, making the platform inaccessible to many mid-tier hospitals and emerging-market laboratories. Tecan reported a 5.5% revenue decline and a USD 123 million net loss in 2025, citing lengthened instrument replacement cycles and delayed grant disbursements in Europe as key headwinds. Staffing further inflates the total cost of ownership because real-time assays need personnel trained in gas control, liquid-handling robotics, and kinetic data interpretation. Smaller organizations increasingly outsource testing to CROs, yet per-sample fees remain high for exploratory studies, limiting assay adoption in early discovery. Collectively, these factors trim market expansion in cost-sensitive regions.
Substitution Overlap with Metabolomics MS / NMR and Standardization Gaps
Orbitrap Astral Zoom and Stellar mass spectrometers detect over 2,000 ions per run, allowing untargeted profiling that can replace multiple single-analyte enzyme assays. However, only around 10% of LC-MS features receive confident metabolite IDs, hindering biological interpretation and delaying regulatory approval.
*Our forecasts treat driver/restraint impacts as directional, not additive. The impact forecasts reflect baseline growth, mix effects, and variable interactions.
Segment Analysis
By Product: Instruments Sustain Share Through Platform Integration
Instruments commanded 63.29% revenue in 2025 and will expand at a 6.98% CAGR through 2031. Kit suppliers maintain volume leadership, yet integration of hardware, consumables, and software into subscription bundles is shifting revenue to service contracts. Software-centric offerings such as MetaboAnalystR 4.0 remain a small but fast-growing slice as users seek automated pathway prediction.
The metabolism assays market continues to favor vendors that couple instruments with downstream analytics. Agilent’s Seahorse portfolio, for example, links flux measurements to cloud dashboards for cross-site comparison, locking in reagent demand. Meanwhile, Revvity’s QSight systems tie newborn screening kits to proprietary columns, protecting consumable margins. Pure-play reagent firms, therefore, explore co-marketing deals to secure instrument attachment rates in a consolidating customer base.


By Technology: Fluorimetry Gains on Sensitivity and Multiplexing
Colorimetry retained 53.29% of the metabolism assays market share in 2025 because hospital chemistry analyzers and glucose meters rely on absorbance at visible wavelengths. However, fluorimetry’s 6.76% CAGR through 2031 overtakes colorimetric growth as researchers demand low-abundance detection and multiplexed cytokine panels. The metabolism assays industry reports Z-prime values above 0.9 on PHERAstar readers, demonstrating robust screening.
Spectrometry adds breadth by profiling up to 2,000 analytes in one run. Orbitrap Astral Zoom systems help pharma link metabolite signatures to drug exposure, complementing targeted enzyme assays rather than replacing them. Time-resolved fluorescence and luminescence reduce autofluorescence but impose higher entry costs, keeping colorimetry relevant for point-of-care testing and emerging-market adoption.
By Application: Research Segment Accelerates on Drug Discovery and CGT
Diagnostics accounted for 78.23% of 2025 revenue, yet research is expected to expand faster, with 6.72% CAGR by 2031. Untargeted panels inform pharmacometabolomics, while functional assays confirm cell-therapy potency. Multi-omic panels with an AUC greater than 0.85 challenge HbA1c dominance and may unlock new CPT codes, sustaining diagnostic momentum.
Pharma projects now integrate stable-isotope flux tracing earlier, raising consumable pull-through for isotopically labeled substrates. CRO capacity builds worldwide as sponsors outsource method development and GLP validation. The metabolism assays market, therefore, benefits from both recurring kit sales and high-margin custom services.
By End User: CROs and Academia Outpace Hospitals on Outsourcing
Hospitals accounted for 36.98% of revenue in 2025, thanks to routine glucose and lipid testing. Reimbursement headwinds limit instrument refresh cycles, but adoption of glycated albumin and adipokine panels could lift throughput once clinical-utility dossiers mature.
CROs and academic institutes are forecast to post a 6.81% CAGR through 2031 as grant programs finance assay miniaturization. Access-as-a-service models let small biotechs run Seahorse or Incucyte workflows without a USD 200,000 capital outlay, supporting diffusion into early-stage programs. The metabolism assays market thus sees a shift in volume toward fee-for-service usage, although hospitals remain the largest single customer group.
Geography Analysis
North America generated 35.19% of 2025 revenue as FDA potency guidance and NIH funding kept assay pipelines full. Thermo Fisher and Agilent dominate the installed base, leveraging close proximity to biotech clusters that demand both colorimetric kits and high-resolution MS. Payer scrutiny on advanced panels persists, yet clinical-utility publications are unlocking coverage incrementally.
Europe benefits from the January 2025 EMA guideline that formalized reference-standard requirements, spurring sponsors to adopt validated metabolic readouts. Budget constraints in public universities slowed capital upgrades, seen in Tecan’s 2025 revenue decline. Nevertheless, Germany and the United Kingdom retain strong footprints in metabolic flux research, sustaining reagent demand.
Asia-Pacific is forecast to grow at 6.65% CAGR as China’s NMPA and India’s CDSCO streamline approvals. Promega’s MSI Detection Kit clearance in February 2026 proves the viability of local filings. Domestic manufacturers undercut multinationals by up to 50%, expanding sales of colorimetric kits in tier-2 hospitals. Multinationals, meanwhile, focus on premium research instruments, positioning the metabolism assays market for a twin-track growth model of volume and value.

Competitive Landscape
The metabolism assays market is moderately fragmented. Thermo Fisher, Agilent, Sartorius, Revvity, and Merck KGaA together account for a significant share of revenue, reflecting a Score 6 concentration. Thermo Fisher leverages Orbitrap and Seahorse platforms across discovery and clinical labs. Agilent’s USD 6.948 billion fiscal-2025 revenue relied on Seahorse and LC-MS consumables. Sartorius integrated live-cell imaging with MATTEK organoids to address 3D culture testing. Revvity capitalizes on newborn screening kits with regulatory approvals on four continents. Merck KGaA’s partnerships in organoid assays showcase vertical integration into physiologically relevant models.
Smaller suppliers compete by specializing. Cayman Chemical offers niche lipid standards, Dojindo sells fluorescent probes, and AAT Bioquest targets Latin America through distributors. AI-enabled platforms such as MetaboAnalystR and Metabolon’s dashboards differentiate on data interpretation, though regulatory acceptance remains nascent. Instrument-centric firms face margin pressure without consumable attachments, evidenced by Tecan’s 2025 net loss, pushing the sector toward hybrid hardware-plus-reagent models.
Metabolism Assays Industry Leaders
Thermo Fisher Scientific
Sartorius AG
Revvity
Agilent Technologies
Merck KGaA
- *Disclaimer: Major Players sorted in no particular order

Recent Industry Developments
- February 2026: Promega received NMPA approval for its MSI Detection Kit in China, marking its entry into local oncology diagnostics
- January 2026: Nature Medicine multi-omic study reported a 66-metabolite panel explaining 52% of BMI variance, supporting future reimbursement for metabolic panels.
- October 2025: Merck KGaA and Promega partnered to build 3D cell and organoid metabolism assay kits for pharma customers.


Global Metabolism Assays Market Report Scope
As per the scope of the report, Metabolism assays are quantitative analytical techniques used in biological and medical research to measure cellular biochemical activities, such as energy production, enzyme function, and nutrient consumption. By tracking these transformations, researchers can monitor cellular health and gain insights into fundamental biological processes, including cell growth, survival, and differentiation.
The metabolism assays market is segmented by product, technology, applications, end users, and geography. Based on the product, the market is segmented into kits & reagents, instruments & analyzers, and software & services. By technology, the market is segmented into colorimetry, fluorimetry, and spectrometry. Based on applications, the market is segmented into diagnosis (diabetes, obesity, cancer, cardiovascular diseases, and other diagnostics) and research. By end users, the market is segmented into hospitals, diagnostic laboratories, pharmaceutical & biotechnology companies, and CROs & academic research institutes.
Geographically, the market is segmented into North America, Europe, Asia-Pacific, the Middle East & Africa, and South America. The market report also covers the estimated market sizes and trends for 17 countries across major regions globally. For each segment, the market size and forecast are provided in terms of value (USD).
| Kits & Reagents |
| Instruments & Analyzers |
| Software & Services |
| Colorimetry |
| Fluorimetry |
| Spectrometry |
| Diagnostics | Diabetes |
| Obesity | |
| Cancer | |
| Cardiovascular Diseases | |
| Other Diagnostics | |
| Research |
| Hospitals |
| Diagnostic Laboratories |
| Pharmaceutical & Biotechnology Companies |
| CROs & Academic Research Institutes |
| North America | United States |
| Canada | |
| Mexico | |
| Europe | Germany |
| United Kingdom | |
| France | |
| Italy | |
| Spain | |
| Rest of Europe | |
| Asia-Pacific | China |
| India | |
| Japan | |
| South Korea | |
| Australia | |
| Rest of APAC | |
| Middle East & Africa | GCC |
| South Africa | |
| Rest of MEA | |
| South America | Brazil |
| Argentina | |
| Rest of South America |
| By Product | Kits & Reagents | |
| Instruments & Analyzers | ||
| Software & Services | ||
| By Technology | Colorimetry | |
| Fluorimetry | ||
| Spectrometry | ||
| By Application | Diagnostics | Diabetes |
| Obesity | ||
| Cancer | ||
| Cardiovascular Diseases | ||
| Other Diagnostics | ||
| Research | ||
| By End User | Hospitals | |
| Diagnostic Laboratories | ||
| Pharmaceutical & Biotechnology Companies | ||
| CROs & Academic Research Institutes | ||
| By Geography | North America | United States |
| Canada | ||
| Mexico | ||
| Europe | Germany | |
| United Kingdom | ||
| France | ||
| Italy | ||
| Spain | ||
| Rest of Europe | ||
| Asia-Pacific | China | |
| India | ||
| Japan | ||
| South Korea | ||
| Australia | ||
| Rest of APAC | ||
| Middle East & Africa | GCC | |
| South Africa | ||
| Rest of MEA | ||
| South America | Brazil | |
| Argentina | ||
| Rest of South America | ||


Key Questions Answered in the Report
How fast will the metabolism assays market grow by 2031?
It is forecast to post a 6.39% CAGR, lifting value from USD 2.20 billion in 2026 to USD 2.90 billion by 2031.
Which product type leads revenue today?
Instruments and analyzers hold 63.29% of 2025 revenue due to uptake of real-time flux platforms.
What drives Asia-Pacific demand?
Streamlined regulatory approvals in China and India plus the world’s largest diabetes population spur a 6.65% CAGR.
Why is fluorimetry gaining share?
Superior sensitivity and multiplexing support low-abundance metabolite detection, driving a 6.76% CAGR through 2031.
Page last updated on:


