Medical Imaging Reagents Market Size and Share
Market Overview
| Study Period | 2020 - 2031 |
|---|---|
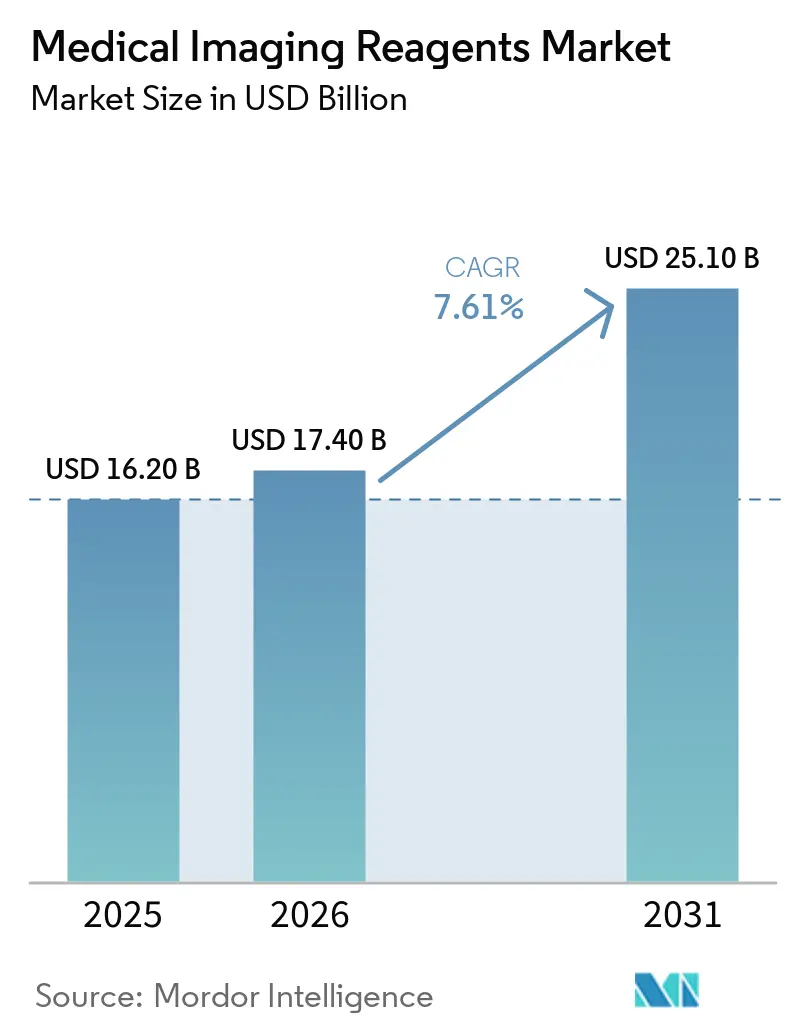
| Market Size (2026) | USD 17.40 Billion |
| Market Size (2031) | USD 25.10 Billion |
| Growth Rate (2026 - 2031) | 7.61% CAGR |
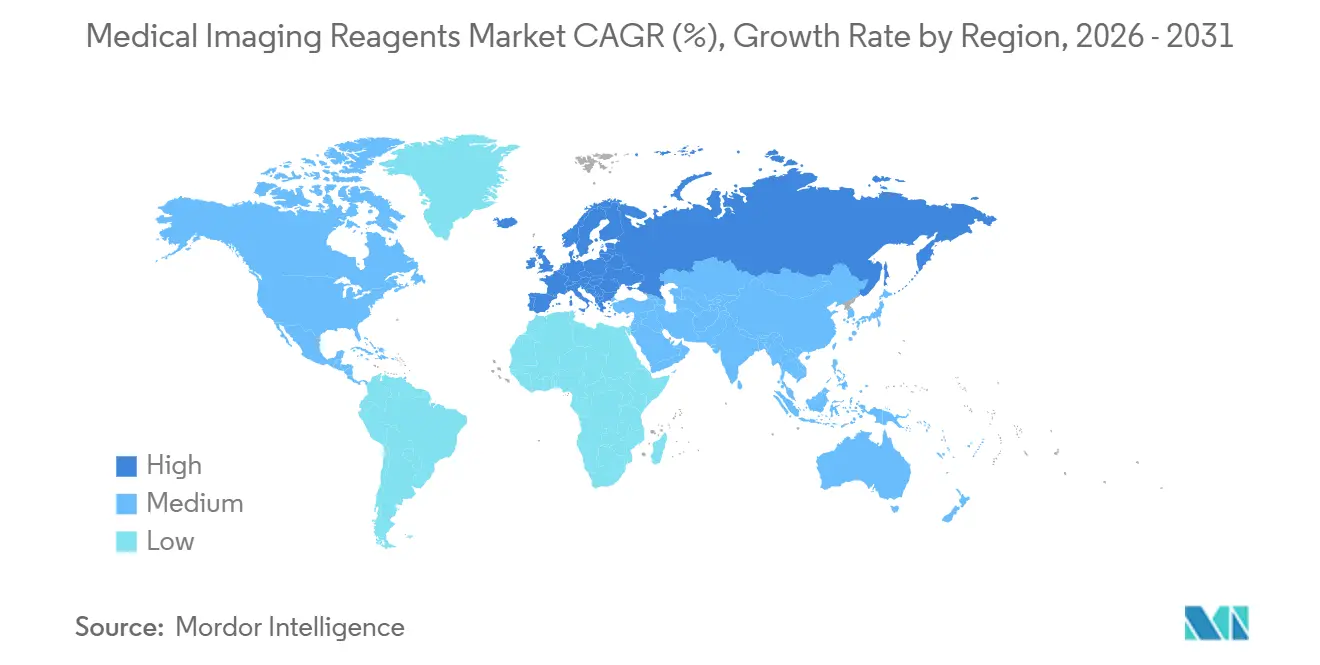
| Fastest Growing Market | Europe |
| Largest Market | North America |
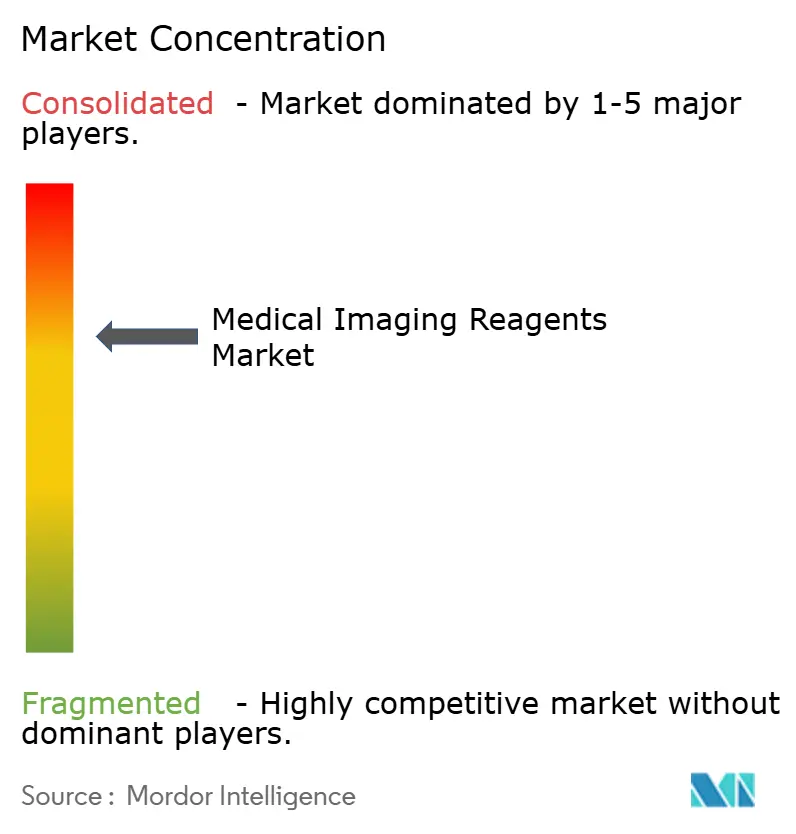
| Market Concentration | Medium |
Major Players *Disclaimer: Major Players sorted in no particular order Image © Mordor Intelligence. Reuse requires attribution under CC BY 4.0. | |
Medical Imaging Reagents Market Analysis by Mordor Intelligence
The Medical Imaging Reagents Market size is expected to increase from USD 16.20 billion in 2025 to USD 17.40 billion in 2026 and reach USD 25.10 billion by 2031, growing at a CAGR of 7.61% over 2026-2031.
Growing demand for precision diagnostics is turning contrast agents and radiopharmaceuticals into decision-making tools that guide targeted therapies rather than merely serve as passive visualization aids. Cancer imaging remains the largest revenue stream, propelled by PSMA-based positron-emission tomography (PET) protocols that strengthen the link between diagnosis and treatment. Reforms under the U.S. Outpatient Prospective Payment System (OPPS) are pushing procedure volumes toward ambulatory imaging centers, accelerating outpatient consumption of reagents. At the same time, European health authorities are mandating the use of macrocyclic gadolinium agents and reimbursing hybrid PET/CT examinations, catalyzing regional growth. Manufacturers are responding with multisite production footprints and dose-tracking software that embed reagents into connected workflows, protecting margins in an increasingly value-based purchasing environment.
Key Report Takeaways
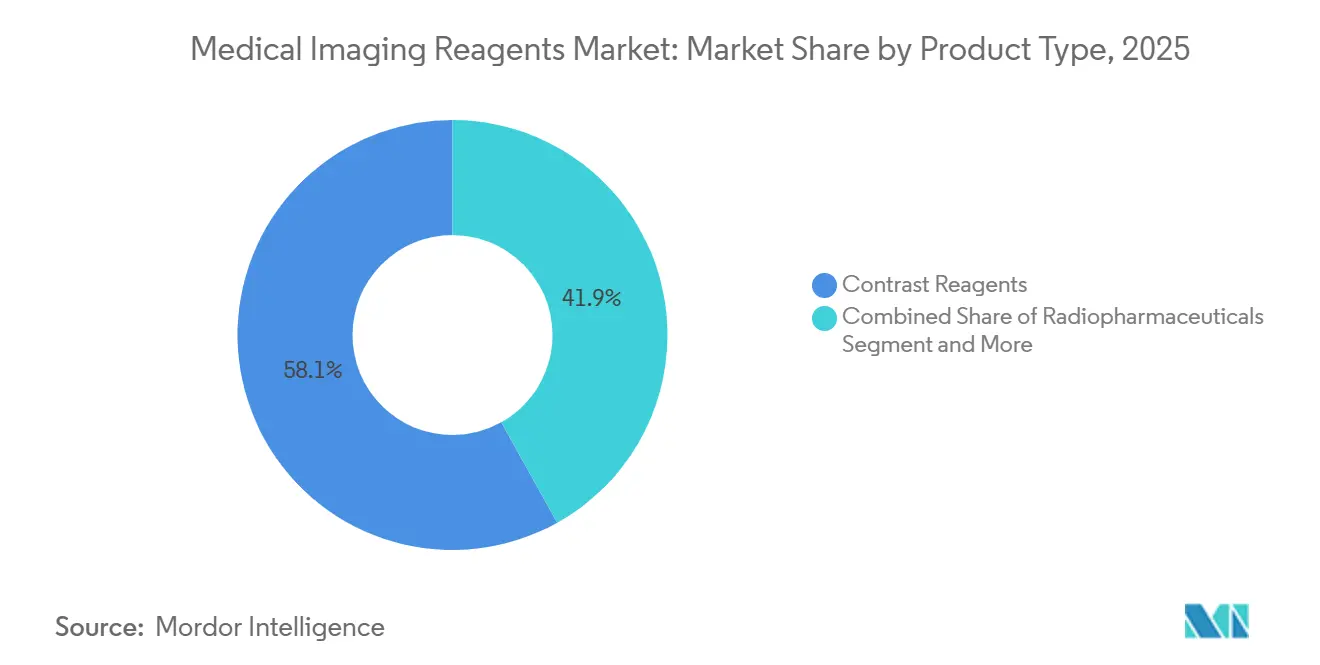
- By product type, contrast reagents led with 58.10% of the medical imaging reagents market share in 2025, while radiopharmaceuticals are projected to expand at an 8.05% CAGR through 2031.
- By modality, X-ray and computed tomography platforms accounted for 52.56% of the medical imaging reagents market in 2025. In contrast, hybrid PET/CT, PET/MRI, and SPECT/CT systems are set to grow at an 8.10% CAGR through 2031.
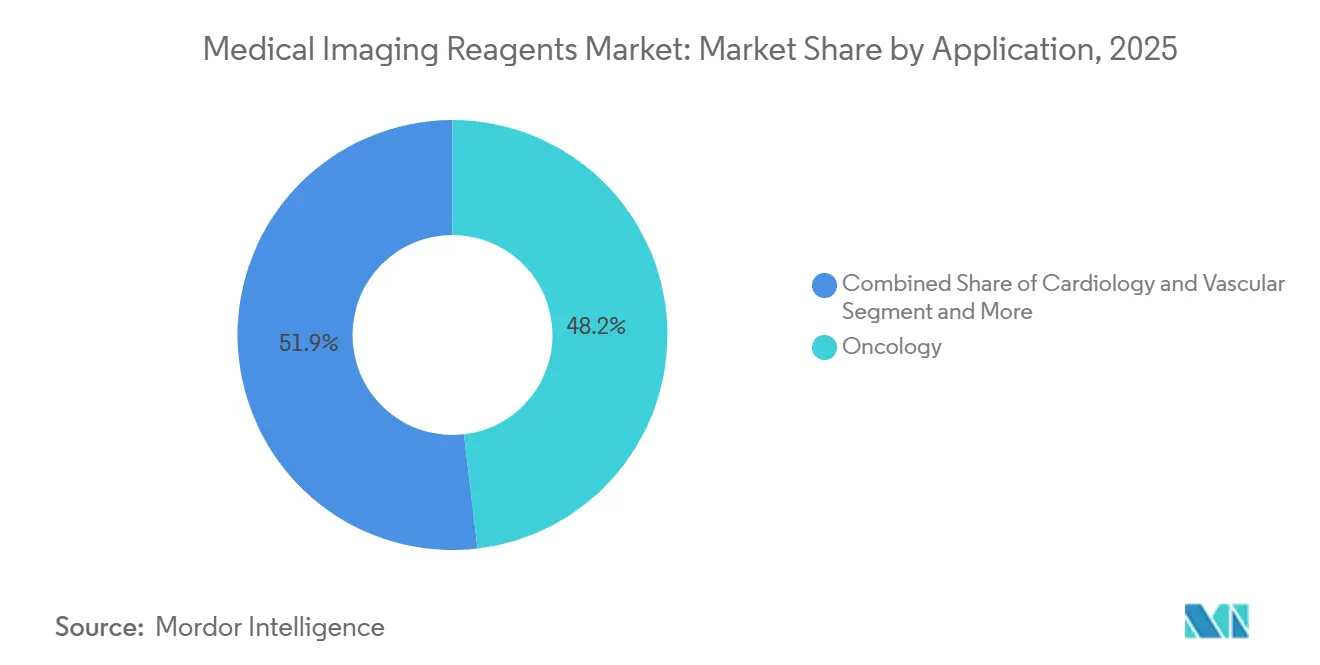
- By application, oncology accounted for 48.15% of 2025 revenue and is forecast to grow at a 7.98% CAGR through 2031.
- By end user, hospitals owned 43.29% share in 2025, but diagnostic imaging centers are advancing at a 7.85% CAGR on the back of reimbursement differentials that favor outpatient nuclear-medicine procedures.
- By geography, North America captured 39.16% of 2025 revenue, while Europe is poised to post the fastest 7.93% CAGR thanks to national imaging networks and early adoption of theranostic tracers.
Note: Market size and forecast figures in this report are generated using Mordor Intelligence’s proprietary estimation framework, updated with the latest available data and insights as of January 2026.
Global Medical Imaging Reagents Market Trends and Insights
Drivers Impact Analysis*
| Driver | (~) % Impact on CAGR Forecast | Geographic Relevance | Impact Timeline |
|---|---|---|---|
| Rapid adoption of PSMA PET imaging is expanding tracer utilization | +1.8% | North America and Europe leading; Asia-Pacific emerging | Short term (≤ 2 years) |
| Radiotheranostics pipeline boosting companion diagnostics | +1.5% | Global, with early gains in US, Germany, Australia | Medium term (2-4 years) |
| Asia-Pacific imaging capacity expansion and access improvements | +1.3% | China, India, Southeast Asia | Long term (≥ 4 years) |
| High CT/X-ray procedure growth is sustaining contrast media demand | +1.2% | Global, with concentration in North America, Europe, and Asia-Pacific urban centers | Medium term (2-4 years) |
| Reimbursement uplift for high-cost diagnostic radiopharmaceuticals | +0.9% | United States (CMS OPPS), select European national systems | Short term (≤ 2 years) |
| Supply diversification across contrast and isotopes | +0.6% | North America and Europe are manufacturing hubs | Medium term (2-4 years) |
| Source: Mordor Intelligence | |||
Rapid Adoption of PSMA-PET Imaging Expanding Tracer Utilization
Ga-68 and F-18 PSMA tracers have moved from niche research tools to mainstream prostate-cancer staging modalities after pivotal trials showed that management changed in 28% of recurrent-disease cases [1]American Society of Clinical Oncology, “PSMAfore Trial Results,” ASCOPUBS.ORG. The U.S. Food and Drug Administration (FDA) cleared Telix’s Illuccix in 2024 and broadened Novartis’s Pluvicto label in 2025, creating a closed-loop theranostic ecosystem in which PET scans guide lutetium-177 therapy. Revenue from Lantheus’s Pylarify hit USD 285 million during the first three quarters of 2024 after Medicare assigned dedicated payment codes that reimburse tracers at rates comparable to fluorodeoxyglucose (FDG). European uptake mirrors the U.S. trajectory; more than 50,000 PSMA-PET scans were logged in Germany in 2025, triple the 2023 volume, after statutory insurers instituted nationwide coverage. Urology groups are therefore investing in on-site cyclotrons and radiopharmacies to secure same-day deliveries, anchoring durable demand for high-specific-activity reagents.
Radiotheranostics Pipeline Boosting Companion Diagnostics
Successes with lutetium-177 therapies have spurred the development of next-generation alpha emitters, such as actinium-225 and lead-212, whose higher linear energy transfer promises deeper tumor control. ITM Isotope Technologies Munich raised EUR 50 million in 2024 to industrialize Ac-225 derived from thorium-229 decay, aiming to produce 10,000 patient doses per year by 2027. Companion diagnostics are compulsory for these trials, making baseline and follow-up PET scans integral to therapeutic approvals under the FDA draft guidance issued in 2025. Vendors have responded by embedding Monte-Carlo dosimetry software directly into hybrid PET/CT consoles, enabling point-of-care absorbed-dose calculations. As a result, diagnostic reagents now function as gatekeepers for trial enrollment, commercial therapy rollout, and payer coverage deliberations.
Asia-Pacific Imaging Capacity Expansion and Access Improvements
China’s Healthy China 2030 plan allocated around USD 16.5 billion between 2024 and 2026 to furnish county hospitals with CT and MRI systems, narrowing the urban-rural imaging gap. Siemens Healthineers and United Imaging each shipped more than 500 CT scanners to Chinese sites in 2025, with one-third placed in tier-3 cities where per-capita procedure volumes trail Beijing by a factor of five [2]Siemens Healthineers, “Biograph Vision Quadra Total-Body PET/CT,” SIEMENS-HEALTHINEERS.COM. India’s private hospital chains are following suit, installing PET/CT units in tier-2 locations such as Jaipur and Lucknow to capture rising cancer incidence and insurance penetration. Guerbet’s distribution pact with Trivitron extends the reach of iodinated contrast agents into cost-sensitive South Asian markets. Regional public-private partnerships are also launching hub-and-spoke PET networks that funnel patients from Indonesia and Malaysia to Singapore’s National University Hospital for total-body scans.
High CT/X-ray Procedure Growth Sustaining Contrast-Media Demand
Iodinated contrast remains the backbone of cross-sectional imaging as cardiologists shift from catheter-based coronary assessment toward CT angiography. Outpatient CT volumes with contrast increased 12% between 2024 and 2025 in the United States, driven by fractional-flow reserve protocols that obviate invasive diagnostics[3]American College of Radiology, “CT Contrast Media Guidelines,” ACR.ORG. Emergency departments are embedding contrast-enhanced CT in sepsis work-ups to localize occult abscesses within one hour of presentation. At the same time, oncology accounts for one-third of all enhanced CT studies. Bayer and Bracco have launched pre-filled syringes that reduce pharmacy compounding time and cut air-bubble artifacts, boosting same-day capacity. Dual-energy CT scanners that enable weight-based dosing have lowered per-patient contrast volume, stretching inventories during supply disruptions.
Restraints Impact Analysis*
| Restraint | (~) % Impact on CAGR Forecast | Geographic Relevance | Impact Timeline |
|---|---|---|---|
| Iodinated contrast media supply-chain vulnerability | -1.1% | Global, with an acute impact in North America during 2022-2024 | Medium term (2-4 years) |
| GBCA retention warnings and EU linear-agent restrictions | -0.8% | Europe (EMA restrictions), North America (FDA warnings) | Long term (≥ 4 years) |
| Mo-99/Tc-99m isotope supply fragility | -0.7% | Global, concentrated in regions dependent on aging European reactors | Long term (≥ 4 years) |
| Legacy packaging and uneven payer policies dampening diagnostic radiopharmaceutical uptake | -0.5% | United States, select European markets with restrictive coverage | Short term (≤ 2 years) |
| Source: Mordor Intelligence | |||
Iodinated Contrast-Media Supply-Chain Vulnerability
GE HealthCare’s 2022-2024 Omnipaque shutdown revealed brittle, single-site manufacturing dependencies that forced hospitals to ration CT studies. Interim American College of Radiology guidelines substituted non-contrast MRI for contrast-enhanced MRI and recommended half-dose protocols, measures that reduced diagnostic confidence and lengthened exam times. Bracco and Guerbet redirected European output to the United States, yet could not entirely bridge the gap. Regulators now require six-month strategic stockpiles and formal risk-management plans, but full compliance will not arrive until 2027. Upstream active-ingredient concentration in China and India remains unresolved, keeping the medical imaging reagents market exposed to geopolitical and pandemic shocks.
GBCA Retention Warnings and EU Linear-Agent Restrictions
The European Medicines Agency withdrew linear gadolinium products in 2017 after detecting gadolinium deposition in brain tissue, prompting a wholesale switch to macrocyclic agents. The FDA stopped short of a ban but mandated medication guides, fostering a mixed U.S. market in which academic centers have migrated to more expensive macrocyclic formulations, while many community hospitals still use linear agents for cost reasons. Macrocyclic dominance has pushed European per-dose costs to surge significantly, inflating operating budgets for MRI suites. Persistent uncertainty about clinical harm, particularly regarding pediatric MRI contrast use, limits growth. Vendors are therefore investing in manganese-based or ultra-low-dose alternatives, but regulatory hurdles mean widespread adoption is unlikely before 2029.
*Our forecasts treat driver/restraint impacts as directional, not additive. The impact forecasts reflect baseline growth, mix effects, and variable interactions.
Segment Analysis
By Product Type: Radiopharmaceutical Momentum Versus Contrast Scale
Radiopharmaceuticals are advancing at an 8.05% CAGR, the quickest clip among product classes, as theranostic pathways link diagnostic scans with targeted radionuclide therapy. Contrast reagents nevertheless account for 58.10% of 2025 revenue because iodinated media underpin the bulk of CT procedures, and gadolinium chelates dominate neuro-MRI. Ultrasound microbubble agents occupy a niche in Europe for cardiac perfusion and liver lesion characterization, while optical dyes such as indocyanine green support intraoperative visualization rather than standalone diagnostics.
Within the segment, PSMA tracers illustrate how a single molecule can eclipse legacy agents in value terms: Pylarify booked USD 380 million in 2024 sales after payer coverage expanded, eclipsing several mature contrast lines. New approvals for F-18 flotufolastat are intensifying price competition while lifting aggregate volume. Meanwhile, the fragility of the Tc-99m supply nudges clinicians toward PET alternatives that leverage longer-lived F-18, further tilting demand toward radiopharmaceuticals. As a result, radiopharmaceutical growth continues to outpace the rest of the medical imaging reagents industry.


By Modality: Hybrid Systems Anchor Next-Generation Workflows
Hybrid PET/CT, PET/MRI, and SPECT/CT platforms are growing at an 8.10% CAGR, outstripping standalone CT or MRI investment, because they deliver co-registered anatomic and molecular data in a single sitting. X-ray and CT retained a 52.56% share in 2025, thanks to high procedure volumes, but incremental growth is slowing as capital budgets shift toward hybrid scanners.
Total-body PET/CT systems, such as the Biograph Vision Quadra, cover head-to-thigh regions in 3 minutes, enabling dynamic whole-body pharmacokinetics and driving demand for high-specific-activity tracers. PET/MRI remains a premium niche due to price tags of USD 5-7 million and demanding physics, whereas SPECT/CT occupies the value tier for bone scans and sentinel-node mapping. The shift toward hybrid imaging cements a long-term need for both anatomical contrast agents and novel PET isotopes, reinforcing the diversity of the medical imaging reagents market.
By Application: Oncology Sets the Pace
Oncology delivered 48.15% of 2025 revenue and is projected to grow at a 7.98% CAGR as biomarker-driven therapies require molecular imaging confirmation before, during, and after treatment. Cardiology follows, leveraging iodinated contrast for CT angiography and gadolinium for stress-perfusion MRI as clinicians pivot away from invasive catheterization.
Neuro-imaging demand is climbing on the back of Medicare coverage for amyloid PET in Alzheimer’s disease. At the same time, gastroenterology benefits from hepatobiliary-specific gadolinium chelates that double as functional liver assays. Musculoskeletal applications remain comparatively small, limited to arthrography and the characterization of soft-tissue sarcomas. Oncology’s dominance thus anchors the medium-term revenue outlook for the medical imaging reagents market.
By End User: Outpatient Migration Reshapes Consumption Patterns
Hospitals controlled 43.29% of reagent revenue in 2025 but are experiencing muted growth as value-based payments redirect routine scans to lower-cost freestanding centers. Diagnostic imaging centers are posting a 7.85% CAGR because OPPS reforms widened the margin differential on outpatient nuclear-medicine studies.
Chains such as RadNet and Alliance HealthCare Services have installed extensive PET/CT capacity to capture PSMA and FDG volumes migrating out of hospitals. Ambulatory surgery centers are adopting intraoperative fluorescence imaging, adding procedural reagent demand that is less cyclical than diagnostic volumes. Academic institutes retain an outsized share of novel-tracer use but account for only a modest slice of the total medical imaging reagents market.
Geography Analysis
North America held the largest 39.16% revenue share in 2025, driven by early PSMA-PET and high per-capita imaging. Yet Europe will register the fastest CAGR of 7.93% as regulators subsidize hybrid PET/CT rollouts and enforce macrocyclic gadolinium policies. Germany alone installed more than 200 PET/CT scanners between 2024 and 2025 after nationwide reimbursement began.
Asia-Pacific is bifurcating: high-income city-states mirror Western usage patterns, while emerging economies focus on first-time deployment of modality. China’s county-hospital build-out and India’s tier-2 PET expansion promise long-run upside but currently trail Europe on per-capita reagent consumption. Middle East & Africa and South America remain import-dependent and vulnerable to currency swings, slowing medical imaging reagents market penetration.

Competitive Landscape
The medical imaging reagents market is structurally split. GE HealthCare, Bayer, Bracco, and Guerbet hold the majority of iodinated and gadolinium contrast production, leveraging global manufacturing scale and entrenched hospital formularies. Barring a transformative leap in safety or efficacy, new entrants face steep regulatory and capital barriers.
Radiopharmaceuticals are more fragmented; 15-30 companies are vying to scale PSMA, somatostatin receptor, and fibroblast activation protein tracers. Lantheus’s 2024 acquisition of POINT Biopharma for USD 1.4 billion highlighted the urgency of vertical integration as suppliers race to lock down isotope production and distribution. ITM, Orano Med, and Fusion Pharmaceuticals are meanwhile scaling up actinium-225 and lead-212 production ahead of therapeutic demand, betting on the superiority of alpha emitters.
Technology differentiation is drifting from reagent chemistry to delivery ecosystems. Bayer’s Medrad injectors track milliliter-level usage, while Bracco’s partnership with Siemens integrates contrast protocols into scanner consoles, creating sticky data-rich platforms. Disruptors such as Ascelia Pharma are introducing manganese-based MRI agents for patients with renal impairment, but limited commercial infrastructure keeps uptake modest.
Medical Imaging Reagents Industry Leaders
Cardinal Health
GE HealthCare
Guerbet SA
Bracco S.p.A
Bayer AG
- *Disclaimer: Major Players sorted in no particular order

Recent Industry Developments
- January 2026: Bayer has acquired two investigational imaging agents from Attralus Inc.—AT-01 (PET) and AT-05 (SPECT)—to strengthen its precision cardiology portfolio and enhance the diagnosis of cardiac amyloidosis, a rare, often fatal heart disease.
- January 2025: GE HealthCare announced it is investing USD 132 million to expand its Cork, Ireland, manufacturing site. This expansion is designed to meet surging global demand for contrast media, aiming to add 25 million patient doses annually by 2027.
- January 2025: Novartis gained FDA approval to extend Pluvicto to earlier-stage prostate-cancer patients, enlarging the treatable population by 40%.


Global Medical Imaging Reagents Market Report Scope
As per the scope of the report, medical imaging reagents are specialized substances administered to patients before diagnostic procedures to enhance the clarity and contrast of internal structures. These agents work by temporarily altering the way imaging technologies—such as X-rays, magnetic resonance imaging (MRI), and ultrasound—interact with body tissues, allowing clinicians to distinguish between healthy and diseased areas more easily.
The medical imaging reagents market is segmented by product type, modality, applications, end users, and geography. By product type, the market is segmented into contrast reagents, radiopharmaceuticals, ultrasound microbubble agents, and optical imaging dyes & probes. By modality, the market is segmented into X-ray & computed tomography, magnetic resonance imaging, ultrasound, nuclear imaging, and hybrid modalities. By application, the market is segmented into oncology, cardiology & vascular, neurology, gastroenterology & hepatology, musculoskeletal & orthopedics. By end user, the market is segmented into hospitals, diagnostic imaging centers, ambulatory surgical centers, and academic & research institutes.
Geographically, the market is segmented into North America, Europe, Asia-Pacific, the Middle East & Africa, and South America. The market report also covers the estimated market sizes and trends for 17 countries across major regions globally. For each segment, the market size and forecast are provided in terms of value (USD).
| Contrast Reagents |
| Radiopharmaceuticals |
| Ultrasound Microbubble Agents |
| Optical Imaging Dyes & Probes |
| X-ray & Computed Tomography (CT) |
| Magnetic Resonance Imaging (MRI) |
| Ultrasound (incl. CEUS) |
| Nuclear Imaging (SPECT & PET) |
| Hybrid Modalities (PET/CT, PET/MRI, SPECT/CT) |
| Oncology |
| Cardiology & Vascular |
| Neurology |
| Gastroenterology & Hepatology |
| Musculoskeletal & Orthopedics |
| Hospitals |
| Diagnostic Imaging Centers |
| Ambulatory Surgical Centers |
| Academic & Research Institutes |
| North America | United States |
| Canada | |
| Mexico | |
| Europe | Germany |
| United Kingdom | |
| France | |
| Italy | |
| Spain | |
| Rest of Europe | |
| Asia-Pacific | China |
| India | |
| Japan | |
| South Korea | |
| Australia | |
| Rest of Asia-Pacific | |
| Middle East & Africa | GCC |
| South Africa | |
| Rest of MEA | |
| South America | Brazil |
| Argentina | |
| Rest of South America |
| By Product Type | Contrast Reagents | |
| Radiopharmaceuticals | ||
| Ultrasound Microbubble Agents | ||
| Optical Imaging Dyes & Probes | ||
| By Modality | X-ray & Computed Tomography (CT) | |
| Magnetic Resonance Imaging (MRI) | ||
| Ultrasound (incl. CEUS) | ||
| Nuclear Imaging (SPECT & PET) | ||
| Hybrid Modalities (PET/CT, PET/MRI, SPECT/CT) | ||
| By Application | Oncology | |
| Cardiology & Vascular | ||
| Neurology | ||
| Gastroenterology & Hepatology | ||
| Musculoskeletal & Orthopedics | ||
| By End User | Hospitals | |
| Diagnostic Imaging Centers | ||
| Ambulatory Surgical Centers | ||
| Academic & Research Institutes | ||
| By Geography | North America | United States |
| Canada | ||
| Mexico | ||
| Europe | Germany | |
| United Kingdom | ||
| France | ||
| Italy | ||
| Spain | ||
| Rest of Europe | ||
| Asia-Pacific | China | |
| India | ||
| Japan | ||
| South Korea | ||
| Australia | ||
| Rest of Asia-Pacific | ||
| Middle East & Africa | GCC | |
| South Africa | ||
| Rest of MEA | ||
| South America | Brazil | |
| Argentina | ||
| Rest of South America | ||


Key Questions Answered in the Report
What is the market size of medical imaging reagents market by 2031?
The medical imaging reagents market size is expected to reach USD 25.10 billion by 2031, growing at a CAGR of 7.61% over 2026-2031.
Which segment is the largest consumer of reagents?
Oncology captured 48.15% of 2025 revenue, making cancer imaging the primary demand driver for the medical imaging reagents market.
What is driving Europe’s outperformance?
Macrocyclic gadolinium mandates and government-financed hybrid PET/CT roll-outs are pushing Europe toward a 7.93% CAGR through 2031.
Why are outpatient imaging centers gaining share?
OPPS reimbursement differentials now favor freestanding facilities, enabling imaging centers to grow at a 7.85% CAGR as hospitals cede routine scans
Page last updated on:


